INTRODUCTION
Hepatitis C is a global health problem and the World Health Organization currently estimates the worldwide prevalence of chronic hepatitis C infection to be 3% [1]. Complications of chronic infection include cirrhosis and hepatocellular carcinoma. In the UK, seroprevalence studies have mainly concentrated on specific high-risk groups such as injecting drug users (IDUs) [Reference Majid2–Reference Hutchinson5], or in highly selected low-risk groups such as blood donors [Reference Soldan, Barbara and Heptonstall6]. Although it is difficult to conduct prevalence surveys in a representative sample of the general population, information on the overall prevalence of hepatitis C can be derived from studies of lower risk populations such as antenatal women [Reference Balogun7–Reference Goldberg9] organ donors [Reference Wreghitt10] and health-care workers [Reference Zuckerman11]. During the 1990s, all such studies conducted in the UK found a prevalence of hepatitis C infection <1%. Based on specific studies, modelling has estimated that 0·53% of the general population in England has been infected with hepatitis C virus (HCV) [12]. Much of the uncertainty around a population estimate focuses on the number of people in high-risk groups, in particular IDUs and ex-injectors, and the number of such individuals included in any population survey.
Unselected convenience collections of serum samples from adults submitted to laboratories in England and Wales found an overall hepatitis C prevalence of 1·07%, 0·55% and 0·70% in 1986, 1991 and 1996, respectively [Reference Balogun13]. Convenience collections provide an opportunity to measure prevalence in male and female subjects over a wide age range and from different geographical regions. Although there is limited information available on the reason for testing, data from these convenience collections can provide some information to facilitate health-care planning. In the present study, samples of residual serum specimens from adult patients submitted to nine laboratories in England in 2000 were tested for antibody to hepatitis C virus (anti-HCV). We aimed to compare prevalence with previous surveys and to study factors associated with hepatitis C infection.
MATERIALS AND METHODS
Since 1986 the Health Protection Agency Seroepidemiology Unit (formerly the Public Health Laboratory Service Serological Surveillance Programme) has collected residual serum specimens submitted to Public Health and National Health Service Laboratories in England and Wales for routine diagnostic examination [Reference Osborne14]. Repeat specimens and those from immunocompromised persons are excluded. Samples specifically submitted for testing for HIV are also excluded. This convenience collection retains only source laboratory, age, sex, and year of specimen collection and has been used to investigate antibody prevalence for a number of other diseases of public health importance [Reference Balogun13, Reference Vyse15–Reference Morris20]. A total of 5068 anonymized residual serum specimens collected in 2000 from persons aged ⩾16 years were tested for anti-HCV. These specimens came from nine laboratories from the following English health regions: North West (2 laboratories), Yorkshire & Humberside (1), West Midlands (1), Eastern (1), South East (1) and South West (3).
A pooling strategy was used to test specimens for anti-HCV as described and validated previously [Reference Balogun13]. Pools of 12 serum specimens were tested using the Ortho HCV 3.0 ELISA Test System (enhanced SAVe) in the Omni autoanalyser (Biotek Instruments, USA). Each specimen incorporated into a reactive pool was subsequently tested individually by the standard (long) protocol for the Ortho HCV 3.0 ELISA Test System (enhanced SAVe). Each individual serum specimen that was reactive by the Ortho assay was tested with the Monolisa anti-HCV Plus (Bio-Rad Laboratories, USA). Specimens that were found to be discordant or weakly reactive by either or both assays were further tested with Ortho HCV RIBA 3. Specimens that were positive by the two separate ELISAs or one ELISA and RIBA were classified as being anti-HCV positive. Specimens that were weakly reactive by one or more ELISA and were RIBA indeterminate were classified as indeterminate.
These data were combined with the results from England only from a previous study using specimens collected in 1986, 1991 and 1996 that had been tested in an identical manner using the same laboratory assays [Reference Balogun13]. Multivariable logistic regression was used to investigate the prevalence of HCV and included factors for sex, birth cohort and health region. The proportions of those found to be positive by birth cohort and sex, and their corresponding 95% confidence intervals were estimated after adjusting for the other two variables in the model (study year and health region).
A further model was used to estimate the average proportion of those aged ⩾16 years who were susceptible to HCV in 1986 and acquired infection over the 14 years between 1986 and 2000 [Reference Vyse, Hesketh and Pebody21]. This modelled the prevalence for each birth cohort using the equation:
where λ86–00=the proportion of those susceptible to HCV aged ⩾16 years in 1986 who acquired infection over the 14 years between 1986–2000; P00c=model prevalence in 2000 in birth cohort ‘c’; P86c=model prevalence in 1986 in birth cohort ‘c’.
The final model categorized birth cohort according to grouped years of birth (from the periods 1910–1919 to 1960–1970) and included two parameters for λ86–00, one for those born during 1910–1949 and one for those born during 1950–1970.
A binomial maximum-likelihood method was used to fit the model to the data, obtaining maximum log-likelihood estimates for the parameters for each group of years of the 20th century represented. Likelihood-based 95% confidence intervals for estimates for λ86–00 were obtained by finding the maximum and minimum values for which the deviance was within 3·84 of the minimum. Using mid-year 2000 population estimates for England for those aged 30–90 years [Office for National Statistics (www.statistics.gov.uk)] and age-specific susceptibility estimates in 1986, the average number of HCV infections that occurred in those susceptible born 1910–1970 over the 14 years between 1986 and 2000 were estimated.
RESULTS
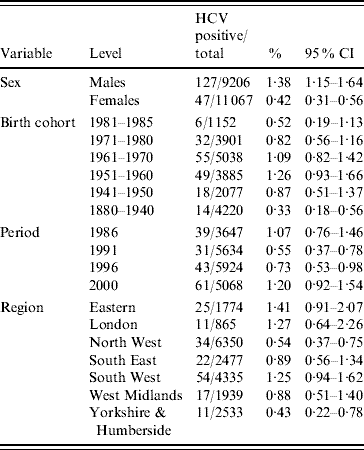
Testing of 5068 specimens from 2000 gave an overall anti-HCV prevalence of 1·2% (95% CI 0·92–1·54). Of the 5007 specimens found to be anti-HCV negative, 12 were indeterminate after subsequent RIBA testing and therefore excluded from the HCV-positive group. Combined data for all four years is shown in Table 1.
Table 1. Prevalence of HCV and 95% confidence intervals (CI) (1986–2000)

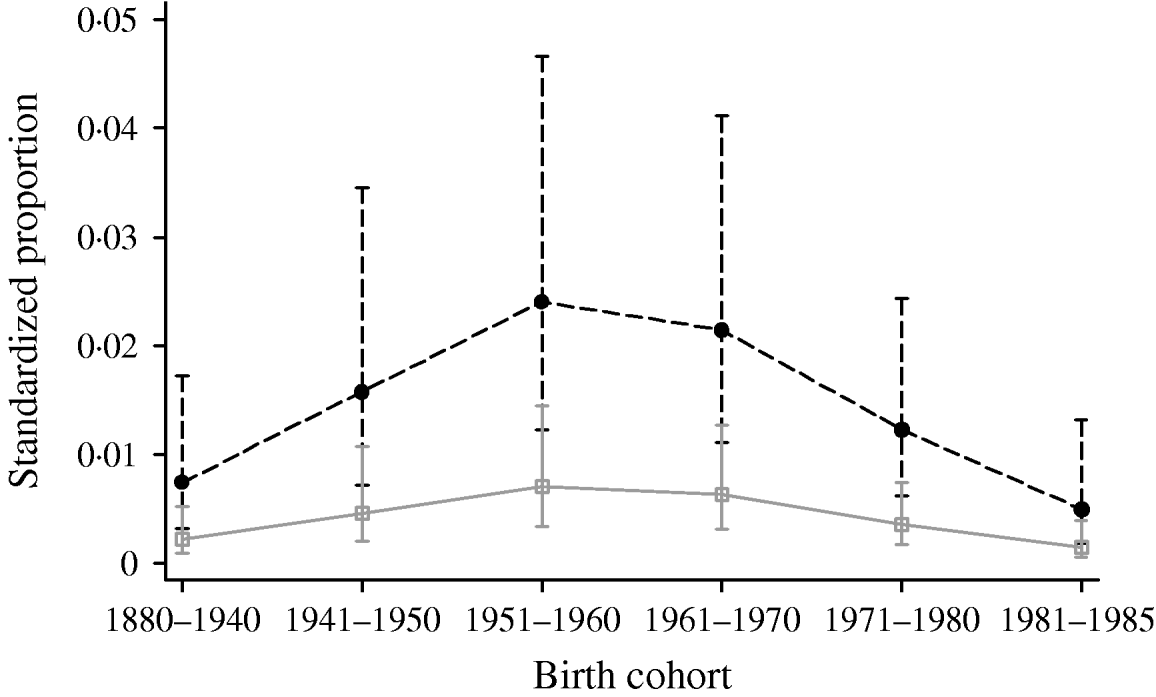
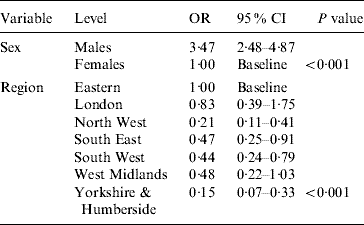
Multivariable logistic regression analysis presented in Table 2 incorporating data from all four periods (1986, 1991, 1996 and 2000) showed that males had higher odds of being HCV positive [odds ratio (OR) 3·47, 95% confidence interval (CI) 2·48–4·87] compared to females (P<0·001). Across the different regions there was a significant difference in prevalence (P<0·001). Specimens from Yorkshire & Humberside (OR 0·15, 95% CI 0·07–0·33) and North West (OR 0·21, 95% CI 0·11–0·41) regions were less likely to be positive compared with other regions. The estimated standardized HCV-positive percentages together with their corresponding 95% confidence intervals by birth cohort and sex are given in Figure 1.

Fig. 1. Standardized proportion of HCV positives by birth cohort and gender adjusted by year and region. - -•- -, Males; –□–, females.
Table 2. Multivariable logistic regression model showing the HCV odds ratios by sex, and region (adjusted for birth cohort and period)

OR, Odds ratio; CI, confidence interval.
The model estimating the proportion susceptible to HCV born between 1910 and 1970 who acquired infection between 1986 and 2000 fitted the data well (deviance=5·2, d.f.=4). It estimated that an average of 0·72% (95% CI 0–1·65) of those born between 1950 and 1970 and 0% (95% CI 0–0·42) of those born between 1910 and 1949 who were susceptible to HCV in 1986 acquired infection over these 14 years, respectively. Applying these point estimates to the Office for National Statistics population data suggests 106 000 persons born between 1910 and 1970 acquired HCV infection between 1986 and 2000 (i.e. an average of 7571 persons born 1910–1970 acquired HCV infection per year between 1986 and 2000).
DISCUSSION
This study analysed HCV antibody prevalence data from 1986, 1991, 1996 and 2000 to provide both a more contemporary perspective on HCV prevalence and explore how the epidemiology may have changed over the 14-year period from 1986 to 2000 in specific birth cohorts (those born in or before 1970).
Caution should be exercised in interpreting the findings from this study as specimens used are not a random sample of the population, but are considered to approximate the general population. The serum specimens used in this study were submitted for diagnostic and screening examination. A recent study comparing a random cluster survey to a convenience collection in Australia provided similar estimates for immunity to vaccine-preventable diseases in children [Reference Kelly22]. The samples tested in this study may include individuals who have been admitted or investigated for the complications of injecting drug use or of liver disease and individuals at high risk who are being tested for bloodborne virus infections, including hepatitis C itself. Since each laboratory offers a comprehensive diagnostic service it is believed that there are unlikely to be any major differences between laboratories regarding submission of specimens at each point in time. However, the differences found over time may reflect major changes in the nature of diagnostic samples being submitted to laboratories.
Analysis of the four periods (1986, 1991, 1996 and 2000) showed that the overall prevalence was low, and is associated with period of birth. The highest prevalence is seen in those born between 1950 and 1970, confirming earlier findings [Reference Balogun13]. This study of residual specimens from 1986 to 1996 used an age-period cohort model and demonstrated that the highest prevalence of hepatitis C was seen in individuals born between 1946 and 1970, with a lower prevalence in more recent birth cohorts. This suggested that the majority of infected people had acquired the infection prior to 1986, probably as a result of sharing paraphernalia for the purpose of injecting illicit drugs at some time during the 1960s and 1970s.
Overall, analysis of data for all four periods showed that for each year of sample collection, prevalence was higher in males compared to females, consistent with national laboratory surveillance [Reference Gungabissoon, Balogun and Ramsay23]. For the sample set collected in 2000 the observed male:female ratio was 3·47:1, slightly higher than the observed male:female ratio in other prevalence studies, including residual specimens from 1986 to 1996 [Reference Balogun13], heterosexuals attending GUM clinics [Reference Balogun24], and individuals undergoing diagnostic testing for hepatitis C [Reference Brant25].
Prevalence varied significantly by region in the present study. In earlier surveys, prevalence was higher in London compared to the rest of England. Studies have shown that there are marked geographical differences in hepatitis C prevalence amongst IDUs [26], with London, East Midlands and the North West having the highest observed prevalence. In our study in 2000, specimens were not available from London laboratories but samples from other known high-prevalence areas such as the North West were included. This study clearly found high prevalence levels in Eastern England, with a substantially lower prevalence in the North West and the Yorkshire & Humberside region. This suggests that convenience collections of this type may not be good at capturing samples from current injectors. A low prevalence of ex-injectors in the North West was identified in previous HCV modelling estimates (D. De Angelis, personal communication) and suggests that our observed regional variation may reflect the relative numbers of ex-injectors and non-injectors who are infected in each region.
The present study suggests that a small proportion of those susceptible to HCV born between 1950 and 1970 acquired the infection between 1986 and 2000, equating to around 106 000 individuals. All of these infections were estimated to have occurred in those aged between 16 and 36 years in 1986 and, with few exceptions, are likely to have been acquired through injecting drug use. In the UK illicit injecting drug use usually commences in late adolescence and early adulthood, and lasts for ~9 years [Reference Sutton27]. There was no evidence of HCV acquisition in persons born before 1950, suggesting that infection through injecting drug use is less likely to occur in those aged >30 years. Our findings (an average of 7571 infections per year between 1986 and 2000) are consistent with previous modelling. This modelling suggested that HCV incidence increased during the 1980s in England, reaching an annual incidence of 12 650 (95% credible interval 6150–26 450) by 1989 [Reference Sweeting28].
Routine national surveillance in England suggests that those who inject drugs illicitly are at the highest risk of infection [Reference Gungabissoon, Balogun and Ramsay23]. Small changes in the number of IDUs in the population have the potential to produce more substantial changes in the overall prevalence of hepatitis C over time. We know that the proportion of IDUs who report having had a confidential test for hepatitis C has increased in recent years and testing for other bloodborne viruses, such as HIV is also likely to have increased [26, Reference Hughes, Simms and Leong29]. It is therefore important that other population-based surveys are conducted to support or reject our findings. HCV prevalence and incidence are low in the general population of England. Consistent surveillance is required to inform and monitor prevention and control measures. In particular the focus should be on identifying high-risk groups such as IDUs and preventing infection. If these actions targeted at IDUs are not improved and maintained the future burden on health-care resources as a result of liver disease due to hepatitis C infection will be considerable.
ACKNOWLEDGEMENTS
We thank all the laboratories that have contributed to the study and collaborated with the HPA Seroepidemiology Unit. We also thank Ms. Ingrid Hamilton for carrying out the confirmatory testing of specimens. This study was funded by the Public Health Laboratory Service Small Scientific Initiative Fund.
DECLARATION OF INTEREST
None.


