


1. Introduction
The analysis of unsteady flow past bluff bodies is of great practical importance for various engineering applications. These typical flows at high Reynolds number are encountered in the airflow around high-rise buildings (Tominaga Reference Tominaga2015), chimneys (Jiang & Yoshie Reference Jiang and Yoshie2020), tube banks in heat exchangers (Mangrulkar et al. Reference Mangrulkar, Dhoble, Chakrabarty and Wankhede2017) and wakes of trains and trucks (Paul, Johnson & Yates Reference Paul, Johnson and Yates2009). At low Reynolds numbers, these flow characteristics are commonly seen in mechanisms of electronics and chips(Rastan, Sohankar & Alam Reference Rastan, Sohankar and Alam2017), roughness elements in pipes (Goswami & Hemmati Reference Goswami and Hemmati2020, Reference Goswami and Hemmati2021a,Reference Goswami and Hemmatib) and wall anomalies in the aorta (Jia et al. Reference Jia, Punithakumar, Noga and Hemmati2021). Bluff bodies, such as prisms, have an extended flow region of velocity deficit behind them, referred to as the wake (Von Kármán Reference Von Kármán1963). Characterization of these wakes for various bodies has proven challenging due to their complexities, since conditions at either end of the body alter the vortex shedding patterns and consequently flow structures. To this end, studying the wake of a wall-mounted prism with a finite height constitutes a classical problem in fluid mechanics, which has been the focus of extensive research for decades, such as Taneda (Reference Taneda1952), Wang & Zhou (Reference Wang and Zhou2009), Saha (Reference Saha2013) and Wang & Lam (Reference Wang and Lam2019).
The wake of a wall-mounted finite rectangular prism is dominated by end effects, especially an induced downwash flow (Sumner et al. Reference Sumner, Rostamy, Bergstrom and Bugg2017). Thus, the wake three-dimensionality becomes more profound compared with those of infinite span (Norberg Reference Norberg1993; Ying, Xu & Zhang Reference Ying, Xu and Zhang2012; Ranjan & Dewan Reference Ranjan and Dewan2016; Mashhadi, Sohankar & Alam Reference Mashhadi, Sohankar and Alam2021) and two-dimensional prisms (Okajima Reference Okajima1982; Park, Yoon & Ha Reference Park, Yoon and Ha2013). The wake features for a wall-mounted finite prism can be divided into three components: free-end downwash, wall–body junction upwash and the free shear flow (Wang et al. Reference Wang, Zhou, Chan and Lam2006; Wang & Zhou Reference Wang and Zhou2009; Bourgeois, Sattari & Martinuzzi Reference Bourgeois, Sattari and Martinuzzi2011). These end effects result in additional flow complexities and vortex shedding patterns. The free-end downwash flow is induced by tip vortices generated due to shear-layer separation at the free end, while the wall–body junction upwash is induced by the generation of counter-rotating base vortices at the wall–body junction (Wang et al. Reference Wang, Zhou, Chan and Lam2006). The induced upwash and downwash effects entrain the flow into the mid-span of the prism, resulting in the generation of mid-span coherent structures. Thus, the wake becomes highly three-dimensional. Further, the wall–body junction induces a shear-layer roll-up in front of the body (Simpson Reference Simpson2001). This results in the formation of a horseshoe vortex at the base, which is generally associated with downward flow (Simpson Reference Simpson2001). The vortical structures in the wake of such bodies are significantly affected by various critical parameters, such as aspect ratio (Wang et al. Reference Wang, Zhou, Chan and Lam2006; Wang & Zhou Reference Wang and Zhou2009; Bourgeois et al. Reference Bourgeois, Sattari and Martinuzzi2011; Saha Reference Saha2013; Sumner et al. Reference Sumner, Rostamy, Bergstrom and Bugg2017), Reynolds number (Hwang & Yang Reference Hwang and Yang2004; Zhang et al. Reference Zhang, Cheng, An and Zhao2017), incident (yaw) angle (Castro & Robins Reference Castro and Robins1977; Becker, Lienhart & Durst Reference Becker, Lienhart and Durst2002; Zargar et al. Reference Zargar, Gungor, Tarokh and Hemmati2021a), boundary layer thickness (Hosseini, Bourgeois & Martinuzzi Reference Hosseini, Bourgeois and Martinuzzi2013; El Hassan, Bourgeois & Martinuzzi Reference El Hassan, Bourgeois and Martinuzzi2015), cross-sectional shape (Uffinger, Ali & Becker Reference Uffinger, Ali and Becker2013; Kindree, Shahroodi & Martinuzzi Reference Kindree, Shahroodi and Martinuzzi2018) and depth ratio (Zargar, Tarokh & Hemmati Reference Zargar, Tarokh and Hemmati2021b).
An abundant literature exists that focuses on reporting the effects of aspect ratio (Sakamoto & Arie Reference Sakamoto and Arie1983; Saha, Muralidhar & Biswas Reference Saha, Muralidhar and Biswas2000; Wang et al. Reference Wang, Zhou, Chan and Lam2006; Wang & Zhou Reference Wang and Zhou2009; Saha Reference Saha2013; McClean & Sumner Reference McClean and Sumner2014) and Reynolds number (Zhou, Zhang & Yiu Reference Zhou, Zhang and Yiu2002; Wang & Lam Reference Wang and Lam2019; Yauwenas et al. Reference Yauwenas, Porteous, Moreau and Doolan2019) in characterizing the large-scale vortical structures behind wall-mounted finite prisms. Several studies on wall-mounted finite prisms have established that changing the Reynolds number does not alter the presence of the main features of the wake topology, such as the horseshoe vortex, tip and base vortex and mid-span vortex shedding (Saha et al. Reference Saha, Muralidhar and Biswas2000; Krajnović & Davidson Reference Krajnović and Davidson2005; Zhang et al. Reference Zhang, Cheng, An and Zhao2017), while they do alter the wake dynamics associated with such structures. To this effect, Saha et al. (Reference Saha, Muralidhar and Biswas2000) numerically showed that the wake of a wall-mounted finite prism at a Reynolds number of  $Re = 100$ has negligible change compared with the wake (coherent topological components) of a two-dimensional prism at $Re = 21\,400$ (Lyn et al. Reference Lyn, Einav, Rodi and Park1995) and $Re = 140\,000$ (Cantwell & Coles Reference Cantwell and Coles1983). The vortex shedding is suppressed by reducing the Reynolds number or prism aspect ratio. For example, Zargar et al. (Reference Zargar, Tarokh and Hemmati2021b) reported this suppression at a Reynolds number of 250 for an aspect ratio of $1.2$, which corroborated the results of Saha (Reference Saha2013), who associated this with an aspect ratio of 2 at a Reynolds number of $250$. Further, the mid-span coherent structures, as well as the cross-sectional wake topology, vary with changes in the prism aspect ratio. The experimental study of Sakamoto & Arie (Reference Sakamoto and Arie1983) on the flow past finite circular and square wall-mounted prisms revealed two types of vortex structures in the wake for aspect ratios of 1–8 in a turbulent boundary layer. These structures were the Kármán-type and arch-type structures, which were strongly influenced by the aspect ratio. To this effect, the arch-type structures only appeared at aspect ratios below $2$. Thus, there is a threshold in aspect ratio below which the downwash flow in the near-wake region suppresses the periodic and asymmetric Kármán-type vortex shedding. This process was restored for aspect ratios above this threshold. Evolution of vortex shedding mechanisms by decreasing the aspect ratio confirmed the importance of geometrical parameters in defining the wake topology. Later, Wang & Zhou (Reference Wang and Zhou2009) modified the earlier model of Wang et al. (Reference Wang, Zhou, Chan and Lam2006) and revealed the presence of a single arch-type structure in the near-wake region. They argued that the spanwise base and tip vortices are inherently connected to form an arch-type structure. Further, Wang & Zhou (Reference Wang and Zhou2009) reported that arch-type structures may shed into the wake in the form of hairpin-like vortices. These structures were unique to large aspect ratios. However, in case of small aspect-ratio prisms (e.g. a cube), Hwang & Yang (Reference Hwang and Yang2004), Yakhot, Liu & Nikitin (Reference Yakhot, Liu and Nikitin2006) and Diaz-Daniel, Laizet & Vassilicos (Reference Diaz-Daniel, Laizet and Vassilicos2017) reported only hairpin-like vortices in the wake, which are usually formed in a particular range of Reynolds numbers ( $Re>500$). The formation of hairpin-like structures in these studies were attributed to destabilization of the shear layer that had separated from the top leading edge of the prism. Despite these efforts, there has not been a comprehensive study of effect of the cylinder depth ratio on wake mechanisms and vortex development.
The cross-sectional wake topologies for wall-mounted finite square prisms are categorized as either dipole, quadrupole or multipole systems, depending on the aspect ratio, Reynolds number and boundary layer thickness (Hosseini et al. Reference Hosseini, Bourgeois and Martinuzzi2013; Zhang et al. Reference Zhang, Cheng, An and Zhao2017; Yauwenas et al. Reference Yauwenas, Porteous, Moreau and Doolan2019; Rastan et al. Reference Rastan, Shahbazi, Sohankar, Alam and Zhou2021). At comparable Reynolds number and boundary-layer conditions, however, the cross-sectional wake topology depends on the prism aspect ratio. A threshold aspect ratio exists, which separates the dipole and quadrupole systems, above and below it (Sakamoto & Arie Reference Sakamoto and Arie1983; Wang & Lam Reference Wang and Lam2019). For aspect ratios below the threshold, the downwash flow induced by the tip vortices was dominant, resulting in a dipole-type system. For larger aspect-ratio prisms, the downwash effects were corroborated by upwash effects induced by the base vortices, which formed a quadrupole-type system (Sakamoto & Arie Reference Sakamoto and Arie1983). Here, the base vortices had opposite vorticity compared with the tip vortex. At comparable flow conditions, a similar threshold in aspect ratio was identified for wall-mounted finite circular prisms (Sakamoto & Arie Reference Sakamoto and Arie1983). While this threshold aspect ratio was significantly larger  $(AR_t=3)$ than that of square prisms $(AR_t=2)$, the transitions in wake topology were consistent for both geometries (Sakamoto & Arie Reference Sakamoto and Arie1983; Agui & Andreopoulos Reference Agui and Andreopoulos1992; Okamoto & Sunabashiri Reference Okamoto and Sunabashiri1992).
Contrary to square or circular prisms with a large aspect ratio, there have not been many studies on the influence of the depth ratio of rectangular prisms. A majority of the research efforts in this area have focused on infinite-span prisms or flat plates which are a special case of a very thin infinite-span prism (Narasimhamurthy & Andersson Reference Narasimhamurthy and Andersson2009; Ying et al. Reference Ying, Xu and Zhang2012; Ranjan & Dewan Reference Ranjan and Dewan2016; Hemmati, Wood & Martinuzzi Reference Hemmati, Wood and Martinuzzi2018). In brief, the variations in depth ratio resulted in changes in the global aerodynamic features, such as the mean drag coefficient ( $\overline {C_d}$) and the shedding frequency ( $St_{sh}$) (Mashhadi et al. Reference Mashhadi, Sohankar and Alam2021). Increasing the prism depth ratio led to a lower $St_{sh}$ and $\overline {C_d}$. The wake dynamics of large depth-ratio prisms differs from that of finite square prism due to the flow reattachment–separation mechanism on the prism free surfaces that influences the downstream wake (Wang & Zhou Reference Wang and Zhou2009). Below, we look at a handful of studies focused on the effect of the depth ratio on the wake of rectangular prisms.
Joubert, Harms & Venter (Reference Joubert, Harms and Venter2015) analysed the wake of a wall-mounted finite prism with a depth ratio of 2.63 and aspect ratio 5 at a Reynolds number of  $7.6\times 10^4$. Their results revealed that, after the initial flow separation, the shear-layer reattachment only occurred for the top surface and not for the side surfaces. Wang & Lam (Reference Wang and Lam2019) observed similar results, and reported that the depth ratio does not influence the mean wake structures as long as the flow separation and reattachment does not occur on the side surfaces. The experimental and numerical study of Rastan et al. (Reference Rastan, Shahbazi, Sohankar, Alam and Zhou2021) on the wake of a prism with aspect ratio 7 and depth ratios of 1–4 at a Reynolds number of $1.2\times 10^4$ showed that flow reattachment occurred on the top and side surfaces for depth ratios larger than 3. The downwash flow weakened with increasing depth ratio, until it completely vanished at a depth ratio of 3. Thereafter, the upwash flow intensified (Rastan et al. Reference Rastan, Shahbazi, Sohankar, Alam and Zhou2021). Thus, the cross-sectional wake transformed from dipole type for depth ratios of 1–2 to a no-pole-type system for depth ratios 3–4. Further, the numerical study of Zargar et al. (Reference Zargar, Tarokh and Hemmati2021b) revealed that the wake of a low aspect-ratio (1.2) prism remains steady between Reynolds numbers of 50 and 250 for both small and large depth ratios (i.e. 0.83–3). Zargar et al. (Reference Zargar, Tarokh and Hemmati2021b) observed that the upwash effects were supressed and downwash effects intensified with increasing depth ratio. The upwash flow remained dominant at the symmetry plane ( $z/d = 0$) while the downwash flow was evident close to the prism side and rear faces due to the arching shape of the near-wake vortex roll-up. The difference observed between Zargar et al. (Reference Zargar, Tarokh and Hemmati2021b) and Rastan et al. (Reference Rastan, Shahbazi, Sohankar, Alam and Zhou2021) stems from the aspect-ratio effects and trailing-edge flow separation in the case of the former study.
Another important aspect of the wake of low aspect-ratio wall-mounted prisms is the near-wake low- and high-frequency instability processes (Kindree et al. Reference Kindree, Shahroodi and Martinuzzi2018; Morton et al. Reference Morton, Martinuzzi, Kindree, Shahroodi and Saeedi2018). In short, they are the harmonics of the dominant shedding frequency in the near wake. The analysis of such a complex flow field and inherent instabilities in the flow is mainly performed in the past literature using Floquet analysis (Williamson Reference Williamson1988; Barkley & Henderson Reference Barkley and Henderson1996) and model reduction methods (Akhtar, Nayfeh & Ribbens Reference Akhtar, Nayfeh and Ribbens2009; Rowley et al. Reference Rowley, Mezić, Bagheri, Schlatter and Henningson2009; Khalid et al. Reference Khalid, Wang, Akhtar, Dong and Liu2020; Schmid Reference Schmid2010). In post-processing, model reduction methods such as proper orthogonal decomposition, or POD (Kindree et al. Reference Kindree, Shahroodi and Martinuzzi2018; Morton et al. Reference Morton, Martinuzzi, Kindree, Shahroodi and Saeedi2018), and dynamic mode decomposition, or DMD (Rowley et al. Reference Rowley, Mezić, Bagheri, Schlatter and Henningson2009; Schmid Reference Schmid2010), are useful techniques to investigate complex flow phenomena. Using POD, Morton et al. (Reference Morton, Martinuzzi, Kindree, Shahroodi and Saeedi2018) established that the near wake of a wall-mounted finite circular prism consists of a vortex shedding instability centred at the shedding Strouhal number ( $St_{sh}$) as well as low-frequency signatures centred at $St_{sh}/2$ and $St_{sh}/4$. They further observed that such low-frequency signatures are independent of Reynolds number, defined based on prism width ( $d$) over the range of $300\unicode{x2013}1.18\times 10^4$, but dependent on the boundary layer state, and hence the Reynolds number based on boundary-layer thickness. Morton et al. (Reference Morton, Martinuzzi, Kindree, Shahroodi and Saeedi2018) further proposed that such low-frequency instabilities are only observed in circular cross-section prisms with aspect ratios smaller than 4. Further, Kindree et al. (Reference Kindree, Shahroodi and Martinuzzi2018) expanded on this study by investigating the low-frequency periodicity of both circular and square cross-section prisms of aspect ratio 4, which were positioned inside a thin laminar boundary layer. This study reported the low-frequency instability in sharp-edged prisms, i.e.- square cross-section. Hence, reducing the aspect ratio of wall-mounted prisms highly influences the wake structure by means of the free-end instabilities. To this end, it is important to explore how the larger depth ratio of a prism can impact the free-end instabilities, and thus the wake topology and dynamics.
Finally, extra wake features become an important aspect of the flow around prisms. These features include secondary vortex structures appearing in the wake alongside the coherent structures, such as arch-type, Kármán-type or hairpin-like vortex shedding. Diaz-Daniel et al. (Reference Diaz-Daniel, Laizet and Vassilicos2017) observed secondary vortex structures in the wake of wall-mounted prisms at  $Re\geq 600$, placed symmetrically alongside the primary vortex structures. They attributed such structures to secondary interactions caused by the vortical motion of the horseshoe vortex legs. Further, three-dimensional turbulent effects, with increase in Reynolds number, cause stronger interactions between the vortices. This results in a higher number of secondary structures that lose streamwise coherence in close vicinity to the prism.
Khan et al. (Reference Khan, Khan, Sharma and Agrawal2020a) numerically studied the laminar vortex shedding regime of flow around a suspended cube to examine the three-dimensional vortex shedding mechanism and understand the temporal behaviour of the wake. They observed hairpin-like shedding in the wake, which appeared asymmetric in one plane and symmetric in the orthogonal streamwise plane. They also observed secondary structures forming between two shedding hairpins. The secondary structures formed limbs, protruded from the first hairpin-like structure, which connected the two primary hairpin structures. Khan, Sharma & Agrawal (Reference Khan, Sharma and Agrawal2020b) noted similar wake structures at moderate Reynolds numbers. In the case of flow around wall-mounted finite prisms, no clear consensus was identified in the terminology of secondary vortex structures and their interactions. Zhang et al. (Reference Zhang, Cheng, An and Zhao2017) identified the formation of a secondary tip vortex from the top surface of the prism leading edge, naming it a tornado-like tip vortex due to its spiralling rotations in the mean wake. These observations were consistent with the findings of Rastan et al. (Reference Rastan, Shahbazi, Sohankar, Alam and Zhou2021), who reported that secondary tip vortices vanished in the vicinity of the prism. Both these studies discussed secondary vortex structures in terms of time-averaged streamwise vortices observed in the wake. The insight into the interactions of secondary vortex structures with the shedding of coherent structures remains unexplored in the literature.
There exists a knowledge gap on the implications of the depth ratio for the wake topology and vortex dynamics for flow over wall-mounted prisms with small aspect ratios. This work, thus, aims to numerically study the wake of wall-mounted finite prisms with an aspect ratio of 1 over a range of depth ratios between 0.016 and 4. The minimum depth ratio considered here accounts for the special case of a very thin wall-mounted prism (similar to a flat plate), in which shear-layer reattachment does not occur. This allows for a comprehensive comparison of the wake dynamics with cases of long prisms, in which shear-layer reattachment changes the wake behaviour. This enables thorough study of the wake evolution mechanisms associated with free-end features and shear-layer dynamics of long prism geometries. This paper is structured in such a way that the problem description is provided in § 2, which is followed by the results in § 3 and conclusions in § 4.
2. Problem description
The flow over wall-mounted prisms of different depth ratios is investigated numerically using OpenFOAM. The flow and the geometrical parameters were selected following the experimental study of Wang & Zhou (Reference Wang and Zhou2009) and numerical set-up of Zargar et al. (Reference Zargar, Gungor, Tarokh and Hemmati2021a). The computational domain containing the wall-mounted prism as well as the definition of the coordinate system is schematically presented in figure 1. The streamwise ( $x$), spanwise ( $z$) and normal ( $y$) dimensions of the prism are presented in terms of the length ( $l$), width ( $d$) and height ( $h$). Here, a rectangular prism with an aspect ratio of $AR = h/d = 1$ was mounted on the base of the domain. Six depth ratios ( $DR = l/d$) were considered, namely $0.016, 0.1, 0.3, 1, 2$ and $4$. The study of $DR = 0.016$ represents a special case of a wall-mounted very thin prism, the wake of which has been partly characterized in the literature in terms of flow over fences. All numerical simulations were performed at Reynolds numbers of $Re = U_{b}d/\nu = 50\unicode{x2013}500$, where $U_b$ is the free-stream velocity and $\nu$ is the kinematic viscosity. This range of Reynolds number was selected based on the findings of Zargar et al. (Reference Zargar, Gungor, Tarokh and Hemmati2021a,Reference Zargar, Tarokh and Hemmatib), who established that the wake topologies for thin and long prisms differ at $Re=250$. At $Re=250$, the wake experiences transition from steady to unsteady with changing depth ratio. Although, Mashhadi et al. (Reference Mashhadi, Sohankar and Alam2021) established that the unsteady flow past infinite-span prisms at small depth ratios occurs at $Re = 50\unicode{x2013}80$, the origins of unsteady wake development for smaller depth-ratio finite prisms is not well known. This hints at the particular motivation for the current study to look at the implications of depth ratio and extension of the shear layer on wake topology and the evolution of vortex structures.

Figure 1. Schematics of computational domain (not to scale).
The computational domain size was selected as  $L_u = 10d$, $L_d = 20d$, $H = 6d$ and $W = 12d$, as shown in figure 1. More details on the computational domain can be found in table 1. This numerical study was set up following detailed sensitivity studies on the computational domain size in Saha (Reference Saha2013) and Zargar et al. (Reference Zargar, Gungor, Tarokh and Hemmati2021a). More discussion on the domain size is provided later in this section. Figure 2 presents the distributions of time-averaged and root-mean-squared streamwise velocity normalized by free-stream velocity ( $U_b$), i.e. $\bar {u}$ and $u^\prime$, in the case of free flow with no prism. The dashed line shows the boundary-layer thickness ( $\delta$), which is calculated as $\delta /d\approx 3$. Thus, it appears that the prism is fully immersed in the laminar boundary layer. It is important to note that a laminar boundary layer is expected at low Reynolds numbers between 50 and 500 (Saha Reference Saha2013; Zargar et al. Reference Zargar, Tarokh and Hemmati2021b). The boundary layer may have a pronounced effect on the flow structures around the wall-mounted prism. To this effect, Wang et al. (Reference Wang, Zhou, Chan and Lam2006) showed that increasing the boundary-layer thickness enhances the near-wake upwash flow significantly.
Table 1. Case studies and parameter space for wall-mounted cases.


Figure 2. Distribution of the time-averaged and root-mean-square of streamwise velocity, i.e.  $\bar {u}$ and $u^\prime$, normalized by free-stream velocity ( $U_b$). Measurements were performed in the absence of the prism. Dashed line shows the boundary-layer thickness ( $\delta /d$).
2.1. Numerical set-up
The numerical simulations were carried out by directly solving the incompressible Navier–Stokes and continuity equations using the finite-volume-based open-source computational fluid dynamics package OpenFOAM (Weller et al. Reference Weller, Tabor, Jasak and Fureby1998). More details on the computational algorithms, the solver and their accuracy for bluff body wake dynamic analyses can be found in Zargar et al. (Reference Zargar, Tarokh and Hemmati2021b), Zargar et al. (Reference Zargar, Gungor, Tarokh and Hemmati2021a) and Verma & Hemmati (Reference Verma and Hemmati2021). All the flow parameters were normalized by the bulk velocity ( $U_b$) and the width of the prism ( $d$).
$d$).
Non-homogeneous, multi-block girds, consisting of  $7.32\times 10^6\unicode{x2013}10.6\times 10^6$ hexahedral elements were utilized for $DR = 0.016\unicode{x2013}4$, respectively. As an example, the grid distribution for the smallest depth ratio ( $DR= 0.016$), which constitutes the most complex wake dynamics, is shown in figure 3. The grid set-up was similar to those of previous numerical studies (Saha Reference Saha2013; Zargar et al. Reference Zargar, Gungor, Tarokh and Hemmati2021a), where the finer grid was placed close to the prism and the wall. This enabled accurate simulation of the anisotropic small-scale flow structures in the vicinity of the prism, as well as downstream wake structures. Furthermore, the expansion ratio of the grid was kept below $3\,\%$. A constant uniform velocity inlet boundary condition was used at the inlet boundary, while an outflow Neumann-type boundary condition was applied at the outlet, based on which $\partial \psi /\partial n = 0$, where $\psi$ is any flow variable. The ceiling and lateral boundaries were modelled as free-slip impermeable boundary, which enabled zero normal velocity and zero shear stress for viscous flow. A no-slip boundary condition was used for the prism surfaces and the ground.

Figure 3. The spatial grid distribution for the wall-mounted thin prism of  $DR = 0.016$. The grid is shown for a part of the domain. Top view at $y/d = 0.5$ (a) and side view at $z/d = 0$ (b).
The diffusive and convective terms of the governing equations were discretized, spatially and temporally, using second-order accurate numerical schemes. A second-order implicit backward Euler scheme was utilized for temporal discretization. The discretized equations were solved using pimpleFoam, a transient solver for incompressible, turbulent flow, incorporating the PIMPLE algorithm, a combination of pressure implicit with splitting operator (PISO) and semi-implicit method for pressure linked equation (SIMPLE) algorithms. pimpleFoam is utilized in PISO mode by specifying single outer-correction iteration with a predictor step and three pressure correction loops to couple the pressure and velocity equations. A preconditioned bi-conjugate gradient iterative solver was utilized to solve both the pressure and pressure–velocity coupled equations. The diagonal incomplete-Cholesky preconditioner was used for the pressure equation and diagonal incomplete lower–upper (LU) preconditioner method was used in the pressure–velocity coupled equation. The absolute error tolerance criterion for pressure and velocity was set at  $10^{-6}$.
The time marching calculations were carried out by selecting a time step of  $\Delta t^* = \Delta t U_b/d = 0.0065$. The maximum Courant–Friedrichs–Levy number for these simulations was $0.72$. All simulations were continued for $20$ flowthrough times, where a flowthrough time is defined as the time fluid takes to travel from inlet to outlet. This flowthrough time criterion corresponded to 120 vortex shedding cycles, from which the last 50 vortex shedding cycles were considered for post-processing. All simulations were completed using 48 Intel Platinum 8160 F Skylake 2.1 GHz cores and 192 GB of shared physical memory, using an average of $1.5\times 10^4$ core hours per simulation on Compute Canada clusters.
2.2. Verification and validation studies
Numerical simulations were verified by evaluating the sensitivity of results to the domain size and grid resolution, following the recommendation of Hemmati et al. (Reference Hemmati, Wood and Martinuzzi2018). To address the former, the present domain was designed to be larger than previous studies (Saha Reference Saha2013; Saeedi, LePoudre & Wang Reference Saeedi, LePoudre and Wang2014; Rastan et al. Reference Rastan, Shahbazi, Sohankar, Alam and Zhou2021). Further, the present domain size was comparable to that of Zargar et al. (Reference Zargar, Gungor, Tarokh and Hemmati2021a), who had shown their domain size to be sufficiently large to minimize any sensitivity of the simulation results to the size of their domain and position of the boundaries. Thus, we do not provide more information on our sensitivity analysis of the domain size. Instead, we refer the reader to the extensive sensitivity studies reported by Zargar et al. (Reference Zargar, Tarokh and Hemmati2021b,Reference Zargar, Gungor, Tarokh and Hemmatia). On the criteria for blockage ratio ( $\beta$) and the domain height ( $H$), we set these as 0.01 and $6d$, respectively. These followed the practices of Sohankar, Norberg & Davidson (Reference Sohankar, Norberg and Davidson1998) and Saha (Reference Saha2013), based on which $\beta = (d\times h)/(W\times H) \leq 0.05$ and $H\geq h+5d$, to ensure that there are no significant effects on the global flow quantities.
For the effect of the spatial grid, a grid sensitivity analysis was performed using three successively refined grids for  $DR=0.016$ at $Re=250$: Grid 1 ( $141\times 59\times 105$), Grid 2 ( $183\times 92\times 156$) and Grid 3 ( $227\times 142\times 228$). The case of $DR=0.016$ was selected for the grid sensitivity study since it is expected to provide the most complex unsteady wake dynamics compared with the other depth ratios. The global flow quantities, including the Strouhal number and the mean drag coefficient, as well as the mean and turbulent variables were compared for the three grids. Table 2 compares the Strouhal number and the time-averaged (mean) coefficient of drag achieved from the three grids. Here, the Strouhal number is defined by $St_{sh} = f_{sh}d/U_b$, where $f_{sh}$ is the vortex shedding frequency. The mean drag coefficient is given by $\overline {C_d} = \overline {F_d}/0.5\rho {U_b}^2 d h$, where $\overline {F_d}$ is the mean drag force acting on the prism. The comparison in table 2 indicates that results from Grid 2 and Grid 3 were in close agreement. The maximum deviation in Strouhal number between Grid 2 and Grid 3 was ${\sim }4\,\%$ and that for the mean drag coefficient was ${\sim }0.5\,\%$. Since these variations are less than $5\,\%$, one can argue that Grid 2 is sufficiently fine to properly capture global flow features.
Table 2. Grid sensitivity analysis results for wall-mounted thin prism case ( $DR = 0.016$).

The grid sensitivity analysis was expanded by tracing the effects of grid resolution on mean velocities, Reynolds normal stress ( $\overline {u^\prime u^\prime }$), and the turbulence kinetic energy ( $k = (\overline {u^\prime u^\prime } + \overline {v^\prime v^\prime } + \overline {w^\prime w^\prime })/2$). While the grid sensitivity was performed at two streamwise locations (i.e. $x/d = 3$ and $5$), only the results at $x/d = 3$ are shown in figures 4 and 5 for brevity. The mean streamwise and normal velocity profiles are compared in figure 4, where the difference between Grid 2 and Grid 3 was not substantial inside the base region ( ${\sim }5\,\%$). However, a slight discrepancy, corresponding to a maximum of ${\sim }11\,\%$, was noted in the normal velocity predictions. Figure 5 compares the profiles of Reynolds normal stress ( $\overline {u^\prime u^\prime }$), which was the largest stress in the near-wake region, and turbulence kinetic energy ( $k$). The results were consistent with those of the mean flow field, meaning that the turbulent field was not sensitive to the spatial grid size for Grid 2 and Grid 3. Although Grid 2 was sufficient for accurately solving the flow, we opted to use Grid 3 to ensure the grid resolution was sufficient for capturing all small- and large-scale flow features. Finally, examination of the spatial resolution was complemented by investigating the ratio of grid size to Kolmogorov length scale ( $\varDelta /\eta$) (Moin & Mahesh Reference Moin and Mahesh1998; Kawamura et al. Reference Kawamura, Seki, Iwamoto and Kawamura2007; Narasimhamurthy & Andersson Reference Narasimhamurthy and Andersson2009; Saeedi et al. Reference Saeedi, LePoudre and Wang2014; Hemmati et al. Reference Hemmati, Wood and Martinuzzi2018; Rastan et al. Reference Rastan, Shahbazi, Sohankar, Alam and Zhou2021). For the critical case of $DR=0.016$, $\varDelta /\eta \leq 2$ was ensured for the entire domain, stringently following the criteria of Yakhot et al. (Reference Yakhot, Liu and Nikitin2006) and Saeedi et al. (Reference Saeedi, LePoudre and Wang2014). For further information refer to the Appendix.

Figure 4. Effect of grid size on mean velocities at  $x/d = 3$ and $y/d = 0.5$, for prism of $DR = 0.016$ at a Reynolds number of $250$. Shown are profiles of (a) $\bar {U}$ and (b) $\bar {V}$.

Figure 5. Effect of grid size on wake turbulence characteristics at  $x/d = 3$ and $y/d = 0.5$, for prism of $DR = 0.016$ at Reynolds number of $250$. Shown are profiles of (a) $k/U_b^2$ and (b) $\overline {u^\prime u^\prime }/U_b^2$.
There have been several attempts to validate the numerical results obtained using OpenFOAM and the current set-up in comparison with validated numerical results of Saha (Reference Saha2013) and Zhang et al. (Reference Zhang, Cheng, An and Zhao2017). This was due to limited experimental analyses for larger depth-ratio prisms. Details of these comparisons can be found in Zargar et al. (Reference Zargar, Tarokh and Hemmati2021b,Reference Zargar, Gungor, Tarokh and Hemmatia), which we do not present here for brevity. These validation studies confirmed that the current set-up and numerical solvers can capture the wake topology accurately, as well as the boundary layer prior to and after the prism.
3. Results and discussion
We begin by classifying the wake topology as steady or unsteady at a range of Reynolds number and depth ratios. Here, a steady wake is defined by the absence of any fluctuations in either the wake or forces, whereas unsteady wakes feature small and large wake variations and force fluctuations. A wake map is presented in figure 6 for wall-mounted prisms of different depth ratios at different Reynolds numbers. Here, the wake is classified as either steady or unsteady, and is further sub-divided into symmetric and asymmetric wakes. For clarity, symmetric wakes are defined by the symmetric orientation of the main instantaneous wake features about the mid-planar axis, such as hairpin-like structures, tip and base vortices, as well as the horseshoe vortex. Contrarily, asymmetric wakes exhibit vortical features with distortions about the mid-planar axis, leading to sideway (spanwise) tilting of the shed structures. This highlights a change in wake topology that closely depends on the prism depth ratio at a range of Reynolds numbers for a low aspect-ratio body. In particular, results in figure 6 indicate that the wake is steady for  $DR=0.016$ until $Re=150$, after which it becomes unsteady. The Reynolds number at which this wake transition occurs increases with increasing depth ratio, such that the wake remains steady up to $Re=200$ for $DR=0.1$ and $Re=400$ for $DR=1$. In previous studies, the unsteady wake transition as a function of Reynolds number is mainly discussed with increasing aspect ratio. Saha (Reference Saha2013) identified transitional flow at a Reynolds number of $250$ for an $AR=2$ prism, while Zhang et al. (Reference Zhang, Cheng, An and Zhao2017) identified similar unsteady transition for a $AR = 4$ prism at a Reynolds number of $150$. In the case of a wall-mounted cube, this transition was noted at $Re=500$ (Diaz-Daniel et al. Reference Diaz-Daniel, Laizet and Vassilicos2017). In the present study, we scrutinize such transitions as a function of Reynolds number and depth ratio. Further classification of the unsteady wake also reveals interesting topological differences that are identified in terms of wake symmetry, or the lack thereof. Here, we only focus on identifying and characterizing the wake mechanism at Reynolds numbers of 250 and 500, since the wake remains coherent without three-dimensional turbulent effects that could complicate the flow at high Reynolds numbers (Saha Reference Saha2013; Zargar et al. Reference Zargar, Gungor, Tarokh and Hemmati2021a). Moreover, these Reynolds numbers exhibit both categories of unsteady wake, the mechanisms associated with which are important in the development of the wake topology. However, discussions on the changing wake topology with Reynolds number and depth ratio form the basis of a future study.

Figure 6. Classification of the wake topology in terms of Reynolds number and depth ratio.
We proceed with characterizing the instantaneous wakes starting with the lowest depth ratio ( $DR=0.016$) at $Re=250$. There exists a wake unsteady transition with increasing depth ratio at this Reynolds number. The wake is unsteady for $DR \leq 0.1$ and it transitions to a steady wake for $DR = 0.3\unicode{x2013}4$. Moreover, the wake of the very thin prism exhibits unique features at $Re=250$, leading to asymmetric characteristics. These were not observed at lower Reynolds numbers or for larger depth ratios. The characterization of these wake features are initially discussed in the next section, followed by analysing the mechanisms associated with the wake development for low depth-ratio prisms, i.e. $DR\leq 0.1$, and characterizing secondary structures in the wake in latter sections.
3.1. Wake classification
The wake classification in figure 6 identifies that the Reynolds number threshold for transition to an unsteady wake increases with increasing depth ratio. It becomes clear that the wake is steady for all depth ratios at  $Re\leq 150$. With further increase in Reynolds number to $200$, a transition to an unsteady wake occurs for $DR = 0.016$, while the wake of $DR\geq 0.1$ remains steady. At $Re=250$, the wake transitions from unsteady to steady with changing depth ratio. Moreover, the wake of the very thin prism exhibits asymmetric characteristics, which change to symmetric shedding, followed by a steady wake at larger depth ratios. Although it is important to identify how wake topology changes with increasing Reynolds number and depth ratio, and the correspondence between the two parameters, this analysis falls outside the scope of the current study. Instead, we only focus on identifying and characterizing the wake at $Re=250$, as well as the mechanism of asymmetric wake patterns that are observed at $Re\geq 250$. To this effect, we begin by examining the wake of our thin prism ( $DR=0.016$) at $Re=250$, which is the onset of wake asymmetry. Please note that our analyses are also valid for larger depth ratios or Reynolds numbers, as long as the wake classification remains the same as that identified for the thin prism at the given Reynolds number.
Figure 7 shows the wake topology behind the very thin prism ( $DR=0.016$) over the range of $Re=150\unicode{x2013}500$. These results identify a clear change in wake topology with changing Reynolds number. The case of a very thin prism is selected because it clearly marks the onset of an unsteady wake, as well as transition from symmetric to asymmetric wake characteristics Similar analyses can be undertaken for any other depth-ratio and Reynolds number cases, and similar observations are expected for the same wake topology (classifications based on figure 6). Unsteady wake structures, their formation, evolution and interactions are investigated using the $Q$-criterion, as described by Hunt, Wray & Moin (Reference Hunt, Wray and Moin1988) and Jeong & Hussain (Reference Jeong and Hussain1995). Iso-surface plots overlaid with mean streamwise velocity ( $\bar {u}/U_b$) contours in figure 7 demonstrate the transition of wake features with changing Reynolds number for $DR = 0.016$. At $Re\leq 150$, the wake remains steady, and the formation of a horseshoe vortex (Simpson Reference Simpson2001) and leading-edge shear-layer separation are clear. The onset of an unsteady wake occurs at a Reynolds number of $200$, which is characterized by the formation of symmetric hairpin-like vortices. Diaz-Daniel et al. (Reference Diaz-Daniel, Laizet and Vassilicos2017) reported similar symmetric wake structures behind a cube. They attributed the symmetric shedding to the interaction of tip vortices, formed at the upper part of the prism side surfaces, with the shear layer created over the prism, leading to flow unsteadiness. Further increase in Reynolds number to $250$ leads to asymmetric hairpin-like wake structures. At $Re = 500$, the wake of a very thin prism, although unsteady and asymmetric, cannot maintain its coherence far downstream. This could be attributed to stronger interactions between the shed structures, as a result of increased unsteadiness (Diaz-Daniel et al. Reference Diaz-Daniel, Laizet and Vassilicos2017; Zargar et al. Reference Zargar, Gungor, Tarokh and Hemmati2021a). Here, the wake asymmetry is characterized by distortion of the head of the hairpin-like structure, which leads to spanwise (sideways) tilting of structures, as noted in figure 7(c). Identifying the wake features that are altered by the changing depth ratios and characterizing secondary structures and their interactive mechanisms with the wake form the basis of our analyses for the remainder of this paper.

Figure 7. Instantaneous vortex structures of a  $DR = 0.016$ prism identified using $Q^* = 6\times 10^{-6}$ and overlaid with mean streamwise velocity ( $\bar {u}/U_b$), at (a) $Re = 150$; (b) $Re = 200$; (c) $Re = 250$; and (d) $Re = 500$. All panels are shown in three-dimensional view.
Since the onset of asymmetric wake occurs at  $Re=250$, we look at instantaneous streamwise vorticity ( $\overline {\omega _x}^*$) contours for the case of a very thin prism at $Re = 250$ and $500$ in figure 8. These results enable us to investigate the formation, interaction and distortion of near-wake vortical structures. There are three main observations that can be discussed with respect to the results in figure 8. First, the wake appears symmetric in the immediate vicinity of the prism at $x/d = 0$. Two pairs of counter-rotating tip vortices are noted here, with the primary tip vortex forming on the top part of the prism side surface, and the secondary tip vortex forming on the prism top surface. This is consistent with the wake topology of wall-mounted prisms (Rastan et al. Reference Rastan, Shahbazi, Sohankar, Alam and Zhou2021). The second observation is that near-wake structures lose streamwise coherence due to stronger interaction between shed structures and increased unsteadiness with increasing Reynolds number towards $Re=500$. As such, structures at $x/d = 1$ for $Re=500$ appear distorted compared with $Re=250$. The third observation relates to an influx of vorticity at $x/d = 2$, which corresponds to the formation of secondary vortex structures in the wake. These secondary structures appear distorted at higher Reynolds numbers, compared with $Re=250$, possibly due to incoherent interactions with the separating shear layers from the prism top and side surfaces (Diaz-Daniel et al. Reference Diaz-Daniel, Laizet and Vassilicos2017). These secondary structures also appear in the case of symmetric unsteady wakes (i.e. $DR=0.1$ at $Re=250$ in figure 25), in which case they are placed symmetrically in the wake. Thus, we expand on our investigation of the mechanism of wake asymmetry based on these observations focusing on the case of $Re=250$, which enables characterization of the wake devoid of major incoherent, transient effects.

Figure 8. Contours of instantaneous streamwise vorticity ( $\overline {\omega _x}^*$) structures (solid blue lines: positive values, dashed red lines: negative values) for $DR = 0.016$ at (a–c) $Re=250$ and (d–f) $Re=500$. The line contour cutoff levels for $\overline {\omega _x}^*$ are ${\pm }0.12$ and the contour interval is $0.001$. The contours are shown at $x/d = 0, 1$ and $2$.
$2$.
Finally, it becomes important to scrutinize variations in the flow dynamics at higher depth ratios for the given ranges of Reynolds numbers for completeness. Figure 6 reveals that the unsteady asymmetric wake exists for  $DR=0.9$ at $Re=400$, while it vanishes for a Reynolds number of $500$. It is evident from the iso-surface plots shown in figure 9 showing that $DR=1$ at a Reynolds number of $500$ results in an asymmetric unsteady wake, which quickly becomes steady with increasing depth ratio to $1.5$. Trailing-edge flow separation as a result of shear-layer reattachment on the prism top and side surfaces for large depth-ratio ( $DR\geq 1$) prisms leads to the suppression of unsteady flow characteristics (Rastan et al. Reference Rastan, Shahbazi, Sohankar, Alam and Zhou2021; Zargar et al. Reference Zargar, Tarokh and Hemmati2021b). For the present study, figure 9 shows trailing-edge flow separation for the case of $DR=1.5$ at $Re=500$, resulting in steady flow.

Figure 9. Instantaneous vortex structures for (a)  $DR = 1$ and (b) $DR=1.5$ prisms at a Reynolds number of $500$, identified using $Q^* = 6\times 10^{-6}$ and overlaid with mean streamwise velocity ( $\bar {u}/U_b$). All panels are shown in three-dimensional view.
3.2. Instantaneous wake characteristics
We begin our wake analysis by looking at the asymmetric unsteady wake formation at  $Re=250$. Iso-surface plots are overlaid by the mean streamwise velocity ( $\bar {u}/U_b$) contours in figure 10, which demonstrate a difference in the wake with changing depth ratio. The wake of prisms with $DR = 0.016$ and $0.1$ is unsteady at $Re=250$, while that of $DR\geq 0.3$ is steady. This indicates an unsteady-to-steady transition of the flow with increasing depth ratio. The two common features of the wake, for all the cases considered here, are the formation of horseshoe vortices in front of the prism, and the shear-layer separation at the leading edge. The latter folds after the initial separation on the top and side surfaces of the prism as the depth ratio increases. Hereinafter, we will only focus on the unsteady wake features and their formation mechanisms, unique characteristics and potential sources.

Figure 10. Instantaneous vortex structures identified using  $Q$-criterion and overlaid with mean streamwise velocity ( $\bar {u}/U_b$), for (a) $DR = 0.016$; (b) $DR = 0.1$; (c) $DR = 0.3$; (d) $DR = 1$; (e) $DR = 2$; and ( f) $DR = 4$, at a Reynolds number of $250$. The threshold of $Q^* = 6\times 10^{-6}$ is used for $DR= 0.016,0.1,1\unicode{x2013}4$, while $Q^* = 1\times 10^{-6}$ is used for $DR=0.3$ to avoid distorted contours. All panels are shown in three-dimensional view.
The flow around a wall-mounted prism with a very small depth ratio ( $DR<0.3$ at $Re=250$) experiences shear-layer separation and roll-up, leading to vortex shedding. The wakes of such prisms are dominated by hairpin-like vortices that are formed along the top face of the prism. These are clearly identified in figure 10(a,b). This is consistent with the observations of Hemmati, Wood & Martinuzzi (Reference Hemmati, Wood and Martinuzzi2016), who identified the wake of a finite aspect-ratio normal thin flat plate is dominated by vortex loops that are shed on the longer edges with legs that are ‘peeled off’ from the side (shorter) edges. Here, the head of the hairpin-like structure moves faster downstream compared with its legs. Thus, wake structures appear elongated or distorted in the streamwise direction. This observation is consistent with the fact that head of the hairpin is closer to the free stream, while the legs are located closer to the boundary layer on the ground. Further, shedding of hairpin-like structures changes from asymmetrically to symmetrically placed hairpins with increasing depth ratio from $0.016$ to $0.1$. This hints at the implications of depth ratio in restoring the flow symmetry (Diaz-Daniel et al. Reference Diaz-Daniel, Laizet and Vassilicos2017), which remains prevalent for $DR\geq 0.3$ (steady cases).
Hairpin-like structures were symmetrically placed due to the flow separation–reattachment processes on the prism top surface at a depth ratio of  $0.1$, which is consistent with the results of Hwang & Yang (Reference Hwang and Yang2004), Yakhot et al. (Reference Yakhot, Liu and Nikitin2006) and Diaz-Daniel et al. (Reference Diaz-Daniel, Laizet and Vassilicos2017) for a cube. Here, the results thus far clearly identify that the wake of a small aspect-ratio prism with a very small depth ratio is asymmetric at $Re=250$, while the wake symmetry is restored with reattachment of the shear layer on the body with increasing depth ratio. In simpler terms, we provide evidence that increasing the depth ratio leads to restoration of the flow symmetry in small aspect-ratio prisms.
The steady wakes observed for cases of  $DR \geq 0.3$ in figure 10(c–f) exhibit initial flow separation on the leading edge of the prism that is followed by a shear-layer reattachment on top and side faces. This process suppresses the wake three-dimensionality and unsteadiness according to Zargar et al. (Reference Zargar, Gungor, Tarokh and Hemmati2021a) and Rastan et al. (Reference Rastan, Shahbazi, Sohankar, Alam and Zhou2021). Two aspects of flow separation are observed in the steady wake. First, a pair of tip and base vortices are identified in figure 10(c) ( $DR=0.3$), which are either not formed or quickly distorted for $DR >0.3$ in figure 10(d–f). The existence of tip vortices for $DR= 0.3$ hints at the dominance of downwash induced flow, based on the discussions of Zargar et al. (Reference Zargar, Tarokh and Hemmati2021b), which intensifies with increasing depth ratio. Traces of tip vortices are missing for the case of $DR >0.3$ in figure 10(d–f), which is attributed to folding of initial shear-layer separation on the surfaces of the prism. The second feature of the wake involves an initial shear-layer separation and reattachment on the top and side surfaces of the prism for $DR >0.3$, which is followed by trailing-edge separation. This leads to the shear-layer roll-up and the formation of trailing-edge vortices, identified as ‘ $V_1$’ and ‘ $V_2$’ in figure 10(d–f) on the prism top and side wakes, respectively. These trailing-edge vortices entrain free-stream fluid into the wake, thus leading to intense downwash flow behind the prism. This is well aligned with the previously reported observations of Zargar et al. (Reference Zargar, Tarokh and Hemmati2021b) on the steady wake of long rectangular wall-mounted prisms.
Another important feature of the flow is the formation of a multi-part horseshoe structure at the base of the prism leading edge. For  $DR<0.3$, the legs of the outer horseshoe are shed into the wake by forming hairpin-like structures. These structures are clearly identified in figure 11. The formation of these hairpin-like structures has been previously reported in the literature, and may be associated with vortical motions of the horseshoe vortex legs. Hwang & Yang (Reference Hwang and Yang2004) and Diaz-Daniel et al. (Reference Diaz-Daniel, Laizet and Vassilicos2017) reported the shedding of a horseshoe vortex in the wake of a wall-mounted cube at $Re = 600$. They suggested that the flow region around the horseshoe vortex is fundamentally similar to a quasi-streamwise vortex from the near-wall region of a turbulent wall-bounded flow. Hence, the hairpin structures were reasonably expected in this region, similar to those discussed by Adrian (Reference Adrian2007). What is unique in the current study, however, is observing of an asymmetric pattern for horseshoe–hairpins in figure 11(a) (for $DR=0.016$), while they are placed symmetrically around the prism for $DR = 0.1$. The horseshoe–hairpins for the former prism ( $DR=0.016$) are stretched as they progress downstream, similar to the primary hairpin-like vortices. Structures on either side of the prism appear distorted following the initial shedding close to $x/d = 3$. This coincides with their lower convective speed, which in turn leads to a small phase difference at $x/d = 9$. In the case of $DR = 0.1$, however, no such phase difference exists, and the hairpins are symmetrically placed around the prism. The investigation of phase difference in the unsteady case is completed in the later part of the paper.

Figure 11. Instantaneous vortex structures identified using  $Q^* = 6\times 10^{-6}$ for (a) $DR = 0.016$ and (b) $DR = 0.1$, at a Reynolds number of $250$. Panels are presented from top view.
Expanding these studies to higher Reynolds numbers, i.e. the results in figure 6, revealed that the threshold depth ratio, at which wake symmetry is restored, increases with increasing Reynolds number. This constitutes the effect of Reynolds number on wake transition mechanisms, which falls outside the scope of the current study. Nonetheless, we provide a brief report on the transition mechanisms investigated in past literature. The fundamental mechanism of wake transitions, that is the suppression of unsteadiness and restoration of wake symmetry, is a multivariate function. Wake transitions depend on flow parameters, such as the Reynolds number, boundary-layer thickness and changing geometric parameters, e.g. aspect ratio and depth ratio. Past literature has focused on wake transition mechanisms in the case of suspended cubes (Saha Reference Saha2004; Khan et al. Reference Khan, Khan, Sharma and Agrawal2020a; Meng et al. Reference Meng, An, Cheng and Kimiaei2021) as well as wall-mounted prisms (Saha Reference Saha2013; Diaz-Daniel et al. Reference Diaz-Daniel, Laizet and Vassilicos2017; Rastan et al. Reference Rastan, Sohankar and Alam2017; Zhang et al. Reference Zhang, Cheng, An and Zhao2017). For the case of a suspended cube, Hopf bifurcation (Saha Reference Saha2004; Khan et al. Reference Khan, Khan, Sharma and Agrawal2020a) results in transition to unsteady flow, mainly at Reynolds numbers of 250–300. In the case of wall-mounted prisms, transition is mainly investigated in terms of changing aspect ratio (Saha Reference Saha2013) and Reynolds numbers (Diaz-Daniel et al. Reference Diaz-Daniel, Laizet and Vassilicos2017; Rastan et al. Reference Rastan, Sohankar and Alam2017; Zhang et al. Reference Zhang, Cheng, An and Zhao2017). Saha (Reference Saha2013) attributed the transition to unsteady flow with increasing aspect ratio, to alternate shedding of side-edge shear layers forming Kármán-type mid-span vortices. Saha (Reference Saha2013) observed transition to unsteady flow at an aspect ratio of  $3$ and Reynolds number of $250$. Then, Zhang et al. (Reference Zhang, Cheng, An and Zhao2017) and Rastan et al. (Reference Rastan, Sohankar and Alam2017) observed transition in mean wake topology with changing Reynolds number. Zhang et al. (Reference Zhang, Cheng, An and Zhao2017) notably observed a six-vortex-type cross-sectional wake topology, considered to be a transitional structure between quadrupole and dipole-type wakes, at a Reynolds number of $250$. Finally, Diaz-Daniel et al. (Reference Diaz-Daniel, Laizet and Vassilicos2017) attributed the transition to an unsteady wake to destabilization of the leading-edge shear layers. In the context of the present study, we observe suppression of unsteadiness with increasing depth ratio, leading to restoration of flow symmetry and a steady wake. Further, the threshold for transition changes with Reynolds number, as observed in figure 6. Thus the transition mechanism here becomes a multivariate function of changing depth ratio and Reynolds number, which will be further discussed as part of a future study.
3.3. Time-averaged wake characteristics
While the analysis of time-averaged flow effects and the influence of changing depth ratio and Reynolds number remain outside of the scope of the present study, the characterization of time-averaged flow features becomes important to understand the flow dynamics around wall-mounted prisms. Thus, here, we briefly characterize the time-averaged (mean) wake features with changing depth ratios.
Time-averaged vortex structures identified using the  $Q$-criterion and overlaid with time-averaged axial vorticity ( $\overline {\omega _x}^*$) are presented in figure 12, for prisms with changing depth ratios at a Reynolds number of $250$. A panel showing iso-surfaces of streamwise axial vorticity is added on the top-right corner of each plot. Figure 12 shows that the time-averaged wake is symmetric for all cases, including $DR=0.016$, in which the instantaneous unsteady wake feature asymmetric hairpin-like structures. Further, the time-averaged vortex structures for $DR<0.3$ show a quadrupole-type cross-sectional wake topology, composed of counter-rotating pairs of primary tip and base vortices, emanating from the tip and base of the prism, respectively. In the literature, Zhang et al. (Reference Zhang, Cheng, An and Zhao2017) and Zargar et al. (Reference Zargar, Tarokh and Hemmati2021b) observed similar quadrupole structures at a Reynolds number of $250$. Increasing the prism depth ratio beyond $0.3$ leads to impairment of the tip vortex due to reattachment of the leading-edge separated flow into the top and side surfaces of the prism (Rastan et al. Reference Rastan, Shahbazi, Sohankar, Alam and Zhou2021).

Figure 12. Time-averaged vortex structures identified using  $Q^* = 1\times 10^{-6}$, coloured with $\overline {\omega _x}^*$ for (a) $DR = 0.016$; (b) $DR = 0.1$; (c) $DR = 0.3$; (d) $DR = 1$; (e) $DR = 2$; and ( f) $DR = 4$. The iso-surface for $\overline {{\omega _x}^*}$ is shown for each case on the top-right corner.
The iso-surfaces of vorticity, shown on the top-right corner for each plot in figure 12, provides insight into the formation of tip vortices and their dependence on depth ratio. Two vortices forming over the top surface of the prism are primary and secondary tip vortices. Primary tip vortices form on the top part of the side surfaces, while secondary tip vortices form on the top surface of the prism (Rastan et al. Reference Rastan, Shahbazi, Sohankar, Alam and Zhou2021). For all cases, secondary tip vortices vanish immediately behind the prism. In the case of  $DR>0.3$, secondary tip vortices vanish due to shear-layer reattachment on the top surface of the prism, while primary tip vortices swerve down the side surfaces.
Finally, in order to understand the evolution of time-averaged structures in the near and far wake downstream of the prism, figure 13 presents profiles of time-averaged axial vorticity ( $\overline {\omega _x}^*$) at $x/d = 2,5$ and $10$. Profiles for $DR>1$ are omitted for brevity, since their mean flow characteristics do not change compared with $DR=1$ (Fang & Tachie Reference Fang and Tachie2019; Zargar et al. Reference Zargar, Tarokh and Hemmati2021b). At $x/d = 2$, the profiles of $\overline {\omega _x}^*$ are similar for $DR\leq 0.3$, showing the pairs of primary and secondary tip vortices, and base vortex pairs. The horseshoe structure wrapping around the prism and extending into the wake is also apparent. The signs of vorticity for primary tip vortices are opposite to those of secondary tip vortices. The latter structures diminish beyond $x/d = 2$ and they are no longer identifiable at $x/d = 5$. Thus, secondary tip vortices only appear in the near wake, while primary tip vortices and base vortices retain their coherence farther downstream the wake. The strength of the tip and base vortices reduces with increasing depth ratio farther downstream. Thus, it becomes clear that tip and base vortices remain dominant in the very near wake ( $x/d=2$), while they are not as dominant farther downstream at $x/d = 5\unicode{x2013}10$. Further, the strength of the tip vortex in the far downstream ( $x/d=10$) weakens with increasing depth ratio up to $DR = 1$, where the tip vortex is fully distorted and the base vortex dominates the wake.

Figure 13. Contours of time-averaged axial vorticity ( $\overline {\omega _x}^*$) structures (solid blue lines: positive values, dashed red lines: negative values) for (a–c) $DR = 0.016$; (d–f) $DR = 0.1$; (g–i) $DR = 0.3$; and (j–l) $DR = 1$. The line contour cutoff levels for $\overline {\omega _x}^*$ are ${\pm }3$ and the contour interval is $0.06$. The contours are shown at $x/d = 2, 5$ and $10$.
$10$.
3.4. Upwash and downwash motion
From the past literature (Sumner, Heseltine & Dansereau Reference Sumner, Heseltine and Dansereau2004; Wang et al. Reference Wang, Zhou, Chan and Lam2006; Wang & Zhou Reference Wang and Zhou2009; Hosseini et al. Reference Hosseini, Bourgeois and Martinuzzi2013), it is well known that the free-end vortex pair or tip vortices induce downwash flow, whereas the wall–body junction vortex pair or base vortices induce an upwash flow. Sumner et al. (Reference Sumner, Heseltine and Dansereau2004) and Hosseini et al. (Reference Hosseini, Bourgeois and Martinuzzi2013) further elucidate that the free-end downwash dominates the wake for a dipole-type mean wake topology. In case of a quadrupole-type wake, the strong upwash due to the base vortex interacts with the downwash from the tip vortex, forming a saddle point in the symmetry plane (Wang & Zhou Reference Wang and Zhou2009). For a thicker boundary layer, Wang et al. (Reference Wang, Zhou, Chan and Lam2006) observed that the upwash flow is stronger, resulting in the saddle point located closer to the free end of the prism. In the present study, it becomes important to analyse the influence of varying depth ratio on the upwash and downwash flows. To this effect, figure 14 shows the contours of  $\overline {\omega _z}^*$ overlapped with the time-averaged streamlines for all cases, shown at the symmetry plane. The intensity of upwash or downwash flow is clearly evident by their effect on the leading-edge shear-layer separation at prism free end. Figure 14 shows the location of the saddle point for all cases, which clearly indicates that the location of the saddle point lowers towards the wall–body junction with increasing depth ratio. This hints at the increasing strength of free-end downwash flow with larger depth ratios (Zargar et al. Reference Zargar, Tarokh and Hemmati2021b).

Figure 14. The  $\overline {\omega _z}^*$ contours overlapped with the time-averaged streamlines for (a) $DR = 0.016$; (b) $DR = 0.1$; (c) $DR = 0.3$; (d) $DR = 1$; (e) $DR = 2$; and ( f) $DR = 4$. Plots are shown at $y/d = 0$.
Upwash and downwash flows have profound effects on the mean shear-layer separation and elongation in the downstream wake, which in turn affect the flow periodicity (Wang et al. Reference Wang, Zhou, Chan and Lam2006; Wang & Zhou Reference Wang and Zhou2009). Zdravkovich (Reference Zdravkovich2003) reported on the influence of downwash flow on the elongation of a separating shear layer and widening of the near wake. This study suggested that, with increasing strength of the downwash flow, the near wake widened and the shear layer elongated, resulting in prolonged spanwise vortex shedding. Wang & Zhou (Reference Wang and Zhou2009) observed similar results for the case of increasing aspect ratio for a finite square prism. Since the vortex shedding mechanism directly depends on the elongation of the shear layer and spanwise momentum transport (Zdravkovich Reference Zdravkovich2003), we quantitatively analyse the transport and recovery of mean shear layers, under the influence of upwash and downwash flows, in figure 15. Previous studies (Smits, Ding & Van Buren Reference Smits, Ding and Van Buren2019; Goswami & Hemmati Reference Goswami and Hemmati2020, Reference Goswami and Hemmati2021a) have used a similar method to investigate the recovery of a separated shear layer downstream of a sudden contraction–expansion system. Figure 15 shows the location of maximum Reynolds shear stress, that is  $Y_M(-\overline {u^\prime v^\prime })$ and $Z_M(\overline {|u^\prime w^\prime |})$, in the wake. As the Reynolds stress reflects the stirring and mean momentum transport by the fluctuating velocity component, downstream spreads of $-\overline {u^\prime v^\prime }$ and $\overline {u^\prime w^\prime }$ are associated with the formation of spanwise vortices and their convection downstream (More et al. Reference More, Dutta, Chauhan and Gandhi2015). The value and trend of $\overline {u^\prime w^\prime }$ is also a measure of fluctuating streamwise momentum transport in the lateral direction or a degree of correlation between streamwise and cross-stream fluctuating velocities. Since $\overline {u^\prime w^\prime }$ is positive and negative in regions above and below the centreline, respectively, we opted to use the location of maximum $\overline {|u^\prime w^\prime |}$ to characterize the wake.

Figure 15. Location of the maximum Reynolds shear stress,  $Y_M(-\overline {u^\prime v^\prime })$, and $Z_M(\overline {|u^\prime w^\prime |})$, normalized by the prism width ( $d$), downstream of the wall mounted prism, at the (a) $z/d = 0$ and (b) $y/d = 0.5$ plane.
Transport of  $-\overline {u^\prime v^\prime }$ in figure 15(a) sheds light on the influence of depth ratio on the strength of upwash ( $v^\prime >0$) and downwash ( $v^\prime <0$) flow. For all cases, initially the stresses remain close to the height of the prism. Small depth-ratio cases ( $DR= 0.016$ and $0.1$) show a prolonged region of $v^\prime >0$ behind the prism, which entrains high-momentum fluid from the free steam into the wake, resulting in a strong upwash flow. Thus, transport of $-\overline {u^\prime v^\prime }$ away from the ground, in the region of upwash flow ( $4 < x/d < 10$), is clearly observed for the case of $DR\leq 0.3$. With increasing depth ratio, a small region of upwash flow exists immediately behind the prism, while the downstream wake is mainly dominated by downwash flow. Thus, $-\overline {u^\prime v^\prime }$ initially remains close to the prism height for the case of $DR>0.3$, but it quickly recovers towards the ground farther downstream in the wake. The profiles of $\overline {u^\prime w^\prime }$, in figure 15(b), correspond to the roll-up of the shear layer from the side faces of the prism. The near wake appears widened for $DR\leq 0.3$, under the influence of strong upwash flow. Its recovery towards the core region is prolonged until $x/d\approx 5$. With increasing depth ratio, the location of maximum shear stress is lowered towards the wake core within a short distance from the rear face of the prism, which hints at a narrowing of the wake width. Thus, increasing the depth ratio weakens the interaction between downwash flow and spanwise separating shear layers, which in turn coincides with a growing strength of the upwash flow in the far wake. The analysis that follows focuses on evaluating the impact of upwash and downwash flows on periodicity in unsteady wakes.
3.5. Flow periodicity and spanwise coherence
Figure 16 presents the power spectral density ( $E_u$) of streamwise velocity for two prisms with $DR = 0.016$ and $0.1$. Welch's averaged modified periodogram method (Welch Reference Welch1967) was utilized to calculate the power spectrum, where velocity data (time history) were split into 8 segment with $50\,\%$ overlap with a Hamming window was applied on each segment. The dominant frequency for $DR = 0.016$ corresponds to $St_{sh} = 0.1875$, while it reduces to $St_{sh} = 0.15$ with increasing depth ratio to $0.1$. Visual inspection of the wake over time reveals that these dominant shedding frequencies are associated with hairpin-like structures formed by the separated shear layer at the prism leading edge. The dominant frequency noted here is higher compared with large aspect ratio ( $AR=2\unicode{x2013}7$) prisms (Wang et al. Reference Wang, Zhou, Chan and Lam2006; Wang & Zhou Reference Wang and Zhou2009; Saha Reference Saha2013; Rastan et al. Reference Rastan, Sohankar and Alam2017), in which case the range of $St$ is $0.11\unicode{x2013}0.13$ at $Re=40\unicode{x2013}9.6\times 10^3$. There are, however, limited studies in the literature that look at the influence of depth ratio on vortex shedding. The recent study of Rastan et al. (Reference Rastan, Shahbazi, Sohankar, Alam and Zhou2021) reported that increasing the depth ratio from 1 to 3 lowered $St_{sh}$. The Strouhal number noted in their work was $0.049\sim 0.138$ for $DR = 1\unicode{x2013}4$ cases at $Re = 1.2\times 10^4$ and an aspect ratio of $7$, which was lower compared with the value obtained here. The reduced shedding frequencies in those studies, compared with the present case, were attributed to elongation of the vortex formation under the influence of intense downwash flow.

Figure 16. The power spectral density function,  $E_u$, of the streamwise streamwise velocity ( $u$) at $x/d = 2.5$, $y/d = 0.5$ and $z/d = 0.5$, for (a) $DR = 0.016$ and (b) $DR = 0.1$ prisms at a Reynolds number of $250$.
Hairpin-like vortex formation is a key wake feature in the case of isolated bluff bodies such as finite aspect-ratio flat-plate isolated cubes and prisms. In the case of the finite aspect-ratio flat plate, Hemmati et al. (Reference Hemmati, Wood and Martinuzzi2016) established that shedding occurs as a result of shear-layer peel-off of side-edge vortices from the shorter side due to secondary flow induced by detachment of the main vortex roller from the longer side of the plate. The dominant shedding structures in this case resemble hairpin-like vortices. They observed a shedding frequency of  $St_{sh}=0.317$ for a flat plate of aspect ratio $3.2$, which is significantly higher compared with the present study. The increased shedding frequency in the case of Hemmati et al. (Reference Hemmati, Wood and Martinuzzi2016) is attributed to the isolated nature of the flat plate, where shear layers peel off from either end of the flat plate. Mainly, the added shear layers contributed to the dynamics that increases the shedding frequency. Further, Hemmati, Wood & Martinuzzi (Reference Hemmati, Wood and Martinuzzi2017) expanded on their previous study of normal thin flat plates by examining the implications of aspect ratios using cases of $AR=1.6$ and $1.0$. The vortex shedding frequency reduces for these cases significantly, such that $St_{sh} = 0.146$ for $AR = 1$ and $St_{sh} = 0.186$ for $AR = 1.6$. In the case of $AR=1$, a second spectral harmonic peak is observed at $2St$, which they attributed to the secondary vortex shedding process observed with square plates. In the present study, the effects of the horseshoe and hairpin-like vortices can be isolated by changing the ground boundary to a symmetry boundary. In that case, the shedding frequency of the thin prism ( $DR=0.016$) is comparable to the results of Hemmati et al. (Reference Hemmati, Wood and Martinuzzi2017). This hints at a negligible influence of the interaction between the horseshoe vortex and hairpin-like vortex in wall-mounted flat plates and prisms.
In the case of an isolated cube, Saha (Reference Saha2004) established that the flow remains planar–symmetric and steady up to a Reynolds number of  $265$. Then, the wake transitions to unsteady flow by undergoing Hopf bifurcation. The unsteady flow loses planar symmetry, and the wake is characterized by shedding of hairpin-like vortices in the wake. Further, Khan et al. (Reference Khan, Khan, Sharma and Agrawal2020a,Reference Khan, Sharma and Agrawalb) and Meng et al. (Reference Meng, An, Cheng and Kimiaei2021) scrutinize the mechanism of shedding and various wake regimes for isolated cubes. They note a reduction of the shedding frequency to $\approx 0.09$ at a Reynolds number of $270$ and ${\sim }0.13$ at $Re=400$, relative to suspended thin flat plates. The wake topology differs in the present study, where the flow is steady at similar setting, due to the reattachment of the leading-edge shear layer on the top and side surfaces of the prism, which is consistent with observations of Zargar et al. (Reference Zargar, Tarokh and Hemmati2021b).
Lowering of the shedding frequency with increasing depth ratio continues beyond  $DR=0.3$, at which point the wake becomes steady. Although this trend depends on $Re$, such that the threshold $DR$ for transition to a steady wake changes at higher $Re$, we retain our focus on analysing the wake periodicity at $Re=250$ to establish the mechanisms leading to such trends. The reduction in $St_{sh}$ for the case of $DR = 0.1$ can be attributed to increasing dominance of the downwash flow, evident in the results of figure 15. This follows from arguments of Zdravkovich (Reference Zdravkovich2003), who explained that the vortex shedding mechanism is directly dependent on elongation of the shear layer and spanwise momentum transport under the influence of upwash–downwash flow. The shear-layer elongation that was previously discussed for the case of larger $DR$ values aligns well with the lowering trend of the shedding frequency observed here and corroborated by the description of Zdravkovich (Reference Zdravkovich2003).
The spectral analysis revealed an additional flow dynamics in the wake. There are three dominant wake features identified in figure 16 that can also be associated with wake structures, by inspection: (i)  $St_{sh}$ that is associated with shedding of hairpin-like structures; (ii) low-frequency signature at $St_{sh}/2$ for the case of $DR =0.016$, which is associated with a sub-harmonic of the hairpin-like vortex shedding; (iii) high-frequency harmonic peaks centred at $2St_{sh},3St_{sh}$ and $4St_{sh}$ for the case of $DR=0.016$, and at $2St_{sh}$ for the case of $DR=0.1$. Diaz-Daniel et al. (Reference Diaz-Daniel, Laizet and Vassilicos2017) and Tiwari et al. (Reference Tiwari, Bale, Patwardhan, Nandakumar and Joshi2019) have noted similar sub-harmonic and harmonic peaks in the wake of prisms, mainly in the near-wake region, associated with interactions of detaching shear layers from the prism surfaces. Figures 16 and 17 provide the direct evidence of these flow features. Autocorrelation of the streamwise velocity is shown in figure 17 for $DR = 0.016$ and $0.1$, where the lag (horizontal axis) is normalized by the vortex shedding frequency, $f_{sh}$. Autocorrelation of a signal is defined as,
 \begin{equation} \rho_\tau = \frac{\langle u_{t} u_{t+\tau^*} \rangle}{\langle u_t^2 \rangle}, \end{equation}
where the streamwise velocity signal ( $u_t$) is correlated with itself ( $u_{t+\tau ^*}$) after a time delay corresponding to one vortex shedding period ( $\tau ^*$). Autocorrelation analysis is carried out using the final 5 shedding cycles along the height of the prism at three locations. For the case of $DR = 0.016$, the signature of the vortex shedding process is intensified close to the prism free end, where a periodic signature is apparent corresponding to $St_{sh}/2$. At the mid-span and wall–body junction, the periodic signature corresponds to $St_{sh}$. In the case of $DR = 0.1$, no such distinction is observed since the periodic signatures correspond to $St_{sh}$ along the prism height.

Figure 17. The normalized autocorrelation function,  $\rho _\tau$, of the streamwise velocity at $x/d = 2.5$ and $y/d = 0.05, 0.5$ and $0.95$, for (a,c,e) $DR = 0.016$ and (b,d, f) $DR = 0.1$. Note that $\tau ^* = \tau f_{sh}$ is the number of vortex shedding periods, where $f_{sh}$ is the vortex shedding frequency corresponding to $St_{sh}$.
The low-frequency ( $St_{sh}/2$) activity noted for $DR =0.016$ is attributed to the region where tip vortices are present ( $y/d\approx 0.95$), which is consistent with observations of Diaz-Daniel et al. (Reference Diaz-Daniel, Laizet and Vassilicos2017). This suggests that tip-vortex shedding occurs at a different frequency compared with the hairpin-like structures. Further investigation into the phase lag between the shedding tip vortices on two sides may account for the asymmetry. Previously, Kindree et al. (Reference Kindree, Shahroodi and Martinuzzi2018) and Morton et al. (Reference Morton, Martinuzzi, Kindree, Shahroodi and Saeedi2018) reported low-frequency behaviour for wall-mounted circular prisms with $AR= 4$ immersed in a thin laminar boundary layer. They proceeded to argue, based on further analysis, that low-frequency signatures are unique to circular cross-section prisms with $AR \leq 4$ that are placed in thin laminar boundary layers, and that this process is independent of $Re$. Here, we observe a similar behaviour for small $AR$ rectangular (sharp edge) prisms with sufficiently small $DR$ that result in asymmetric features. At $Re=250$, this unique wake asymmetry is only apparent for the case of $DR=0.016$, while wake symmetry is restored quickly at $DR =0.1$. Similar wake behaviour was observed for larger $DR$ values at higher Reynolds numbers, as was previously classified in figure 6. We have observed and discussed evidence earlier on, both quantitative and qualitative, that hints at the dynamics of side-edge shear-layer detachment dictating this wake asymmetric behaviour. We aim to provide further support for this hypothesis by identifying the potential phase difference between shear-layer detachment on side edges.
To better understand the near-wake dynamics associated with tip-vortex low-frequency signatures, for example for the case of  $DR = 0.016$, we used spectral coherence ( $Coh_{u_1 u_2}$) between velocity signals along the domain span in figure 18. Spectral coherence provides the degree of coherence between Fourier components of two streamwise velocity (time history) signals, say $u_1$ and $u_2$, such that $u_1$ is recorded at $y/d = 0.008$ and $u_2$ at $y/d = 0.05, 0.5$ and $0.95$ (Wang & Zhou Reference Wang and Zhou2009). Spectral coherence is defined as,
 \begin{equation} Coh_{u_1 u_2} = \frac{Co_{u_1 u_2}^2 + Q_{u_1 u_2}^2}{E_{u_1}E_{u_2}}, \end{equation}
where  $Co_{u_1 u_2}$ and $Q_{u_1 u_2}$ are the cospectrum and quadrature spectrum functions of $u_1$ and $u_2$, and $E_{u_1}$, $E_{u_2}$ are the power spectral density functions of $u_1$ and $u_2$. The signal for $u_1$ is measured close to the ground for reference, following the recommendation of Wang & Zhou (Reference Wang and Zhou2009). The results in figure 18 for $Coh_{u_1 u_2}$ show a dominant peak at $St_{sh} = 0.1875$ along the prism span, as well as at $St_{sh}/2$ close to the prism free end. The peak value of $Coh_{u_1 u_2}$ for $St_{sh}$ ranges from ${\sim }0.3$ at $y/d = 0.05$ to $0.5$ to ${\sim }0.1$ at $y/d = 0.95$. This is while $Coh_{u_1 u_2}$ for $St_{sh}/2$ becomes ${\sim }0.9$ at $y/d = 0.95$. The spanwise coherence at $St_{sh} = 0.1875$ suggests a strong correlation along the prism height, which corroborates with hairpin-like structures shedding in the wake. A strong coherence corresponding to $St_{sh}/2$ is absent along the prism height near its free end. This suggests that the low-frequency signature originates from the prism free end. Thus, low-frequency signatures observed in the wake are associated with tip-vortex shedding.

Figure 18. Spectral coherence,  $Coh_{u_1 u_2}$, between streamwise velocity $u_1$ and $u_2$ for $DR = 0.016$, at $x/d = 2.5$ and $z/d = 0.5$. Here, $u_1$ was measured at $y/d = 0.008$, and $u_2$ was measured at $y/d = 0.05, 0.5$ and $0.95$.
Coherent vortex shedding observed in the wake of two-dimensional prisms, typically suggesting symmetric vortex shedding, corresponds to no phase lag (phase angle of zero) between laterally arranged vortices (Zhou et al. Reference Zhou, Zhang and Yiu2002). In asymmetric vortex shedding, however, there is a phase lag between structures shed from different edges of the prism. The apparent phase difference in the mid-height of the prism, comparing streamwise velocity signals along the prism span, hints at a potential phase difference between structures positioned on either edge of the prism. This accounts for the wake asymmetry observed in the shedding and convective orientation of hairpin-like structures. To verify the existence of a phase difference between tip vortices on two sides of the prism, we look at instantaneous streamwise velocity variations on opposite spanwise edges of the prism in figure 19. The results are based on two instantaneous streamwise velocity signals,  $u_1$ and $u_2$, measured at opposite spanwise locations with respect to the prism middle line, that is $(2.5,0.95,+0.4)$ and $(2.5,0.95,-0.4)$. These spatial positions correspond to the location of the low-frequency signature observed earlier for the case of $DR =0.016$, i.e. the location of tip vortices. It becomes clear from figure 19 that the two signals, $u_1$ and $u_2$, experience a phase shift of ${\rm \pi}$. At a given instant of time, the signal of $u_1$ leads $u_2$ by half a period, which corresponds to the low frequency observed at $St_{sh}/2$. Thus, the tip vortices from either side of the prism shed alternately with a low frequency and opposite phase. This provides us with more evidence on the mechanism of wake asymmetry associated with low depth-ratio prisms.

Figure 19. The variation of instantaneous streamwise velocity components,  $u_1$ and $u_2$, at locations $(2.5,0.95,\pm 0.4)$ as shown in the schematic plot, for $DR = 0.016$ prism. Here, $t^*$ is the convective time, given as $t^* = tU_b/d$.
We next focus on analysing the implications of alternate tip-vortex shedding for the hairpin-like structures in the wake. Interactions between the tip vortex and separating side-edge shear layers could result in the formation of secondary vortex structures, and thus contribute to shear-layer premature separation, or ‘peel-off’ following the terminology of Hemmati et al. (Reference Hemmati, Wood and Martinuzzi2016). Further, the streamwise coherence of these secondary vortex structures is associated with the pattern of shedding of hairpin-like vortices. Hence, there is an inherent mechanism that leads to formation and shedding of hairpin-like structures in an asymmetric pattern in the wake of wall-mounted low depth-ratio prisms.
3.6. Mechanism of asymmetric shedding
Hwang & Yang (Reference Hwang and Yang2004) and Yakhot et al. (Reference Yakhot, Liu and Nikitin2006) have previously characterized the flow around a wall-mounted cube. These studies reported a dominant hairpin-like shedding in the wake, resulting from the adverse pressure gradients formed by the abrupt boundary-layer separation on the surfaces of the body. Further, Diaz-Daniel et al. (Reference Diaz-Daniel, Laizet and Vassilicos2017) showed that such hairpin-like structures appear symmetric at low Reynolds numbers, due to the shear-layer reattachment–separation on the prism surfaces. With increasing Reynolds number, hairpin structures lose their symmetry moving downstream, which is the onset of their break down and incoherence. Moreover, Diaz-Daniel et al. (Reference Diaz-Daniel, Laizet and Vassilicos2017) observed a low-frequency signature corresponding to tip vortices, which were absent in the case of symmetric hairpin-like shedding. They hinted at potential interactions between tip vortices and the hairpin head, leading to the aforementioned dynamic wake features and vortex distortion.
A similar approach can be utilized for the current study, compared with those of Diaz-Daniel et al. (Reference Diaz-Daniel, Laizet and Vassilicos2017), to characterize the mechanism of wake asymmetry. We have thus far established that, for the case of  $DR= 0.016$, which exhibits asymmetric wake structures, tip vortices are shed at a lower frequency and they exhibit an inherent lateral phase difference. This directly relates to the orientation and coherence of hairpin-like structures that are formed by detachment of shear layers from the top and side edges of the prism. Figure 20 shows the instantaneous vortex structures using $Q^*$ overlaid with contours of streamwise vorticity ( $\overline {\omega _x}^*$) for $DR = 0.016$. At $x/d = 0$, both contour-line and iso-surface plots hint at the presence of symmetry in the wake, where primary and secondary tip vortices are clearly visible and are positioned symmetrically. More details on these structures have already been discussed extensively. Farther downstream, near-wake structures start showing signs of distortion, hinting at symmetry breaking, at $x/d = 1$. It has been already discussed how secondary tip vortices appear fully distorted at $x/d = 1$, while primary tip vortices dominate the wake (Rastan et al. Reference Rastan, Shahbazi, Sohankar, Alam and Zhou2021). Onwards from $x/d = 1.5$, primary tip vortices start interacting with the separating shear layer from the top and side surfaces of the prism. At $x/d = 2$ and $2.5$, there are several secondary streamwise vortex structures identified in the wake. The sign of vorticity (direction of rotation) for secondary vortex structures is opposite to that of the corresponding shear layer (see $x/d = 2$). The influx of vorticity due to these secondary structures further facilitates their interactions with the separating shear layer from the prism top surface, which forms the head of hairpin-like structures upon its detachment from the body (Hwang & Yang Reference Hwang and Yang2004). This interaction impacts the separating hairpin-like structure on either side, causing asymmetric vortex shedding. Similar secondary vortex structures are noted downstream, the presence of which coincides with tilting of hairpin-like structure towards that respective side.

Figure 20. Instantaneous vortex structures identified using  $Q^* = 6\times 10^{-6}$ and overlaid with streamwise vorticity ( $\overline {\omega _x}^*$), surrounded by the line contours of $\overline {\omega _x}^*$ (solid blue lines: positive values, dashed red lines: negative values) for a $DR = 0.016$ prism at a Reynolds number of $250$. The line contour cutoff levels for $\overline {\omega _x}^*$ are ${\pm }0.12$ and the contour interval is $0.001$. Contours are shown at $x/d = 0\unicode{x2013}2.5$ at intervals of $0.5$.
Summarizing previous discussions, key features of the asymmetric wake behind small aspect-ratio wall-mounted prisms include (i) the formation of a multi-part horseshoe vortex in front of the prism, (ii) shedding of horseshoe legs in the wake, (iii) leading-edge shear-layer separation from the prism top and side surfaces, (iv) the formation of secondary vortex structures and (v) subsequent formation of asymmetric hairpin-like structures in the wake. These key features remain common amongst the cases studied here, and are shown in figures 20 and 24.
We proceed by investigating the interactions of tip-vortex and side-edge separating shear layers, as well as the mechanism of shear-layer peel-off. This can establish a potential cause for the formation of hairpin-like structures in the wake. Figure 21 compares the circulation ( $\varGamma$) for top and side shear layers for both asymmetric ( $DR = 0.016$) and symmetric ( $DR= 0.1$) hairpin shedding cases. The absolute values of circulation are compared, and normalized using bulk velocity ( $U_b$) and prism width ( $d$). For both depth ratios, the strength of top surface shear layer appears higher compared with that from either side. Larger circulation of the top shear layer entails a roll-up from the leading edge and a strong upwash flow that causes shear-layer peel-off. Further, the evidence of alternate shedding of the tip vortex interacting with the side shear layer is clear from figure 21. The trends of circulation computed for the right-hand side shear layer lead the ones from the left edge, by a phase of ${\rm \pi}$. This phase difference is consistent with that of tip-vortex shedding from either side of the prism. Further, comparing the circulation of the side shear layers at any time ( $t^*$), it is noticed that the shear layer on either side is stronger compared with its counterpart. As such, the side with the stronger shear layer (larger circulation) tilts the separating hairpin on the respective side. No such phase difference is observed for $DR=0.1$, where the side surface shear layers shed simultaneously from either side of the prism.

Figure 21. Circulation ( $\varGamma$), normalized by bulk velocity ( $U_b$) and prism width ( $d$), computed for top and side surface shear layers of (a) $DR = 0.016$ and (b) $DR = 0.1$ prisms at a Reynolds number of $250$. Here, $t^*$ is the arbitrary range of convective time, given as $t^* = tU_b/d$.
Analyses thus far reveal that further evaluation of the origins of secondary structures is necessary. Contour-line plots at  $x/d = 2$ in figure 20 suggests that the influx of vorticity (from secondary vortex structure) is consistent with the vorticity of the primary tip vortex. To analyse this further at this location, the temporal evolution of $\overline {\omega _x}^*$ is evaluated in figure 22 within one shedding cycle. These plots clearly depict the formation of the head section of the hairpin-like structure. Initially, a secondary vortex structure is identified at $t_1$ in figure 22(a), which tilts the separating shear layer towards its respective side, in this case the $+z$ direction. Primary tip vortices are also identified at $t_3$ and $t_4$ in figure 22(c,d). Structures with a negative-sign vorticity (dashed red lines at $t_4$ in figure 22d) interact with the shear layers detaching from the top and side surfaces of the prism with an opposite vorticity sign (solid blue lines at $t_4$ in figure 22d). This leads to an influx of opposite vorticity in the separating shear layer, the interjection of which with the shear layer induces an inward velocity, with respect to the prism. This feature distorts the hairpin-like structure and breaks the wake symmetry.

Figure 22. Time marching, line contours of  $\overline {\omega _x}^*$ (solid blue lines: positive values, dashed red lines: negative values) plotted at $x/d = 2$ for $DR = 0.016$ at Reynolds number of $250$. The line contour cutoff levels for $\overline {\omega _x}^*$ are ${\pm }0.12$ and the contour interval is $0.001$. Contours are shown at (a) $t_1 = t_o$; (b) $t_2 \approx t_o + \tfrac {1}{5}\tau ^*$; (c) $t_3 \approx t_o + \tfrac {2}{5}\tau ^*$; (d) $t_4 \approx t_o + \tfrac {3}{5}\tau ^*$; (e) $t_5 \approx t_o + \tfrac {4}{5}\tau ^*$; and ( f) $t_6 \approx t_o + \tau ^*$. Here, $\tau ^*$ is the time scale based on $\tau ^* = d/(U_b St)$.
Based on their location and the vorticity sign of secondary vortex structures in figure 22(a, f), we argue that the secondary vortex structures form as a result of alternate shedding of primary tip vortices, due to excess vorticity resulting from the shear layer during the peel-off process on either side of the prism. The trends of circulation, the area integral of vorticity associated with the vortex, in figure 21 shows the evidence of excess vorticity during shear-layer detachment from either side of very thin prism. The shear layer on either side is stronger compared with its counterpart, resulting in excess vorticity on the respective side, that may lead to such secondary vortex structures. The excess vorticity in the asymmetric wake feeds the secondary structures, which accounts for their coherence far downstream in the wake. In case of depth ratio  $0.1$, the side surface shear layers shed simultaneously, devoid of any vorticity deficit. Thus the secondary vortex structures forming in the wake lose their coherence fairly quickly downstream.
The existence of a single coherent structure in the wake, despite different frequency signatures observed in the power spectrum (see figure 16a), deserve closer attention. In elaborating on the mechanism of hairpin-like structures, Tiwari et al. (Reference Tiwari, Bale, Patwardhan, Nandakumar and Joshi2019) attributed their formation to elongation and interactions of separating shear layers from the prism top and side surfaces. The top and side surface shear layers merge to form the hairpin-like structures in the wake (Khan et al. Reference Khan, Khan, Sharma and Agrawal2020a). The leading-edge separation from the prism side surfaces induces vortical motions that form the tip vortices, which interact with the shear layer formed over the cube. This interaction leads to distortion of the hairpin-like structure in the wake, and formation of secondary structures that lose their coherence downstream. The existence of secondary structures that are connected to the coherent hairpin-like structure (see figure 20) accounts for the low-frequency signatures observed in the power spectrum.
Finally, we utilize DMD to explore different aspects of the wake dynamics and to confirm the origins of asymmetric hairpin-like vortices as a result of alternate shedding of the primary tip vortex at  $St_{sh}/2$. DMD provides a computational framework to extract a primary low-order description of a dataset through its orthonormal modes in a temporal sense (Zheng et al. Reference Zheng, Xie, Zheng, Ji and Zhu2019; Khalid et al. Reference Khalid, Wang, Akhtar, Dong and Liu2020; Taira et al. Reference Taira, Hemati, Brunton, Sun, Duraisamy, Bagheri, Dawson and Yeh2020). In other words, DMD enables identification of spatial structures with characteristic frequencies associated with these structures. In the present study, since the case of $DR=0.016$ results in sub-harmonic and harmonic peaks in the power spectrum, DMD analysis enables segregating of the induced effects of each frequency on the overall wake. Here, the cases of $DR=0.016$ and $DR=0.1$ are considered for wake characterization using DMD analysis as a generalized example with asymmetric and symmetric wakes. DMD analysis is completed using the streaming total dynamic mode decomposition (Hemati et al. Reference Hemati, Deem, Williams, Rowley and Cattafesta2016, Reference Hemati, Rowley, Deem and Cattafesta2017) method implemented in OpenFOAM. The details of the mathematical formulations and implementation of the algorithm is found in the work of Kiewat (Reference Kiewat2019).
The reconstructed vortex structures in figure 23(a,b) are identified using  $Q$-criterion iso-surfaces that are overlaid with instantaneous streamwise vorticity. Reconstruction is performed by addition of the mean mode with DMD mode 1, corresponding to $St_{sh}$, and mode 2, corresponding to $St_{sh}/2$. In the current analysis, DMD modes 1 and 2 are the dominant modes, corresponding to ${\sim }35\,\%$ and ${\sim }31\,\%$ of the frequency amplitudes. This hints at the dominant influence of $St_{sh}$ and $St_{sh}/2$ on the overall flow dynamics. From figure 23(a), showing the addition of the mean flow to mode 1, we see that the dominant modes possess structures that correlate with the shedding hairpin-like structures in the wake. These shedding hairpin-like structures are symmetric, with frequency corresponding to $St_{sh}$. Thus, it is evident from this result that the dominant frequency arises from the shedding of hairpin-like structures. Figure 23(c), presenting instantaneous streamwise vorticity structures obtained by addition of the mean with mode 1, shows the legs of hairpin-like structures forming due to antisymmetric vorticity about the centreline. In the past literature (Kindree et al. Reference Kindree, Shahroodi and Martinuzzi2018; Morton et al. Reference Morton, Martinuzzi, Kindree, Shahroodi and Saeedi2018), the general topology of symmetric vortex shedding modes are made up of a series of counter-rotating vortices located on either side of the wake streamline. This suggests that the side-edge shear layers shed simultaneously and result in symmetric hairpin-like structures shedding at the dominant Strouhal number ( $St_{sh}$).

Figure 23. (a,b) Reconstructed vortex structures identified using  $Q$-criterion and overlaid with instantaneous streamwise vorticity and (c,d) reconstructed streamwise vorticity structures. Structures are reconstructed using the addition of (a,c) mean with DMD mode 1 ( $St_{sh}$); (b,d) mean with DMD mode 1 ( $St_{sh}$) and mode 2 ( $St_{sh}/2$).
The influence of sub-harmonics ( $St_{sh}/2$) on the overall flow is examined by adding mode 2 in our DMD analysis. Figure 23(b) shows the reconstructed structures by addition of mean mode with DMD modes 1 and 2, and the respective vorticity structures are shown in figure 23(d). With the addition of mode 2, corresponding to sub-harmonic frequency, the iso-contours show asymmetry in the shed hairpin-like structures. The asymmetry arises from the influx of excess vorticity (see figure 23d) to either side. Here, the excess vorticity on either side in mode 2 (figure 23d) feeds into the antisymmetric vorticity about the centreline in mode 1 (figure 23c). Such influx induces an inward velocity, with respect the prism, distorting the head of the hairpin-like structure. Thus, the origins of asymmetry can be attributed to the influx of vorticity as a result of sub-harmonic, low-frequency instability centred at $St_{sh}/2$. This observation further complements existing literature (Diaz-Daniel et al. Reference Diaz-Daniel, Laizet and Vassilicos2017; Kindree et al. Reference Kindree, Shahroodi and Martinuzzi2018; Morton et al. Reference Morton, Martinuzzi, Kindree, Shahroodi and Saeedi2018) by attributing the influx of vorticity to the secondary vortex structures that interact and distort the hairpin-like shedding structures. The discussion thus here provides, for the first time, a detailed description of these structures, their physical mechanisms and their contributions to the wake asymmetry.
This observation is not limited to very thin prisms at low Reynolds number. Figure 24 shows an asymmetric wake and the existence of secondary vortex structures in the case of  $DR = 0.6$ at a Reynolds number of $400$ as well as $DR=1$ at $Re=500$. This is corroborated by the classification of wake topology in figure 6. This suggests that secondary structures and the subsequent asymmetry in the wake develops at sufficiently small depth ratios with increasing Reynolds number. The applications and effectiveness of DMD analysis at higher Reynolds number are evident from the study of Khalid et al. (Reference Khalid, Wang, Akhtar, Dong and Liu2020). At higher Reynolds numbers and depth ratios, the interactions of shedding vortex structures with detaching shear layers results in near-wake incoherence and multiple sub-harmonic and harmonic frequencies (Diaz-Daniel et al. Reference Diaz-Daniel, Laizet and Vassilicos2017). The investigation of such an incoherent wake using DMD analysis, although interesting, remains part of a future study. Further, a higher Reynolds number leads to stronger interaction between the secondary vortex structures and separating shear layers, resulting in a more disorganized distribution of wake structures downstream in figure 24(b). In the case of symmetric shedding (see figure 25), secondary vortex structures also appear symmetric and their shedding frequency corresponds to the shedding frequency of the main hairpin-like structure. As the flow progresses downstream, they lose their coherence and vanish completely. This explains the lack of these structures farther downstream of the wake.

Figure 24. Instantaneous vortex structures of prisms with (a)  $DR=0.6$ at $Re=400$; and (b) $DR=1$ at $Re=500$, identified using $Q^* = 6\times 10^{-6}$ and overlaid with $\overline {\omega _x}^*$. All panels are shown in three-dimensional view.

Figure 25. Instantaneous vortex structures identified using  $Q^* = 6\times 10^{-6}$ and overlaid with streamwise vorticity ( $\overline {\omega _x}^*$), surrounded by the line contours of $\overline {\omega _x}^*$ (solid blue lines: positive values, dashed red lines: negative values) for $DR = 0.1$ prism at Reynolds number of $250$. The line contour cutoff levels for $\overline {\omega _x}^*$ are ${\pm }0.12$ and the contour interval is $0.001$. Contours are shown at $x/d = 0, 1, 1.5, 2$ and $2.5$.
4. Conclusion
Flow over a wall-mounted finite prism with aspect ratio  $1$ and varying depth ratios (0.016–4) is numerically investigated at $Re=50\unicode{x2013}500$ to characterize the implications of the depth ratio for the flow dynamics. The minimum depth ratio considered here accounts for the special case of a wall-mounted very thin prism (similar to a flat plate), which is used to establish the mechanism and wake evolution associated with the free-end effects and shear-layer dynamics in small aspect-ratio prisms. These analyses and their related arguments are therefore expandable to other cases (different depth ratio and $Re$) that exhibit a similar wake classification. The wake analyses at a range of Reynolds numbers and depth ratios suggest that the threshold $Re$ at which the wake experiences unsteady transition changes with increasing depth ratio. Moreover, we established that there is a unique asymmetric wake system formed behind wall-mounted prisms with sufficiently small depth ratios resulting from alternating shear-layer peel-off on either side of the body.
The unsteady wake topology and dynamics, including symmetric and asymmetric wakes, are evaluated using the wake of the very thin prism as an example, which can be expanded to other cases with a similar wake classification. For the case of a thin prism ( $DR=0.016$) at $Re=250$, the wake was dominated by tilted hairpin-like structures that form an asymmetric wake system. This phenomenon was well suppressed, and wake symmetry restored, at a larger $DR$ of 0.1. Further analysis revealed that threshold $DR$ associated with the restoration of wake symmetry increases with Reynolds number. For example, the wake symmetry is restored by $DR=0.3$ at $Re=300$, $1$ at $Re=400$, and $2$ at $Re=500$. We identified and described a unique flow mechanism leading to this particular wake behaviour using the results at $Re=250$. The alternating vortex shedding from either side of the prism coincided closely with the tilting of hairpin-like structures, and the formation of wake asymmetry. Moreover, it was determined that this alternating process is attributed to the out-of-phase detachment of shear layers on either side of the prism at a lower Strouhal number ( $St_{sh}/2$). Moreover, it was identified that the wake features secondary streamwise structures that appear alternatively on either side of the prism in the downstream wake. The origin of the secondary vortex structures was attributed to the alternate shedding of primary tip vortices. In case of asymmetric shedding, they resulted from an influx of vorticity from the shear-layer peel-off process, which fed into these structures. Increasing the depth ratio to 0.1 led to restoration of flow symmetry through symmetric shedding of the side surface shear layer. Secondary streamwise structures were also reported here, though they shed symmetrically and lost coherence fairly quickly downstream the prism.
Funding
This research has received support from the Natural Sciences and Engineering Research Council of Canada (NSERC) and Alberta Innovates. The computational analysis was completed using Compute Canada clusters.
Declaration of interests
The authors report no conflict of interest.
Appendix. Spatial grid verification
The verification of the spatial resolution further proceeded by examining the ratio of grid size to Kolmogorov length scale ( $\varDelta /\eta$). The grid size was estimated using $\varDelta = (\Delta x\times \Delta y\times \Delta z)^{1/3}$ following the definition of Yakhot et al. (Reference Yakhot, Liu and Nikitin2006). The Kolmogorov length scale was estimated using $\eta = (\nu ^3/\varepsilon )^{1/4}$, where $\varepsilon$ was the viscous dissipation rate, given by $\varepsilon = 2\nu \overline {s_{ij}s_{ij}}$, and $s_{ij}$ was the strain-rate tensor (Pope Reference Pope2001). According to the past studies on wall-mounted prisms (Moin & Mahesh Reference Moin and Mahesh1998; Kawamura et al. Reference Kawamura, Seki, Iwamoto and Kawamura2007; Saeedi et al. Reference Saeedi, LePoudre and Wang2014; Rastan et al. Reference Rastan, Shahbazi, Sohankar, Alam and Zhou2021), the accuracy of the simulation results required the smallest resolved scales to be of the same order of magnitude as the Kolmogorov length scale. Previously, other wake studies on infinite-span bluff bodies relied on assessing the grid resolution based on $\varDelta /\eta \leq 4$, at least up to $8d$ downstream of the body (Narasimhamurthy & Andersson Reference Narasimhamurthy and Andersson2009; Hemmati et al. Reference Hemmati, Wood and Martinuzzi2018). Contours of $\varDelta /\eta$ are reported in figure 26 at $y/d = 0.5$, which is the planar location of the largest velocity gradients and vorticity in the unsteady flow. This follows the similarity of our grid distributions to Zargar et al. (Reference Zargar, Gungor, Tarokh and Hemmati2021a). The contours in figure 26 reveal that $\varDelta /\eta$ increases with $x/d$ so that the maximum ratio is $\varDelta /\eta =0.1$ at $x/d = 1$ and it only marginally increases to $\approx 0.8$ at $x/d = 5$. Further downstream, the maximum ratio remains below 1 until $x/d = 20$. In addition, the zones with $\varDelta /\eta \approx 1$ appear where the turbulence levels intensify in the wake. In other words, the energetic turbulent motions in the wake at the prism mid-span result in a larger dissipation rate and smaller Kolmogorov length scale. The numerical study of Yakhot et al. (Reference Yakhot, Liu and Nikitin2006) and Saeedi et al. (Reference Saeedi, LePoudre and Wang2014) estimated the optimum criterion of $2\leq \varDelta /\eta \leq 5$ for the critical regions of the flow using direct numerical simulations. The results here indicated that the grid followed this criterion stringently ( $\varDelta /\eta \leq 1$), thus confirming that the grid resolution is adequate for the numerical results in the present study.

Figure 26. Contours of the ratio of grid size to Kolmogorov length scale ( $\varDelta /\eta$) at $y/d = 0.5$ for the case of a wall-mounted thin prism ( $DR = 0.016$) at Reynolds number of $250$.


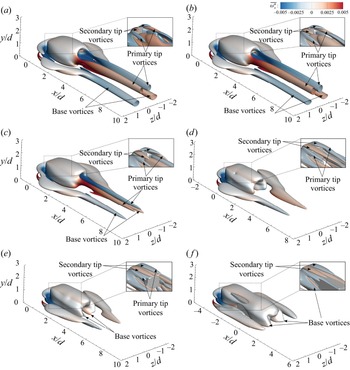


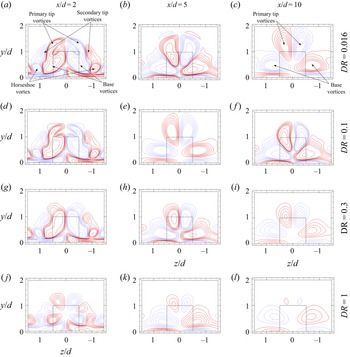


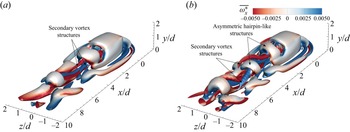


 Open access