


1. Introduction
Granular materials are abundant in the natural world, in industrial processes and in our everyday lives. Indeed, after fluids, granular materials are the most common material used by mankind in a wide range of processes in the bulk chemical, civil, pharmaceutical, mining, agricultural and food industries (Merrow Reference Merrow1984; Bates Reference Bates1997; Shinbrot & Muzzio Reference Shinbrot and Muzzio2000; Richard et al. Reference Richard, Nicodemi, Delannay, Ribiere and Bideau2005). Despite their widespread use, our ability to model their behaviour using continuum theories lags far behind that of computational fluid dynamics for liquids. This is because the rheology of granular flows is more complex, and not yet fully understood (GDR MiDi 2004; Jop, Forterre & Pouliquen Reference Jop, Forterre and Pouliquen2006), with aggregates of grains simultaneously behaving as a solid, a liquid or a gas in disparate spatially and temporally evolving regions. Physicists and engineers have therefore relied heavily on discrete element method/discrete particle model (DEM/DPM) numerical simulations to understand particle flow behaviour and optimize the design of industrial systems (Cundall & Strack Reference Cundall and Strack1979; Silbert et al. Reference Silbert, Ertaş, Grest, Halsey, Levine and Plimpton2001; Cleary & Sawley Reference Cleary and Sawley2002; GDR MiDi 2004; da Cruz et al. Reference da Cruz, Emam, Prochnow, Roux and Chevoir2005; Zhu et al. Reference Zhu, Zhou, Yang and Yu2008; Ketterhagen, Ende & Hancock Reference Ketterhagen, Ende and Hancock2009; Chialvo, Sun & Sundaresan Reference Chialvo, Sun and Sundaresan2012; Weinhart et al. Reference Weinhart, Hartkamp, Thornton and Luding2013; Vo et al. Reference Vo, Nezamabadi, Mutabaruka, Delenne and Radjai2020). However, as the number of particles increases, DEM/DPM simulations rapidly become prohibitively computationally expensive, which restricts their use to small systems, with usually less than a few million particles. There is therefore a pressing need to develop reliable and efficient continuum methods, that do not need to resolve each individual particle and particle collision.
As a prototypical example of a non-trivial granular flow, this paper focuses on the mixing and segregation of particles in a partially filled thin triangular rotating drum (Mounty Reference Mounty2007). Similar flows in elliptical and square drums were first investigated by Hill et al. (Reference Hill, Khakhar, Gilchrist, McCarthy and Ottino1999) and Ottino & Khakhar (Reference Ottino and Khakhar2000), who showed experimentally that the combination of flow and segregation produced beautiful quasi-periodic patterns. An example of the pattern formed in a triangular drum, 70 % filled with a mixture of large green, medium white and small red glass beads, is shown in figure 1. The full time-dependent evolution can be seen in supplementary movie 1 available at https://doi.org/10.1017/jfm.2023.1022. Two arms of small and medium particles rapidly form, which radiate out from the central core towards the drum corners, forming a striking pattern. Experiments in square, pentagonal and hexagonal drums (not shown) also produce a series of arms, but with progressively reduced length as the number of sides is increased. This paper therefore focuses exclusively on the triangular drum, which has the longest arms.
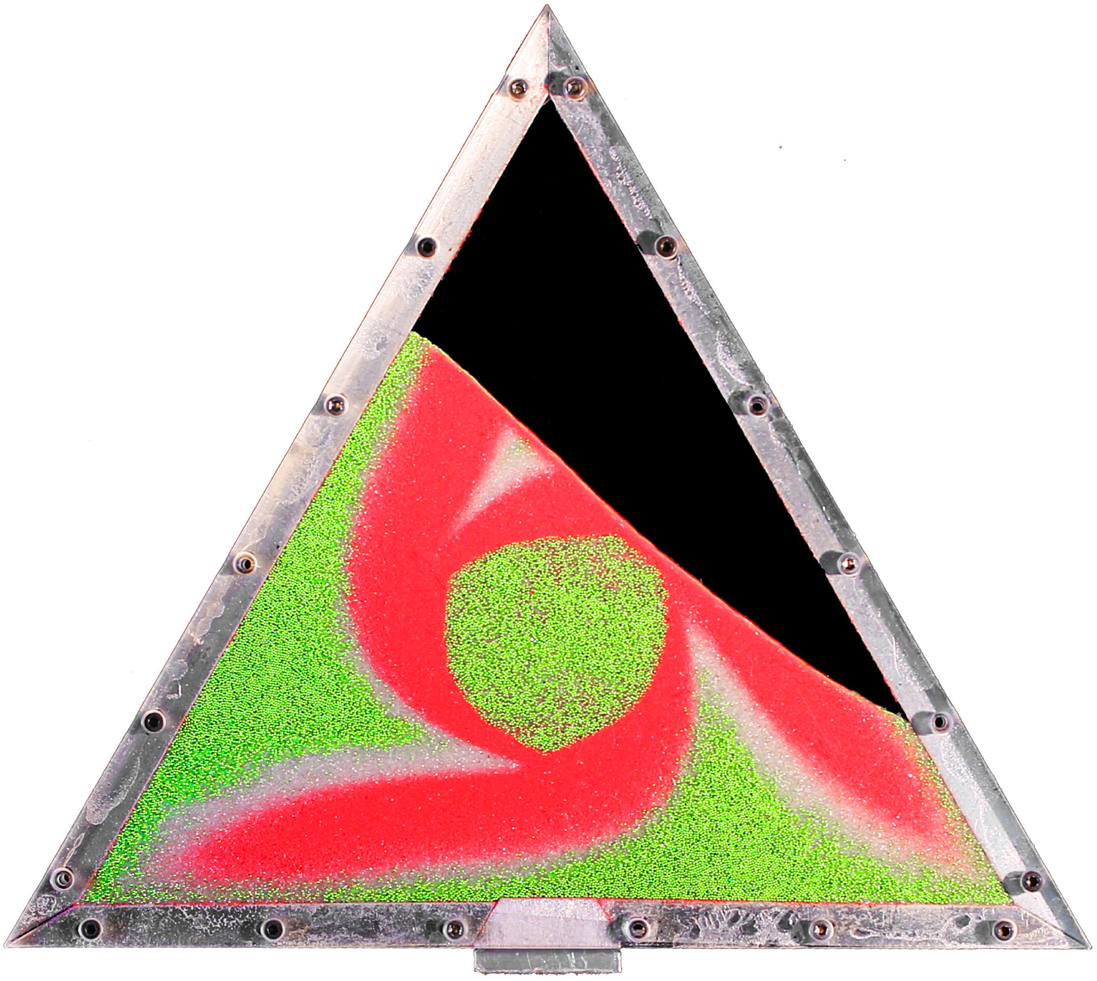
Figure 1. Image of a triangular rotating drum experiment 70 % filled with large green (600–800  $\mathrm {\mu }$m), medium white (400–500
  $\mathrm {\mu }$m) and small red (125–160
  $\mathrm {\mu }$m) glass beads in a 30:40:30 mix. The drum rotates clockwise with a rotation rate of
  $\varOmega =-{\rm \pi} /48$ rad s
 $^{-1}$. Most of the grains are in solid-body rotation but a thin avalanche develops at the free surface, within which all the segregation occurs. After just two revolutions this produces a stunning quasi-periodic pattern of small- and medium-particle rich arms radiating towards the corners of the drum that are surrounded by large grains. There is also a central undisturbed core, which just rotates with the drum. Supplementary movie 1 shows the full time-dependent evolution.
As the drum rotates, most of the grains are in solid-body rotation, but a thin avalanche forms above a critical free-surface angle and transports grains rapidly downslope. Grains in the avalanche are progressively deposited along its lower reach, and are slowly rotated (with the drum) back up to where they re-enter the avalanche along its upper reach. The flow is akin to that formed in the rolling regime of a circular rotating drum, where a steady-state avalanche can form (Henein, Brimacombe & Watkinson Reference Henein, Brimacombe and Watkinson1983; Rajchenbach Reference Rajchenbach1990; Metcalfe et al. Reference Metcalfe, Shinbrot, McCarthy and Ottino1995; Gray & Hutter Reference Gray and Hutter1997; Gray Reference Gray2001). However, unlike a circular drum, the geometrical shape occupied by the grains constantly changes as the triangular drum rotates, which precludes the formation of a steady state. As a result, the free-surface position as well as the maximum avalanche depth and length are functions of time. Hill et al. (Reference Hill, Khakhar, Gilchrist, McCarthy and Ottino1999) and Ottino & Khakhar (Reference Ottino and Khakhar2000) showed that for monodisperse particles rotating in elliptical and square drums, the resulting flow field leads to chaotic advection of tracer particles. A similar result holds for triangular drums (Mounty Reference Mounty2007). Moreover, if the drum is more than half full, then a central core of grains can form that are never entrained into the avalanche and essentially just rotate with the drum (although there is some very slow creep, Socie et al. Reference Socie, Umbanhowar, Lueptow, Jain and Ottino2005). This corresponds to the central green region in figure 1.
Particle-size segregation adds an important ordering mechanism on top of these deceptively simple chaotic flows. Particles in the slightly dilated rapidly shearing thin surface avalanche are able to segregate by size, with the largest grains being pushed towards the surface by force imbalances and the small grains percolating down to the base under the action of gravity (Gray & Ancey Reference Gray and Ancey2011; Gray Reference Gray2018; Trewhela, Ancey & Gray Reference Trewhela, Ancey and Gray2021). This leads to the development of an inversely graded particle-size distribution, with the largest grains concentrated at the surface and the smallest ones at the base. In the lower reach of the avalanche, particles are continuously and progressively deposited into the underlying solid rotating body. Since the smallest particles are at the base of the avalanche, they are deposited first, closer to the centre of the drum, while the largest particles at the surface of the avalanches are deposited last, closest to the drum wall.
In a circular rotating drum the particle-size segregation leads to the development of a radial particle-size distribution with the smallest particles concentrated in a ring around the central core and the largest grains in another ring adjacent to the drum wall (Gray & Hutter Reference Gray and Hutter1997; Gray & Ancey Reference Gray and Ancey2011). In the triangular rotating drum the particle-size distribution is considerably more complicated, but broadly speaking the largest grains are still concentrated next to the drum wall and the smallest ones are closest to the central core. However, the combination of particle-size segregation and the complex underlying bulk flow allows a pattern to develop, with the small and medium sized particles forming arms that are surrounded by large particles. The arms start from a position adjacent to the central core, and radiate out with a clockwise rotation to point towards the corners of the drum. This pattern forms after only two drum revolutions and is quasi-periodic, never truly settling down, but repeating in a closely similar way.
Partially filled non-circular rotating drums provide a simple example of complex granular flow with spatially and temporally evolving solid-like and liquid-like regions. Accurately modelling such flows with continuum theories is still a challenge. Barker et al. (Reference Barker, Rauter, Maguire, Johnson and Gray2021) developed a fully coupled theory capable of modelling both the bulk flow and the particle-size segregation. The theory is based on the incompressible  $\mu (I)$ rheology for granular flows, in which the friction
  $\mu$ is a function of the non-dimensional inertial number
  $I$ (GDR MiDi 2004; Jop et al. Reference Jop, Forterre and Pouliquen2006). Rather than using the classical
  $\mu (I)$ curve, Barker et al. (Reference Barker, Rauter, Maguire, Johnson and Gray2021) use a modified functional form that introduces a creep state at low inertial numbers and asymptotes to a linear dependence at high inertial numbers (Barker & Gray Reference Barker and Gray2017). This partially regularized form of the theory ensures that it is mathematically well-posed over a much wider range of inertial numbers than the original theory (Barker et al. Reference Barker, Schaeffer, Bohorquez and Gray2015).
The inertial number  $I=\dot \gamma d/(p/\rho _*)^{1/2}$, where
  $\dot \gamma$ is the shear rate,
  $d$ is the particle diameter,
  $p$ is the pressure and
  $\rho _*$ is the intrinsic density of the grains. The fact that the rheology is locally particle-size dependent, is profound. It implies that, in general, the local flow behaviour is dependent on the evolving particle-size distribution. Modelling particle-size segregation patterns in rotating drums is therefore not necessarily just a matter of developing a theory for a monodisperse bulk flow (or parameterizing the velocity and pressure fields using the results of DEM/DPM simulations), and then solving for the particle-size segregation. In general, it is necessary to consider the feedback that the particle-size distribution has on the bulk flow dynamics. In some flows the feedback can have a significant effect, such as in segregation-induced fingering instabilities, bulbous flow fronts, stratification patterns and petal formation in cylindrical drums (Williams Reference Williams1968; Gray & Hutter Reference Gray and Hutter1997; Makse et al. Reference Makse, Havlin, King and Stanley1997; Pouliquen, Delour & Savage Reference Pouliquen, Delour and Savage1997; Pouliquen & Vallance Reference Pouliquen and Vallance1999; Zuriguel et al. Reference Zuriguel, Gray, Peixinho and Mullin2006; Gray & Ancey Reference Gray and Ancey2009; Woodhouse et al. Reference Woodhouse, Thornton, Johnson, Kokelaar and Gray2012; Baker, Johnson & Gray Reference Baker, Johnson and Gray2016b; Denissen et al. Reference Denissen, Weinhart, Te Voortwis, Luding, Gray and Thornton2019; Barker et al. Reference Barker, Rauter, Maguire, Johnson and Gray2021). In other flows, the feedback can be more subtle, and prescribed fields may be sufficient to capture the main features of the segregation as well as the bulk dynamics (e.g. Wiederseiner et al. Reference Wiederseiner, Andreini, Epely-Chauvin, Moser, Monnereau, Gray and Ancey2011; Schlick et al. Reference Schlick, Fan, Umbanhowar, Ottino and Lueptow2015; Deng et al. Reference Deng, Fan, Theuerkauf, Jacob, Umbanhowar and Lueptow2020). The problem is that there is no way of knowing a priori whether the feedback in a particular flow will be significant or not.
In order to take account of segregation-induced feedback on the bulk flow, this paper adopts the fully coupled framework developed by Barker et al. (Reference Barker, Rauter, Maguire, Johnson and Gray2021). Barker et al. (Reference Barker, Rauter, Maguire, Johnson and Gray2021) showed that this theory was able to capture the qualitative features of the segregation patterns observed in the thin square rotating drum experiments of Hill et al. (Reference Hill, Khakhar, Gilchrist, McCarthy and Ottino1999), but it over predicted the avalanche depth and under predicted its speed. The transparent front and back sidewalls (which allow observation of the patterns) impose a significant frictional force on the flow (Taberlet et al. Reference Taberlet, Richard, Valance, Losert, Pasini, Jenkins and Delannay2003; Jop, Forterre & Pouliquen Reference Jop, Forterre and Pouliquen2005). In particular, Jop et al. (Reference Jop, Forterre and Pouliquen2005) showed that sidewalls generate granular flows that are thinner and faster than those in wider channels. In order to make quantitative comparisons between the theory and experiments it is therefore necessary to include these sidewall friction effects into the general theory. This paper therefore makes careful quantitative comparisons between a fully coupled theory, which includes sidewall friction, and experiments in a thin triangular rotating drum.
The paper is structured as follows: In § 2 the governing equations are introduced and generalized to account for sidewall friction, and § 3 summarizes the numerical method. This is used in § 4 to compare simulations with experiments performed in a 70 % filled triangular rotating drum with a 50:50 bidisperse mixture of large and small particles. The effect of the sidewalls is quantified in § 5 by comparing these results with equivalent simulations performed in the absence of sidewall friction. Sections 6 and 7 study the effect of changing the fill level and mixture composition, and § 8 compares tridisperse simulations to experiments.
2. Governing equations
2.1. The partially regularized  $\mu (I)$ rheology

Consider a body of granular material containing particles of differing sizes, shapes and frictional properties, but with a constant intrinsic grain density  $\rho _*$. The solids volume fraction
  $\varPhi$ is also assumed to be constant, so that the bulk density
  $\rho = \varPhi \rho _*$ is constant. Mass balance then implies that the bulk flow field
  $\boldsymbol {u}$ is incompressible,
 \begin{equation} \boldsymbol{\nabla} \boldsymbol{\cdot} \boldsymbol{u} = 0, \end{equation}
where  $\boldsymbol {\nabla }$ is the gradient operator and
  $\boldsymbol {\cdot }$ is the dot product. Although shear and gravity-driven segregation relies on the formation of void spaces inside a flowing mixture, the bulk solids volume fraction in granular avalanches has been shown to remain approximately constant, and incompressibility is therefore a reasonable assumption (Tripathi & Khakhar Reference Tripathi and Khakhar2011). The momentum balance is
 \begin{equation} \rho\left(\frac{\partial\boldsymbol{u}}{\partial t} + \boldsymbol{u{\cdot}\nabla u}\right) ={-}\boldsymbol{\nabla} p + \boldsymbol{\nabla}\boldsymbol{\cdot}(2\eta\boldsymbol{D}) + \rho\boldsymbol{g}, \end{equation}
where  $p$ is the pressure,
  $\boldsymbol{D}=\boldsymbol{\nabla u}+\boldsymbol{\nabla u}^T$ is the strain rate and
  $\boldsymbol {g}$ is the constant gravitational acceleration vector. The
  $\mu (I)$ rheology (GDR MiDi 2004; Jop et al. Reference Jop, Forterre and Pouliquen2006) relates the deviatoric stress to the strain-rate tensor
  $\boldsymbol {D}$ through a granular viscosity
 \begin{equation} \eta = \frac{\mu(I) p}{2\|\boldsymbol{D}\|}, \end{equation}
where the second invariant of the strain-rate tensor is
 \begin{equation} \|\boldsymbol{D}\| = \sqrt{\frac{1}{2} \mathrm{tr}(\boldsymbol{D}^2)}. \end{equation}
In terms of this second invariant, the inertial number becomes
 \begin{equation} I = \frac{2 d \|\boldsymbol{D}\|}{\sqrt{p/\rho_*}}, \end{equation}
where  $d$ is the grain diameter. The
  $\mu (I)$ rheology is an empirical law that was formulated using dimensional analysis alongside evidence from DEM/DPM simulations and experiments across a range of steady-state monodisperse flow geometries (GDR MiDi 2004). Jop et al. (Reference Jop, Forterre and Pouliquen2005) derived the classical functional form
 \begin{equation} \mu(I) = \frac{\mu_{s} I_{0}+\mu_{d} I}{I_{0}+I},\end{equation}
from the basal friction measurements of Pouliquen & Forterre (Reference Pouliquen and Forterre2002). This starts at the static friction  $\mu _s$ at
  $I=0$ and asymptotes to the dynamic friction
  $\mu _d$ for large inertial numbers. The range of inertial numbers over which this transition occurs is controlled by the parameter
  $I_0$. Barker et al. (Reference Barker, Schaeffer, Bohorquez and Gray2015) found that this formulation was well-posed for inertial numbers in the range
  $[I_1^N,I_2^N]$ provided that the difference
  $\mu _d-\mu _s$ was sufficiently large. The lower and upper neutral stability limits
  $I_1^N$ and
  $I_2^N$ are found by substituting (2.6) into equation (3.9) of Barker & Gray (Reference Barker and Gray2017) and determining the values of
  $I$ for which the condition
  $C=0$. When the inertial number is too low (
 $I< I_1^N$) or too high (
 $I>I_2^N$), the system leads to unbounded growth of small perturbations (ill-posedness) in the high wavenumber limit. This leads to grid-dependent results in numerical simulations (Barker et al. Reference Barker, Schaeffer, Bohorquez and Gray2015; Barker & Gray Reference Barker and Gray2017; Martin et al. Reference Martin, Ionescu, Mangeney, Bouchut and Farin2017), and indicates that important physics is missing in the model.
The issue of ill-posed behaviour can be resolved by the inclusion of higher gradients (Goddard & Lee Reference Goddard and Lee2017), non-locality (Kamrin & Koval Reference Kamrin and Koval2012; Kamrin Reference Kamrin2019) or compressibility (Barker et al. Reference Barker, Schaeffer, Shearer and Gray2017; Heyman et al. Reference Heyman, Delannay, Tabuteau and Valance2017; Schaeffer et al. Reference Schaeffer, Barker, Tsuji, Gremaud, Shearer and Gray2019), but these all add further complexity to the equations. A simple, but practical, approach that retains the structure of the incompressible Navier–Stokes equations (2.1)–(2.2), is to modify the shape of the  $\mu (I)$ curve to increase the theory's range of well-posedness. In the small inertial number limit, Barker & Gray (Reference Barker and Gray2017) solved for the boundary between well- and ill-posed regions in parameter space to motivate the alternative
  $\mu (I)$ function,
 \begin{equation} \mu(I) = \begin{cases} \displaystyle \sqrt{\frac{\alpha}{\log\left(\dfrac{A}{I}\right)}} & \text{for } I \leq I_1^N, \\ \displaystyle \frac{\mu_{s} I_{0}+\mu_{d} I+\mu_{\infty} I^2}{I_{0}+I} & \text{for } I > I_1^N, \end{cases} \end{equation}
where  $\alpha \lesssim 2$ ensures that the lower branch is well-posed for
  $I\in [0,I_1^N]$,
  $\mu _{\infty }$ is a new material constant and the constant
 \begin{equation} A=I_1^N\exp\left(\frac{\alpha(I_0+I_1^N)^2}{(\mu_s I_0 + \mu_d I_1^N + \mu_{\infty}(I_1^N)^2)^2}\right) \end{equation}
ensures that the function (2.7) is continuous at  $I=I_1^N$. The function (2.7) implies that the friction
  $\mu =0$ at
  $I=0$. The partially regularized theory therefore does not have a static yield stress, but instead creeps for inertial numbers
  $I \leq I_1^N$. This makes little practical difference to numerical simulations, which already necessitate high viscosity regularization (see § 3).
Since  $I_1^N\ll 1$, it follows that the upper branch of (2.7) closely approximates the original function (2.6) for
  $I_1^N< I\ll 1$. At large inertial numbers the upper branch asymptotes to
  $\mu =\mu _d+\mu _\infty I$, instead of tending to the constant value
  $\mu _d$. This is consistent with the high speed chute flow experiments of Holyoake & McElwaine (Reference Holyoake and McElwaine2012) and Barker & Gray (Reference Barker and Gray2017), which showed there was a linear dependence on
  $I$ at large inertial numbers. Such experiments therefore provide a means of determining the new material constant
  $\mu _\infty$. Barker et al. (Reference Barker, Rauter, Maguire, Johnson and Gray2021) showed that the creep state at small inertial numbers and the linear dependence of
  $\mu$ on
  $I$ at large inertial numbers significantly extends the range of well-posedness from
  $I=0$ to
  $I^N_2\simeq 17$. It is for this reason that the theory is known as the partially regularized
  $\mu (I)$ rheology, as it does not guarantee well-posedness, but instead makes the well-posed range much larger than that of the original theory (Jop et al. Reference Jop, Forterre and Pouliquen2006), where
  $I^N_2\simeq 0.28$ (Barker & Gray Reference Barker and Gray2017).
2.2. Generalized polydisperse segregation theory
The granular material is assumed to consist of  $n$ discrete particle species
  $\nu$ that have differing particle diameters
  $d^\nu$, but the same intrinsic grain density
  $\rho _*$. Each species has a volume fraction per unit granular volume
  $\phi ^{\nu } \in [0,1]$, which satisfies the summation constraint
 \begin{equation} \sum_{\forall\nu} \phi^{\nu}=1. \end{equation}
All of the existing bidisperse and polydisperse theories for particle-size segregation (e.g. Bridgwater, Foo & Stephens Reference Bridgwater, Foo and Stephens1985; Savage & Lun Reference Savage and Lun1988; Dolgunin & Ukolov Reference Dolgunin and Ukolov1995; Gray & Thornton Reference Gray and Thornton2005; Gray & Chugunov Reference Gray and Chugunov2006; Fan & Hill Reference Fan and Hill2011; Gray & Ancey Reference Gray and Ancey2011; Schlick et al. Reference Schlick, Fan, Umbanhowar, Ottino and Lueptow2015; Gray Reference Gray2018; Barker et al. Reference Barker, Rauter, Maguire, Johnson and Gray2021) can be recast in the form of a general segregation–advection–diffusion equation for each species  $\nu$,
 \begin{equation} \frac{\partial\phi^{\nu}}{\partial t} + \boldsymbol{\nabla}\boldsymbol{\cdot}(\phi^{\nu}\boldsymbol{u}) + \boldsymbol{\nabla}\boldsymbol{\cdot}\boldsymbol{F}^{\nu} = \boldsymbol{\nabla}\boldsymbol{\cdot}\boldsymbol{\mathcal{D}}^{\nu}, \end{equation}
where  $\boldsymbol {F^{\nu }}$ and
  $\boldsymbol {\mathcal {D}^{\nu }}$ are the segregation and diffusive flux vectors for species
  $\nu$, respectively. By summing (2.10) over each species and applying the summation constraint (2.9), the incompressibility condition (2.1) is satisfied provided
 \begin{equation} \sum_{\forall\nu} \boldsymbol{F}^{\nu}=\boldsymbol{0} \quad \text{and} \quad \sum_{\forall\nu} \boldsymbol{\mathcal{D}}^{\nu}=\boldsymbol{0}. \end{equation}
For a bidisperse mixture, the segregation flux function should satisfy the constraint that no segregation occurs when the volume fraction of either species is zero (Bridgwater et al. Reference Bridgwater, Foo and Stephens1985). The simplest form therefore has a linear dependence on the species volume fractions, as proposed for a bidisperse mixture by Gray & Thornton (Reference Gray and Thornton2005). This was later generalized for a polydisperse mixture (Gray & Ancey Reference Gray and Ancey2011; Barker et al. Reference Barker, Rauter, Maguire, Johnson and Gray2021) by a summation of the segregation flux functions over each bidisperse sub-mixture, to give
 \begin{equation} \boldsymbol{F}^{\nu} = \sum_{\forall\lambda{\ne}\nu}f_{\nu\lambda}\phi^{\nu}\phi^{\lambda}\boldsymbol{e}_{\nu \lambda}, \end{equation}
where  $f_{\nu \lambda }$ is the segregation velocity magnitude and
  $\boldsymbol {e}_{\nu \lambda }$ is the unit vector along the segregation direction. This satisfies the summation constraint (2.11) provided
 \begin{equation} f_{\nu\lambda}=f_{\lambda\nu}, \quad \boldsymbol{e}_{\nu\lambda}={-}\boldsymbol{e}_{\lambda\nu}. \end{equation}
In Barker et al. (Reference Barker, Rauter, Maguire, Johnson and Gray2021) the diffusive flux vector is defined by analogy with the Maxwell–Stefan equations (Maxwell Reference Maxwell1867)
 \begin{equation} \boldsymbol{\mathcal{D}}^{\nu} = \sum_{\forall\lambda{\ne}\nu}\mathcal{D}_{\nu\lambda}(\phi^{\lambda}\boldsymbol{\nabla}\phi^{\nu} - \phi^{\nu}\boldsymbol{\nabla}\phi^{\lambda}), \end{equation}
so that, in general, the diffusion rate  $\mathcal {D}_{\nu \lambda }$ may vary between sub-mixtures, while still satisfying (2.11), provided
  $\mathcal {D}_{\nu \lambda }=\mathcal {D}_{\lambda \nu }$. When the diffusion rate is the same across all sub-mixtures, (2.14) reduces to the standard equation for Fickian diffusion.
2.3. Segregation induced feedback on the bulk flow
The inertial number (2.5) is particle-size dependent. Hence, even if the particles have identical microscopic frictional properties, the local friction  $\mu$ and, hence, the bulk flow behaviour will depend on the local particle size (GDR MiDi 2004). Particle-size segregation can therefore feedback on the local flow dynamics. By defining a volume fraction weighted mean particle size
 \begin{equation} \bar d=\sum_{\forall \nu} \phi^\nu d^\nu, \end{equation}
it is possible to generalize the inertial number definition (2.5) to polydisperse mixtures
 \begin{equation} I = \frac{2\bar d \|\boldsymbol{D}\|}{\sqrt{p/\rho_*}}. \end{equation}
This is sufficient to capture simple frictional feedback from the evolving particle-size distribution of otherwise identical particles (Rognon et al. Reference Rognon, Roux, Naaïm and Chevoir2007; Tripathi & Khakhar Reference Tripathi and Khakhar2011; Denissen et al. Reference Denissen, Weinhart, Te Voortwis, Luding, Gray and Thornton2019; Barker et al. Reference Barker, Rauter, Maguire, Johnson and Gray2021). This implies that, for the same flow depth, small particles will flow faster than large grains, so long as non-local wall effects do not come into play (Pouliquen & Forterre Reference Pouliquen and Forterre2002; Kamrin & Koval Reference Kamrin and Koval2014; Edwards & Gray Reference Edwards and Gray2015; Edwards et al. Reference Edwards, Russell, Johnson and Gray2019; Rocha, Johnson & Gray Reference Rocha, Johnson and Gray2019).
There are more complex effects in which the frictional properties of the particles differ due to their shape and/or microscopic surface properties. For each pure phase  $\nu$, this can often be accounted for by modifying the parameters
  $\mu _{s}^\nu$,
  $\mu _{d}^\nu$,
  $\mu _{\infty }^\nu$ and
  $I_0^\nu$ in the friction law (2.7). The local effective friction of the mixture can then be defined as the volume fraction weighted average of the constituent frictions,
 \begin{equation} \bar\mu(I)=\sum_{\forall \nu} \phi^\nu \mu^\nu(I). \end{equation}
This leads naturally to a new definition for the granular viscosity (2.3), which replaces  $\eta$ in the bulk momentum balance (2.2)
 \begin{equation} \bar\eta = \frac{\bar\mu(I) p}{2\|\boldsymbol{D}\|}. \end{equation}
The combination of (2.16) and (2.17) allows the frictional differences caused by variations in particle size and surface properties to feedback on the bulk motion. This is crucial for segregation-induced flow fingering, which frequently occurs in geophysical mass flows, and is responsible for longer run out (Pouliquen et al. Reference Pouliquen, Delour and Savage1997; Pouliquen & Vallance Reference Pouliquen and Vallance1999; Iverson & Vallance Reference Iverson and Vallance2001; Iverson Reference Iverson2003; Johnson et al. Reference Johnson, Kokelaar, Iverson, Logan, LaHusen and Gray2012; Woodhouse et al. Reference Woodhouse, Thornton, Johnson, Kokelaar and Gray2012; Kokelaar et al. Reference Kokelaar, Graham, Gray and Vallance2014; Baker et al. Reference Baker, Johnson and Gray2016b; Edwards et al. Reference Edwards, Rocha, Kokelaar, Johnson and Gray2023).
2.4. The feedback of the bulk flow on particle-size segregation and diffusion
Each particle species  $\nu$ is transported by the bulk velocity field
  $\boldsymbol {u}$ in the segregation– advection–diffusion equation (2.10). The particle-size distribution is therefore directly affected by the local velocity
  $\boldsymbol {u}$. The local shear rate
  $\dot \gamma =2||\boldsymbol {D}||$ and the pressure
  $p$ also affect the segregation and diffusion through the functional dependence of the segregation velocity magnitude
  $f_{\nu \lambda }$ and diffusion rate
  $\mathcal {D}_{\nu \lambda }$ between each species
  $\nu$ and
  $\lambda$ pair.
Barker et al. (Reference Barker, Rauter, Maguire, Johnson and Gray2021) surveyed the existing literature for specific functional forms. In particular, dimensional analysis demands that the diffusion rate scales with the shear rate times the particle-size squared, times an arbitrary function of the inertial number. This scaling was implied by the analysis of Scott & Bridgwater (Reference Scott and Bridgwater1975) on the relationship between particle percolation velocity and diffusion, and has been extensively confirmed by experimental observations (Bridgwater Reference Bridgwater1980; Natarajan, Hunt & Taylor Reference Natarajan, Hunt and Taylor1995; Utter & Behringer Reference Utter and Behringer2004; Katsuragi, Abate & Durian Reference Katsuragi, Abate and Durian2010) and numerical simulations (Tripathi & Khakhar Reference Tripathi and Khakhar2013; Fan et al. Reference Fan, Schlick, Umbanhowar, Ottino and Lueptow2014; Cai et al. Reference Cai, Xiao, Zheng and Zhao2019). The simplest model for the diffusion rate between each species  $\nu$ and
  $\lambda$ is therefore
 \begin{equation} \mathcal{D}_{\nu\lambda}= 2\mathcal{A}\|\boldsymbol{D}\| \bar d^2, \end{equation}
where  $\mathcal {A}$ is a universal constant specified in table 1. Note that the diffusion is therefore assumed to be the same for each species pair, and hence, the diffusive flux (2.14) reduces to standard Fickian diffusion. Campbell (Reference Campbell1997) found that diffusion in granular shear flows was anisotropic, and Utter & Behringer (Reference Utter and Behringer2004) studied monodisperse Couette flow experiments using flat disc-shaped particles, from which they measured a radial diffusion coefficient of
  $\mathcal {A}=0.108$ and a tangential diffusion coefficient of
  $\mathcal {A}=0.223$. Evidence from bidisperse DEM/DPM shear-cell simulations with spherical particles implies that the anisotropy is only slight, and that instead
  $\mathcal {A}\in (0.03,0.05)$ (Tripathi & Khakhar Reference Tripathi and Khakhar2013; Cai et al. Reference Cai, Xiao, Zheng and Zhao2019; Artoni et al. Reference Artoni, Larcher, Jenkins and Richard2021; Bancroft & Johnson Reference Bancroft and Johnson2021). Therefore isotropic diffusion can be reasonably assumed, and
  $\mathcal {A}=0.04$ is used here.
Table 1. Parameter values used in the numerical simulations. The value of the universal constant  $\mathcal {A}$ in the diffusivity (2.19) is based on the DEM/DPM simulations of (Tripathi & Khakhar Reference Tripathi and Khakhar2013; Cai et al. Reference Cai, Xiao, Zheng and Zhao2019; Artoni et al. Reference Artoni, Larcher, Jenkins and Richard2021; Bancroft & Johnson Reference Bancroft and Johnson2021). The values of the universal constants
  $\mathcal {B}$ and
  $\mathcal {C}$ in the segregation law (2.20) are based on those suggested by the single-intruder experiments of Trewhela et al. (Reference Trewhela, Ancey and Gray2021), although
  $\mathcal {B}$ is corrected for the absence of an interstitial fluid. The remaining non-dimensional constants
  $\mathcal {E}$,
  $a$ and
  $\phi ^s_c$ are also taken from Trewhela et al. (Reference Trewhela, Ancey and Gray2021).
Trewhela et al. (Reference Trewhela, Ancey and Gray2021) performed single-intruder shear-box experiments to derive a scaling law for segregation of large and small particles in a bidisperse mixture. This law is now generalized to polydisperse systems. For a sub-mixture composed of particles  $\nu$ and
  $\lambda$, the segregation velocity magnitude is
 \begin{equation} f_{\nu\lambda}=\left(\frac{2\mathcal{B} \rho_* g \|\boldsymbol{D}\| \bar d^2 }{\mathcal{C}\rho_* g \bar d + p}\right) \mathcal{F}_{\nu\lambda}(\phi^\nu,\phi^\lambda,R_{\nu\lambda}), \end{equation}
where  $\mathcal {B}$ and
  $\mathcal {C}$ are universal constants determined by Trewhela et al. (Reference Trewhela, Ancey and Gray2021) (given in table 1). The function
  $\mathcal {F}_{\nu \lambda }$ accounts for packing effects and the segregation-rate dependence on the generalized grain-size ratio
 \begin{equation} R_{\nu\lambda}=\hbox{max}\left(\frac{d^\nu}{d^\lambda},\frac{d^\lambda}{d^\nu}\right), \end{equation}
where  $R_{\nu \lambda }=R_{\lambda \nu }>1$. The scaling law (2.20) is able to capture a variety of phenomena observed in slightly dilated, bidisperse, sheared granular flows, where kinetic sieving and squeeze expulsion are the dominant segregation mechanisms (Middleton Reference Middleton1970; Bridgwater et al. Reference Bridgwater, Foo and Stephens1985; Savage & Lun Reference Savage and Lun1988; Gray Reference Gray2018).
Kinetic sieving is a shear driven process that allows smaller particles to percolate down under the action of gravity, while squeeze expulsion describes the process in which particles are squeezed upwards to maintain bulk incompressibility. Dimensional analysis suggests that the segregation rate should have the dimensions of a velocity, and (2.20) assumes that  $f_{\nu \lambda }$ behaves like
  $\dot \gamma \bar d=2||\boldsymbol {D}||\bar d$, which automatically implies that the segregation flux function
  $f_{\nu \lambda }\phi ^\nu \phi ^\lambda$ is asymmetric (Gajjar & Gray Reference Gajjar and Gray2014; van der Vaart et al. Reference van der Vaart, Gajjar, Epely-Chauvin, Andreini, Gray and Ancey2015). By performing experiments with a density matched interstitial fluid, Vallance & Savage (Reference Vallance and Savage2000) showed that segregation shuts off in the absence of gravity (see also Thornton, Gray & Hogg Reference Thornton, Gray and Hogg2006). The effect of gravity is included indirectly in the round bracketed term in (2.20) through a dependence on the reciprocal of the non-dimensionalized pressure
  $p/(\rho _* g\bar d)$. If the shear rate is constant, this form implies that the deeper one goes into the mixture, the lower the segregation rate becomes. This was observed directly in Trewhela et al. (Reference Trewhela, Ancey and Gray2021) experiments, i.e. the intruders did not rise linearly with time in response to a spatially uniform shear rate, but were either percolated down or squeezed up faster near the free surface. The constant
  $\mathcal {C}$ in (2.20) was included to avoid a singularity at zero pressure. Further evidence of the pressure dependence of segregation is provided in the papers of Golick & Daniels (Reference Golick and Daniels2009), Fry et al. (Reference Fry, Umbanhowar, Ottino and Lueptow2018) and Bancroft & Johnson (Reference Bancroft and Johnson2021).
Trewhela et al. (Reference Trewhela, Ancey and Gray2021) found that for moderate grain-size ratios of large and small particles (i.e. for  $R_{sl}\in [1,4.17]$, where
  $s$ and
  $l$ denote small and large particles, respectively), the segregation rate of large intruders had a linear dependence on
  $(R_{sl}-1)$. However, the segregation rate of a small intruder obeyed a quadratic law of the form
  $(R_{sl}-1)+\mathcal {E}(R_{sl}-1)^2$, where
  $\mathcal {E}$ was a non-dimensional constant. The additional quadratic dependence arose because small intruders find it increasingly easy to percolate through a matrix of large grains as the particle-size ratio approaches the spontaneous percolation limit at around
  $R_{sl}\simeq 6$. Trewhela et al. (Reference Trewhela, Ancey and Gray2021) extended their model to intermediate concentrations by assuming that
 \begin{equation} \mathcal{F}_{sl}=(R_{sl}-1)+\mathcal{E}\varLambda(\phi^s)(R_{sl}-1)^2, \end{equation}
where the function
 \begin{equation} \varLambda(\phi^s)=\begin{cases} \displaystyle 1-\frac{\phi^s}{\phi^s_c} & \text{for } \phi^s \leq \phi^s_c, \\ \displaystyle 0 & \text{for } \phi^s > \phi^s_c, \end{cases} \end{equation}
gives the right  $\mathcal {F}_{sl}$ dependence in the limit as
  $\phi ^s\rightarrow 0,1$ and shuts off the quadratic dependence when the small-particle concentration exceeds
  $\phi ^s_c$ (defined in table 1). Trewhela et al. (Reference Trewhela, Ancey and Gray2021) showed that this functional form was capable of quantitatively capturing the spatial and temporal evolution of the particle-size distribution measured in the refractive-index-matched shear-box experiments of van der Vaart et al. (Reference van der Vaart, Gajjar, Epely-Chauvin, Andreini, Gray and Ancey2015).
However, there is evidence from experiments and DEM/DPM simulations suggesting that for 50:50 mixtures of large and small particles in geometries for which the velocity and shear rate are functions of space and time, the segregation intensity is maximal near a grain-size ratio of  $R_{sl}=2$ (Golick & Daniels Reference Golick and Daniels2009; Thornton et al. Reference Thornton, Weinhart, Luding and Bokhove2012), whereas the formulation (2.22) is monotonically increasing with the size ratio. Trewhela et al. (Reference Trewhela, Ancey and Gray2021) therefore suggested an alternative size-ratio dependency that captures this effect, within the framework of the incompressible segregation theory
 \begin{equation} \mathcal{F}_{sl}=\frac{(R_{sl}-1)+\mathcal{E}\varLambda(\phi^s)(R_{sl}-1)^2}{1 + a(R_{sl}-1)^2\phi^s\phi^l}, \end{equation}
where  $a$ is a constant defined in table 1. The numerator in (2.24) is the same as (2.22), but the denominator now includes a reduction factor
  $1 + a(R_{sl}-1)^2\phi ^s\phi ^l$, which shuts off when
  $\phi ^s=0$ and
  $\phi ^l=0$, and reduces the segregation rate at intermediate configurations. The idea is that this factor parameterizes the enhanced packing of mixtures of particles of different sizes, which is thought to reduce the segregation rate. Trewhela et al. (Reference Trewhela, Ancey and Gray2021) showed that for a 50:50 mix, (2.24) predicts a peak segregation rate at
  $R_{sl}\simeq 1.66$, which is very close to the maximum at
  $R_{sl}=1.7$ observed in the DEM/DPM simulations of Thornton et al. (Reference Thornton, Weinhart, Luding and Bokhove2012). The bidisperse simulations in §§ 4–7 of this paper are performed using the functional form (2.24). Almost nothing is known about how the segregation rate and the packing behaves in polydisperse sheared granular mixtures. The tridisperse simulations presented in § 8 therefore use a trivial pairwise generalization of (2.24) as an illustration.
2.5. Sidewall friction
It has long been known that confining lateral sidewalls play an important role in granular flow experiments (Greve & Hutter Reference Greve and Hutter1993; Taberlet et al. Reference Taberlet, Richard, Valance, Losert, Pasini, Jenkins and Delannay2003; Jop et al. Reference Jop, Forterre and Pouliquen2005; Baker, Barker & Gray Reference Baker, Barker and Gray2016a). In rotating drum flows the additional friction introduced by sidewalls results in avalanches that are significantly thinner and faster than flows without sidewall friction (Hill et al. Reference Hill, Khakhar, Gilchrist, McCarthy and Ottino1999; Ottino & Khakhar Reference Ottino and Khakhar2000; Jop et al. Reference Jop, Forterre and Pouliquen2005; Mounty Reference Mounty2007). As a result, the two-dimensional square rotating drum simulations of Barker et al. (Reference Barker, Rauter, Maguire, Johnson and Gray2021) could not be compared directly to experiments. In principle, a Coulomb friction boundary condition could be imposed on the sidewalls and then the governing equations could be solved in three dimensions for any width of drum. However, in this paper the influence of sidewall friction is incorporated into the governing equations by width averaging the momentum balance equation (2.2). This reduces the problem to a two-dimensional one, which is much more computationally efficient.
Consider then a three-dimensional granular flow confined within a narrow channel between  $y=0$ and
  $y=W$, where there can be slip at the sidewalls and only weak velocity gradients in the
  $y$ direction. Proceeding in a similar manner to Jop et al. (Reference Jop, Forterre and Pouliquen2005), assuming a Coulomb friction boundary condition at the lateral sidewalls implies
 \begin{equation} \boldsymbol{\tau n} ={-}\mu_W p\frac{\boldsymbol{u}}{|\boldsymbol{u}|}, \quad \text{at}\ y=0,W, \end{equation}
where  $\boldsymbol {n}$ is an outward pointing normal to the sidewall,
  $\mu _W$ is a constant wall friction coefficient and the term
  $-\boldsymbol {u}/|\boldsymbol {u}|$ ensures that friction acts against the flow. The three-dimensional mass and momentum balance equations, defined analogously with (2.1) and (2.2), may then be integrated across the channel width in a similar fashion to the depth-averaged approach for a shallow system (Gray Reference Gray2001; Gray & Edwards Reference Gray and Edwards2014). Width-integrated variables are defined by
 \begin{equation} \tilde f = \frac{1}{W}\int^W_0 f\,\text{d}y, \end{equation}
for any variable  $f$, and when variations in the
  $y$ direction are small,
  $\widetilde {fg}\simeq \tilde f\tilde g$ for any two variables
  $f$ and
  $g$. Integrating and applying the boundary conditions (2.25) results in a two-dimensional system for which the mass and momentum balances become
 $$\begin{gather} \boldsymbol{\nabla}\boldsymbol{\cdot}\tilde{\boldsymbol{u}}=0, \end{gather}$$
 $$\begin{gather}\rho\left(\frac{\partial\tilde{\boldsymbol{u}}}{\partial t} + \tilde{\boldsymbol{u}}\,\boldsymbol{\cdot}\boldsymbol{\nabla}\tilde{\boldsymbol{u}}\right) ={-}\boldsymbol{\nabla} \tilde p + \boldsymbol{\nabla}\boldsymbol{\cdot}(2\tilde\eta\tilde{\boldsymbol{D}}) + \rho\boldsymbol{g} - \frac{2}{W}\mu_W p\frac{\tilde{\boldsymbol{u}}}{|\tilde{\boldsymbol{u}|}}, \end{gather}$$
where  $\boldsymbol {\nabla }=(\partial /\partial x, \partial /\partial z)^T$, the two-dimensional gradient operator. Since there is no lateral flow and small velocity gradients in the
  $y$ direction,
  $\boldsymbol {u}/|\boldsymbol {u}|\simeq \tilde {\boldsymbol {u}}/|\tilde {\boldsymbol {u}}|$, and the tilde notation may be dropped on the understanding that the variables
  $(\boldsymbol {u}, p, \eta, \boldsymbol {D})$ from this point onwards refer to width-averaged quantities of the form (2.26). The final term in the momentum balance equation (2.28) models the influence of sidewall friction on the bulk flow. This alteration provides a straightforward method of capturing three-dimensional wall friction effects in a two-dimensional framework.
3. Numerical method
The mass (2.27) and momentum balances (2.28) are solved in conservative form,
 $$\begin{gather} \boldsymbol{\nabla} \boldsymbol{\cdot} \boldsymbol{u} =0, \end{gather}$$
 $$\begin{gather}\frac{\partial}{\partial t}(\varrho \boldsymbol{u}) + \boldsymbol{\nabla}\boldsymbol{\cdot}( \varrho \boldsymbol{u \otimes u} ) ={-}\boldsymbol{\nabla} p + \boldsymbol{\nabla} \boldsymbol{\cdot} (2\eta\boldsymbol{D}) + \varrho \boldsymbol{g} - \frac{2}{W}\mu_W p\frac{\boldsymbol{u}}{|\boldsymbol{u}|}, \end{gather}$$
where  $\varrho$ is the mixture density and
  $\boldsymbol {\otimes }$ is the dyadic product. In order to handle the evolving free surface, Barker et al. (Reference Barker, Rauter, Maguire, Johnson and Gray2021) used a two-fluid approach in which an excess air phase was considered in addition to the grains. As a result, the governing equations can be numerically solved in a fixed domain, rather than using a deformable grid that adjusts to the evolving free surface, or a particle-based numerical method, i.e. smooth particle hydrodynamics or the material point method. The solids volume fraction,
  $\varPhi$, remains unchanged throughout the mixture, with the excess air considered separately to the background interstitial air, which has volume fraction
  $1-\varPhi$ per unit mixture volume. For a bidisperse granular mixture of small and large particles with excess air, there are volume fractions
  $\varphi ^s$,
  $\varphi ^l$ and
  $\varphi ^a$, respectively. The mixture density
  $\varrho$ and viscosity
  $\eta$ are therefore defined as volume fraction weighted averages including the excess air phase
 \begin{equation} \varrho = \sum_{\forall\nu} \varphi^\nu\varrho^{\nu},\quad \eta = \sum_{\forall\nu} \varphi^\nu\eta^{\nu}. \end{equation}
The density of air  $\varrho ^a$ is a constant and
  $\varrho ^g=\varPhi \rho _*\gg \varrho ^a$, where the superscript
  $g$ denotes the granular phase. The granular viscosities
  $\eta ^g$ are derived from (2.18) and the viscosity of air
  $\eta ^a$ is assumed to be constant. All the relevant numerical parameters are specified in table 2. The excess air is of sufficiently low density and viscosity that it does not affect the motion of the grains, and is purely a numerical convenience.
Table 2. Parameters for the large and small glass beads, the air phase and the triangular drum. The physical parameters for glass beads are adapted from those used by Rocha et al. (Reference Rocha, Johnson and Gray2019) and Mangeney et al. (Reference Mangeney, Bouchut, Thomas, Vilotte and Bristeau2007), to model the experiments of Félix & Thomas (Reference Félix and Thomas2004). These parameters are used to determine  $I_0$ using the definition given by Jop et al. (Reference Jop, Forterre and Pouliquen2005), and
  $\mu _\infty$ is chosen to ensure a well-posed partially regularized
  $\mu (I)$ curve up to
  $I=17.0189$.

The two-fluid approach uses the counter-gradient transport method (Rusche Reference Rusche2002; Weller Reference Weller2008) to sharpen the air–grain interface. This can lead to grid-dependent bubbles of excess air becoming trapped within the high viscosity granular matrix (Barker et al. Reference Barker, Rauter, Maguire, Johnson and Gray2021). In order to remove these bubbles, Barker et al. (Reference Barker, Rauter, Maguire, Johnson and Gray2021) used the advection–segregation–diffusion equations (2.10) to rapidly expel the excess air from the grains. Instead of solving a bidisperse segregation problem, Barker et al. (Reference Barker, Rauter, Maguire, Johnson and Gray2021) therefore solved a three-phase segregation problem. The segregation of both the grains and the excess air was assumed to align with gravity, and it was assumed that air–grain diffusion was zero. This implies that the advection–segregation–diffusion equation (2.10) produces a system of three conservation laws,
 $$\begin{gather} \frac{\partial\varphi^l}{\partial t} + \boldsymbol{\nabla}\boldsymbol{\cdot}( \varphi^l \boldsymbol{u} ) + \boldsymbol{\nabla}\boldsymbol{\cdot}\left({-}f_{ls}\varphi^l\varphi^s \frac{\boldsymbol{g}}{|\boldsymbol{g}|} + f_{ag}\varphi^l\varphi^a \frac{\boldsymbol{g}}{|\boldsymbol{g}|} \right ) = \boldsymbol{\nabla}\boldsymbol{\cdot} ( \mathcal{D}_{ls}( \varphi^s\boldsymbol{\nabla}\varphi^l-\varphi^l\boldsymbol{\nabla}\varphi^s) ), \end{gather}$$
 $$\begin{gather}\frac{\partial\varphi^s}{\partial t} + \boldsymbol{\nabla}\boldsymbol{\cdot}( \varphi^s \boldsymbol{u} ) + \boldsymbol{\nabla}\boldsymbol{\cdot}\left( f_{sl}\varphi^s\varphi^l \frac{\boldsymbol{g}}{|\boldsymbol{g}|} + f_{ag}\varphi^s\varphi^a \frac{\boldsymbol{g}}{|\boldsymbol{g}|} \right ) = \boldsymbol{\nabla}\boldsymbol{\cdot} ( \mathcal{D}_{sl}( \varphi^l\boldsymbol{\nabla}\varphi^s-\varphi^s\boldsymbol{\nabla}\varphi^l) ), \end{gather}$$
 $$\begin{gather}\frac{\partial\varphi^a}{\partial t} + \boldsymbol{\nabla}\boldsymbol{\cdot}( \varphi^a \boldsymbol{u} ) + \boldsymbol{\nabla}\boldsymbol{\cdot}\left({-}f_{ag}\varphi^a\varphi^g\,\frac{\boldsymbol{g}}{|\boldsymbol{g}|}\right ) = 0, \end{gather}$$
where the overall concentration of grains is
 \begin{equation} \varphi^g=\varphi^s+\varphi^l=1-\varphi^a. \end{equation}
The granular segregation velocity magnitude  $f_{sl}$ is defined by the scaling law (2.20) with
  $\mathcal {F}_{sl}$ given by (2.24), and
  $f_{ag}=f_{as}=f_{al}$ assumed to equal a sufficiently large constant (defined in table 2) to expel the excess air rapidly from the grains. The sum of (3.4)–(3.6) reduces to the bulk incompressibility relation (3.1). Moreover, when there is no excess air
  $\varphi ^a=0$, they reduce to the bidisperse advection–segregation–diffusion equations (Gray & Chugunov Reference Gray and Chugunov2006; Gray Reference Gray2018).
Equations (3.1)–(3.2) are of the form of the incompressible Navier–Stokes equations and the pressure–velocity coupling is solved by the PISO algorithm in OpenFOAM (Issa Reference Issa1986), while the concentration equations (3.4)–(3.6) are solved using the multidimensional universal limiter for explicit solution algorithm (Weller Reference Weller2006). The velocity solution and coupling to the mixture composition are calculated explicitly, leading to a Courant–Friedrichs–Lewy (CFL) criterion incorporating the local viscosity (Moukalled, Mangani & Darwish Reference Moukalled, Mangani and Darwish2016), where the CFL number is defined as
 \begin{equation} \mathrm{CFL} = \dfrac{|\boldsymbol{u}|\,\Delta t}{\Delta x} + \dfrac{\eta\,\Delta t}{\rho\,\Delta x^2}. \end{equation}
This should be limited to a characteristic value for the time integration scheme (such as unity for forward Euler). In most multi-phase flows the convective term dominates and the second, viscous term is neglected. The reverse is true for static granular material as the strain rate tends to zero and the viscosity thus becomes infinite, with the resulting requirement that time steps become infinitesimally small. To avoid infinitesimal time steps, a high, constant cutoff value  $\eta _{max}$ is used for the viscosity (see, e.g. Lagrée, Staron & Popinet Reference Lagrée, Staron and Popinet2011; Staron, Lagrée & Popinet Reference Staron, Lagrée and Popinet2012), which is redefined as
 \begin{equation} \eta = \min(\eta_{max},\eta). \end{equation}
This means that a Newtonian viscosity is activated as  $\|\boldsymbol {D} \|\to 0$ or
  $p\to \infty$. Smaller time steps are nevertheless required relative to low viscosity simulations as the viscosity continues to dominate the
  $\mathrm {CFL}$ number. Finally, since the partially regularized
  $\mu (I)$ rheology (2.7) does not have a yield stress and instead enters a creep regime for small values of the inertial number to maintain well-posedness (Barker & Gray Reference Barker and Gray2017), it is not able to model static material, as detailed in § 2.1. It is important to note that although the
  $\mu (I)$ rheology of Jop et al. (Reference Jop, Forterre and Pouliquen2005) does have a yield stress, the maximum viscosity cutoff (3.9) introduces a creep state numerically. This is, however, not sufficient to guarantee well-posedness of the equations (Barker et al. Reference Barker, Schaeffer, Bohorquez and Gray2015; Barker & Gray Reference Barker and Gray2017; Martin et al. Reference Martin, Ionescu, Mangeney, Bouchut and Farin2017). The partially regularized theory of Barker & Gray (Reference Barker and Gray2017), used here, is therefore strongly preferable due its significantly extended region of well-posedness. The numerical method has been extensively tested by Barker et al. (Reference Barker, Rauter, Maguire, Johnson and Gray2021), and the influence of the wall friction term is further tested in Appendix A against a semi-infinite shear-box solution between lateral sidewalls.
4. Segregation and flow of a bidisperse mixture in a triangular rotating drum
4.1. Experimental set-up
Experiments were conducted in a triangular rotating drum with equilateral sides of length  $L=0.257$ m. This was formed from an aluminium outer frame that was confined between two transparent polymethyl methacrylate (PMMA) plates (separated by a gap of width
  $W=3\times 10^{-3}$ m) and screwed together. Before assembly, the PMMA walls were cleaned with anti-static spray and dried to prevent smaller particles sticking to the sidewalls. The glass beads used in the experiments were sourced from Sigmund Lindner GmbH. The larger green glass beads were sieved to a diameter
  $d^l = 600\unicode{x2013}800$
  $\mathrm {\mu }$m, while the smaller red beads had a diameter
  $d^s = 300\unicode{x2013}400$
  $\mathrm {\mu }$m. The desired volumes of large and small grains were measured separately, mixed together and then filled into the drum through a gap in the aluminium frame, which was then tightly closed with a stopper. The exact volume of grains in the drum can vary slightly from the individual combined large and small volumes due to enhanced packing of the mixture (Golick & Daniels Reference Golick and Daniels2009; Thornton et al. Reference Thornton, Weinhart, Luding and Bokhove2012). If necessary, additional grains were added to obtain the desired fill. For the particle-size ratios used in this paper these packing effects were small, and the theory, which is incompressible, appears to be able to capture the observed dynamics and the segregation patterns to a high degree of accuracy.
Particles of different sizes have a strong propensity to segregate. In order to obtain an approximately homogenous initial condition, the drum was oriented horizontally and shaken to induce segregation in the direction normal to the lateral transparent sidewalls. The large green beads therefore segregated to the front (observable) wall, with the small red beads concealed behind them against the rear wall. At any given cross-section of the drum an approximately uniform initial mixture of large and small particles was generated. The back of the drum was then attached to an ElectroCraft S642-1B/T servo motor and a modulation speed control unit to control the rotation rate. The axis of rotation coincided with the centre of the triangle. The drum was narrow enough that cross-slope particle diffusion, within the flowing avalanche, was sufficient to smooth out any lateral variation across it. The final pattern was therefore approximately uniform across the gap, except in the central core, which never entered the avalanche. This initial condition therefore has the additional advantage that the undisturbed core appears to the observer from the front as a uniform region of green particles, providing a strong contrast with the predominantly small red particles that are deposited adjacent to the core. The sidewall friction  $\mu _W=\tan (15.5^\circ )$ is a material property of both the glass beads and the PMMA, and is measured empirically from the angle of failure for a bidisperse mixture of static grains on a gradually inclined PMMA surface (see table 2).
Figure 2 shows a series of photographs of the evolving pattern that develops when a 50:50 bidisperse mixture of large and small grains is rotated in a 70 % filled triangular drum rotating at 2.5 rpm. Supplementary movie 2 shows the full time-dependent evolution. The granular free surface, which was initially horizontal, inclines until a critical angle is exceeded, and a thin surface avalanche forms. The particles segregate very efficiently from one another in the surface avalanche, with the large particles rising to the surface and the small particle percolating down to the base, where they are first to deposit into the underlying solid rotating body of grains. As a result, the large green grains end up adjacent to the drum wall and the smaller red particles deposit closer to the central core. The complex flow field allows a quasi-periodic pattern to develop after just two rotations, which has small-particle rich arms that radiate outwards and point towards the corners of the triangle. A full discussion of the experimental results is deferred until the particle-size distribution of the numerical simulation is introduced in § 4.4.
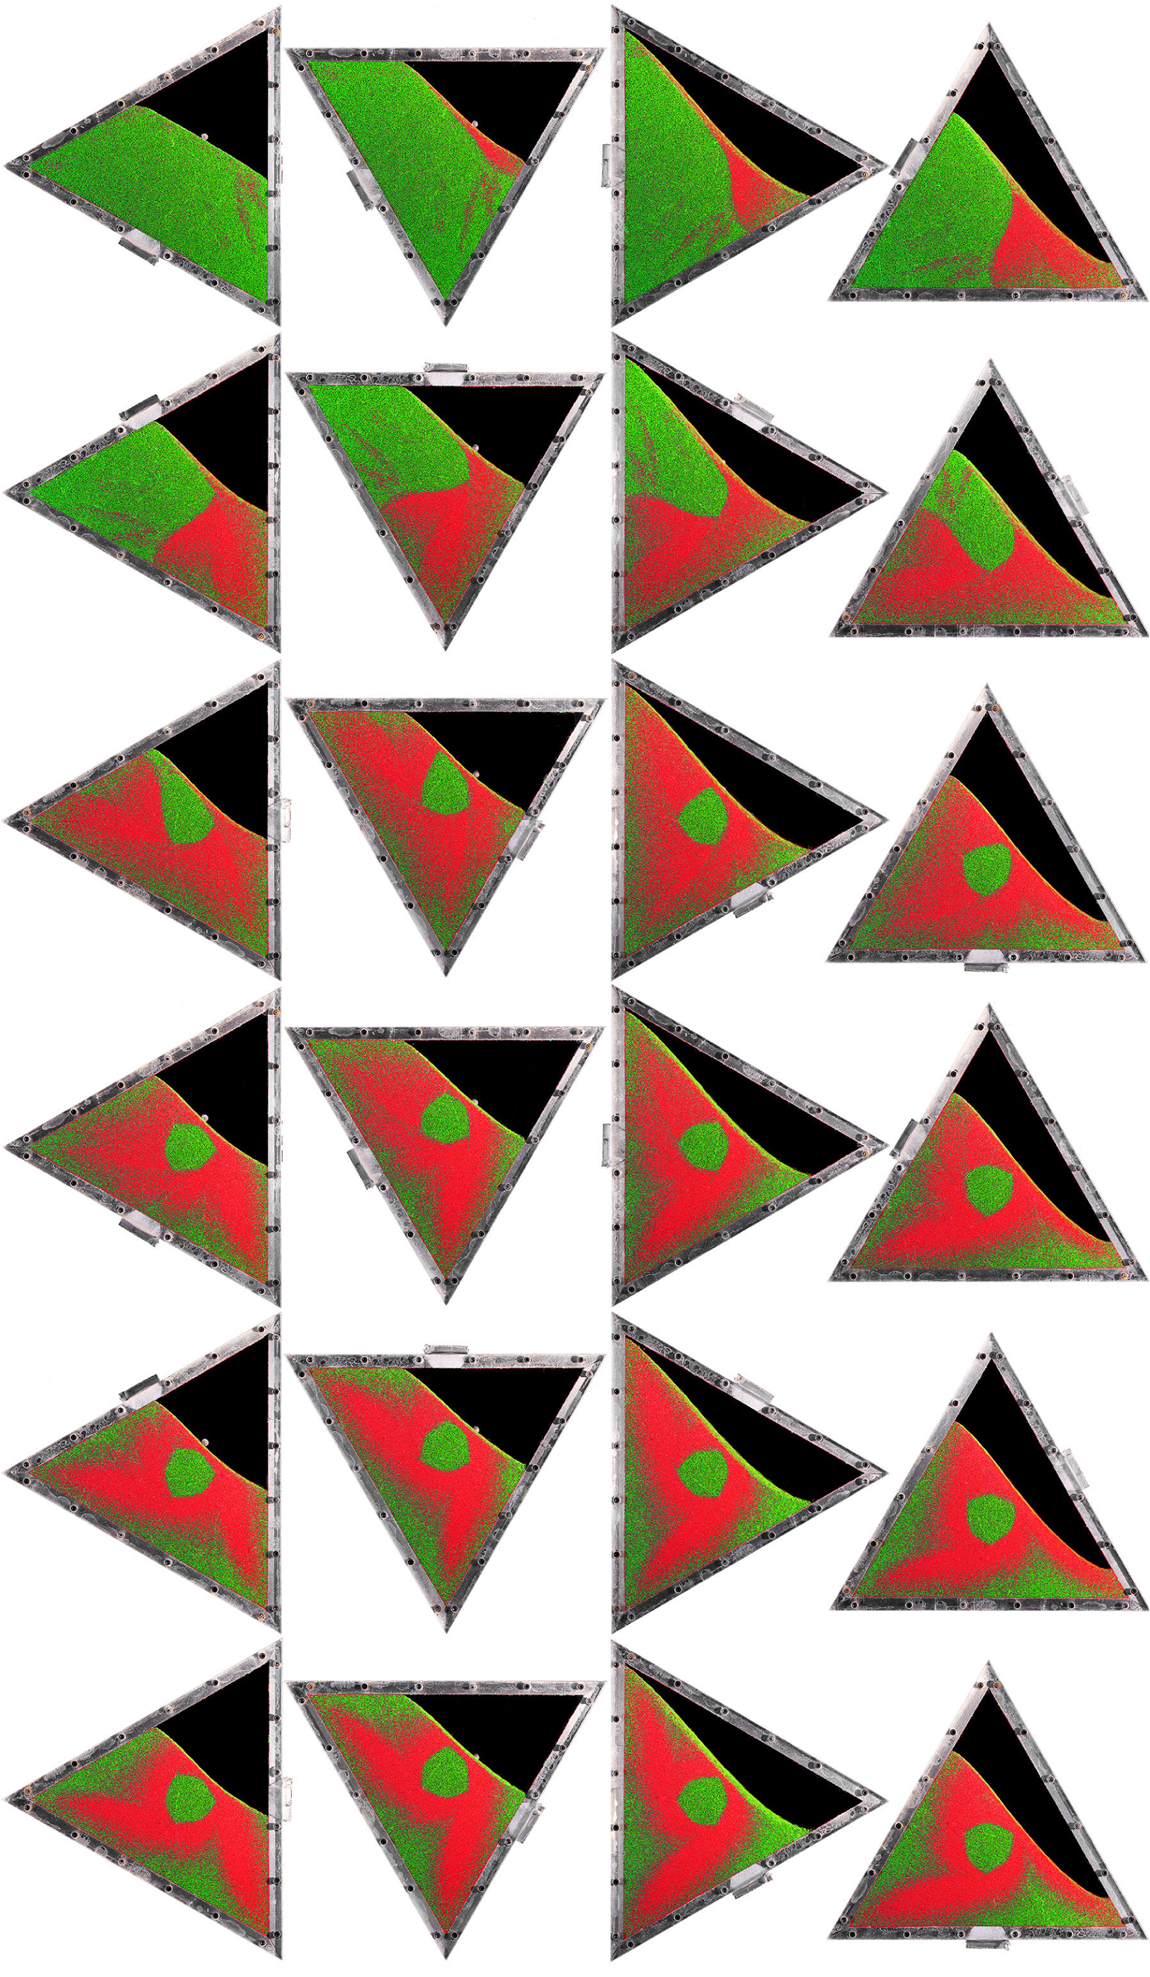
Figure 2. Experimental photos of a 70 % filled drum with a 50:50 mixture of large green ( $d^l = 600\unicode{x2013}800$
  $\mathrm {\mu }$m) and small red (
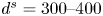 $d^s = 300\unicode{x2013}400$
  $\mathrm {\mu }$m) glass beads rotating at 2.5 rpm. Solid-body rotation occurs in the first 2 seconds. The sequence starts at
  $t=2$ s and progresses in increments of 2 s (30
 $^\circ$ rotation), from left to right, top to bottom, up to
  $t=48$ s (two revolutions). Once the surface avalanche develops, the mixture gradually segregates into a structure of small-particle arms. The protruding stopper provides a reference point for the rotation. Supplementary movie 2 shows the full time-dependent evolution and is available in the online supplementary material.
4.2. Coordinate system, boundary and initial conditions for the simulations
In order to simulate the segregation of the grains in the experimental rotating drum, a fixed Cartesian coordinate system  $Oxz$ is defined with the origin
  $O$ at the axis of rotation and the
  $z$ coordinate pointing in the opposite direction to gravity. The large- and small-particle diameters are assumed to take average values
  $d^l = 700$
  $\mathrm {\mu }$m and
  $d^s = 350$
  $\mathrm {\mu }$m. The large particles are therefore twice the size of the small grains. The drum is filled to 70 % of its volume with an initially homogeneous 50:50 mixture of large and small grains, so that
 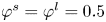 $\varphi ^s=\varphi ^l=0.5$ everywhere within the granular material. In addition, at
  $t=0$ all the material is assumed to be in solid-body rotation with velocity
 \begin{equation} \boldsymbol{u} = \varOmega r\boldsymbol{\theta}, \end{equation}
where  $\varOmega$ is the rotation rate,
  $r$ is the radial coordinate and
  $\boldsymbol {\theta }$ is the azimuthal unit vector (Gray Reference Gray2001). A rotation rate of 2.5 rpm (
 $\varOmega =-{\rm \pi} /12$ rad s
 $^{-1}$) is imposed, which places the drum in the rolling, or continuously avalanching, regime (Henein et al. Reference Henein, Brimacombe and Watkinson1983; Rajchenbach Reference Rajchenbach1990; Gray Reference Gray2001; Mellmann Reference Mellmann2001; Ding et al. Reference Ding, Forster, Seville and Parker2002; Yang et al. Reference Yang, Yu, McElroy and Bao2008). This implies that when the slope exceeds a critical angle, a liquid-like free-surface avalanche forms that continuously erodes and deposits grains with an underlying solid rotating granular body beneath.
It is useful to define the relative velocity to the drum as
 \begin{equation} \hat{\boldsymbol{u}}=\boldsymbol{u} - \varOmega r\boldsymbol{\theta}. \end{equation}
No-slip and no-penetration conditions are imposed on the triangular walls which, using the relative velocity, can be expressed as  $\hat {\boldsymbol {u}}=\boldsymbol {0}$ on the drum walls. These conditions are applied on the rotating mesh using OpenFOAM's mesh-motion routines, with a structured triangular mesh containing
  $N^2=600^2$ cells. The parameters for segregation and diffusion are the universal constants summarized in table 1, while the frictional and remaining parameters for the glass beads and sidewall friction are specified in table 2. There are therefore no fitting parameters used in the simulations.
4.3. Bulk flow solutions and comparison to experiments
In the experiments and numerical simulations, the granular free surface is initially horizontal. As the drum rotates the granular material performs solid-body rotation until a critical angle is reached, and a liquid-like avalanche develops adjacent to the free surface. Due to sidewall friction, the critical free-surface inclination is significantly higher than the static friction angle 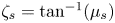 $\zeta _s=\tan ^{-1}(\mu _s)$, which is usually the approximate angle of failure (Barker et al. Reference Barker, Rauter, Maguire, Johnson and Gray2021). The free-surface inclination remains relatively constant, with only subtle periodic variations as shown in figure 3 and supplementary movies 3–5. The entire flow then exhibits a quasi-periodic pulsating behaviour every 120
 $^\circ$ of rotation (8 s), due to the rotation of the drum and the continuously changing drum cross-section occupied by the grains.
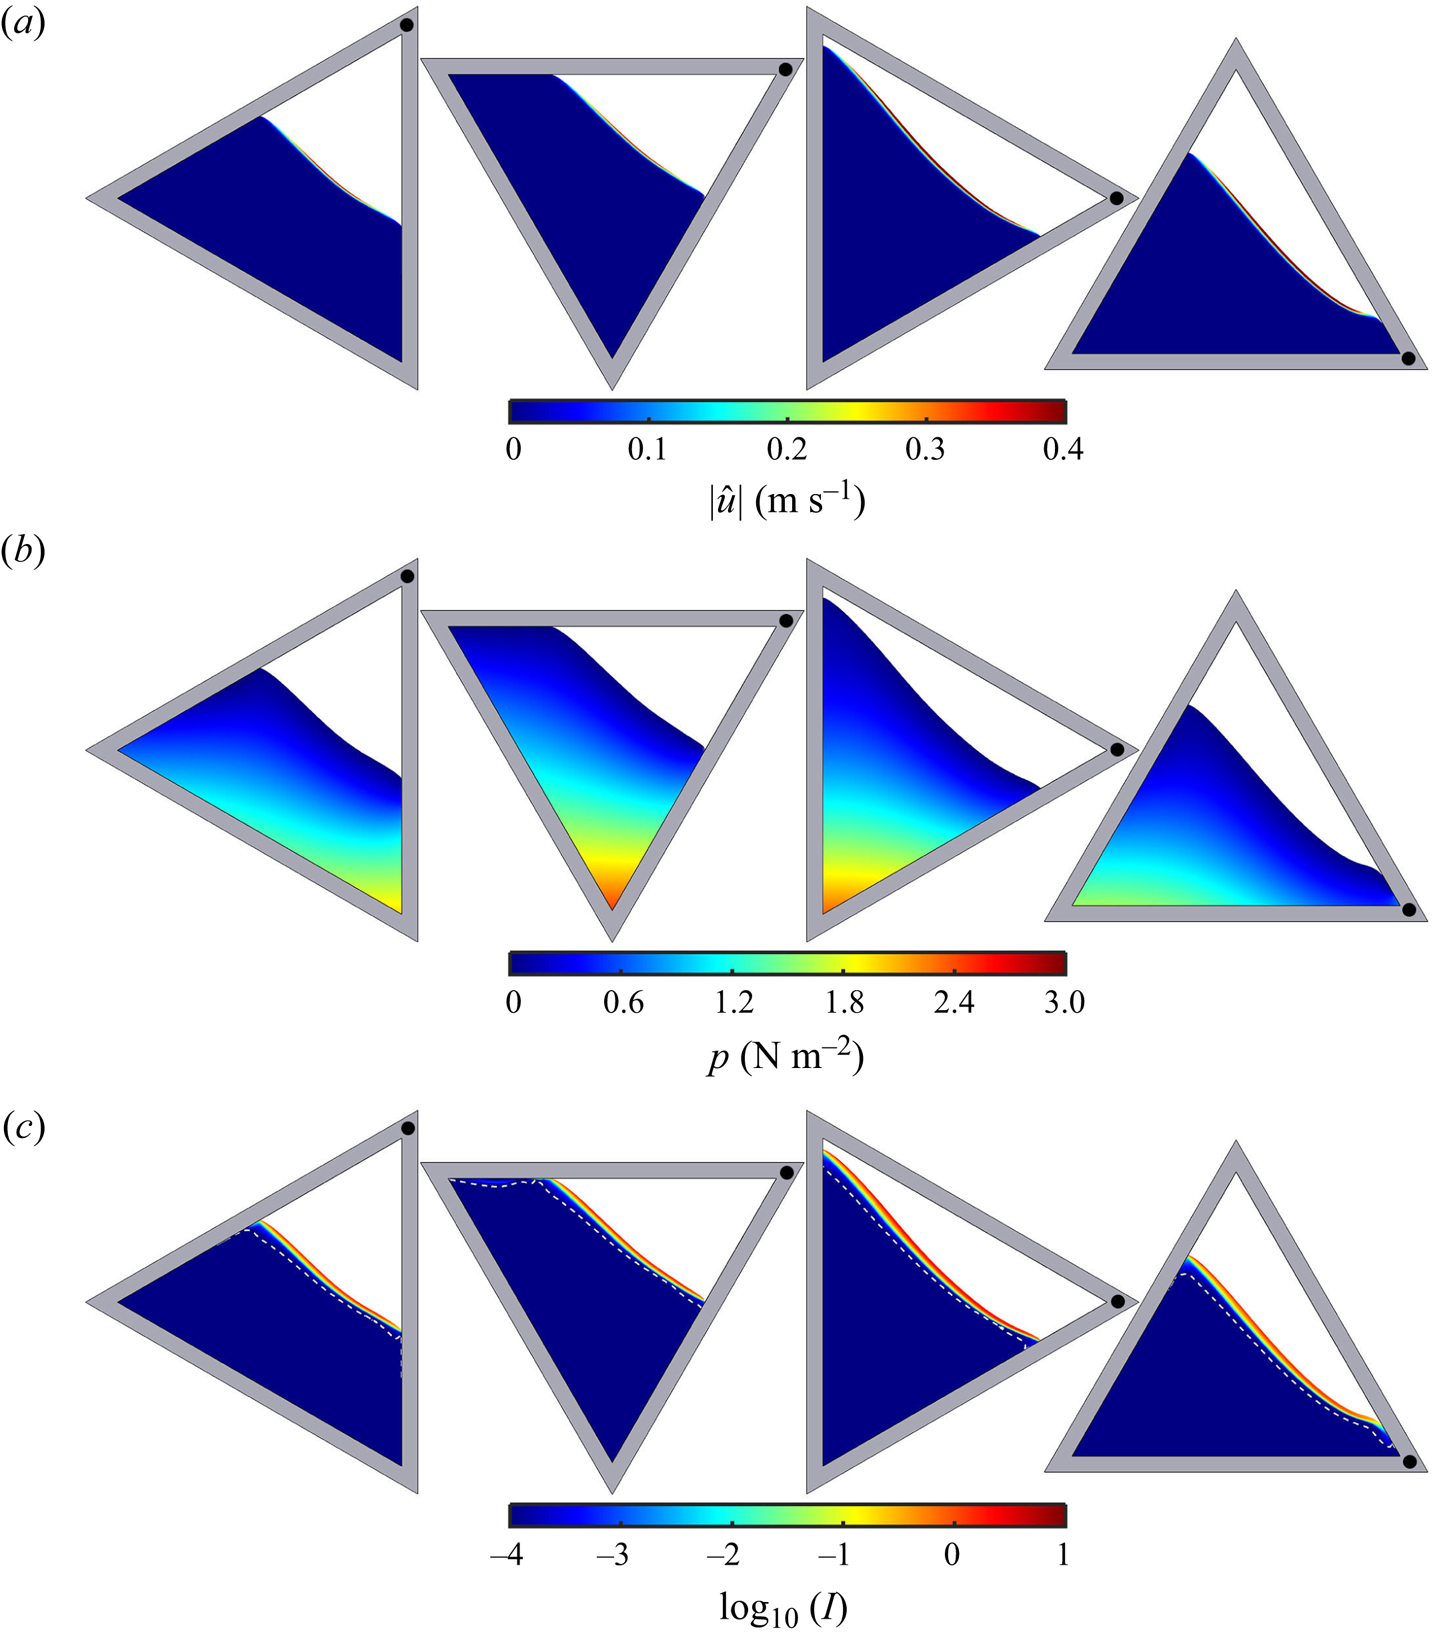
Figure 3. Quasi-periodic motion repeating every 120 $^\circ$ of revolution for a 70 % full triangular drum computed using the parameters from tables 1 and 2. For illustration, each field is shown at
  $t=42$, 44, 46 and 48 s, from left to right, corresponding to one third of a revolution. A black dot is plotted on one corner of the drum frame so that the changing orientation may be easily tracked. Panel (a) shows the modulus of the relative velocity field, (b) the pressure and (c) the base 10 logarithm of the inertial number. The white dashed line in (c) represents the position below which the high viscosity cutoff (3.9) becomes active. The full time-dependent evolution of each of the fields is shown in supplementary movies 3–5 (available online).
There can be subtle feedback effects from the evolving grain-size distribution, but they are not large at 70 % fill (Hill et al. Reference Hill, Khakhar, Gilchrist, McCarthy and Ottino1999; Mounty Reference Mounty2007). The simulation reproduces very closely the free-surface inclination observed experimentally (figure 2), including the slight S-shape, which becomes more pronounced when the free surface is longest, and the subtle inclination dip (at  $t=42$ s in figure 3), which occurs just past the halfway point of the avalanche. Feedback between the bulk flow and the mixture composition plays a more pivotal role at fill levels near 50 %, when the strongly composition-dependent velocity field can lead to the formation of petal-like patterns in the particle distribution (Zuriguel et al. Reference Zuriguel, Gray, Peixinho and Mullin2006) for circular drums, and more complex patterns in triangular and square drums (Hill et al. Reference Hill, Khakhar, Gilchrist, McCarthy and Ottino1999; Khakhar et al. Reference Khakhar, McCarthy, Gilchrist and Ottino1999; Ottino & Khakhar Reference Ottino and Khakhar2000; Mounty Reference Mounty2007).
The length of the avalanche depends on the orientation of the drum. The orientations that generate the longest avalanches also produce the deepest and fastest flowing motion (see times  $t=46$ and 48 s in figure 3a). The longer avalanche length means that more particles are entrained into the avalanche, which increases the flux and the peak velocities that occur about halfway down the avalanche. In the lower reach of the avalanche the particles are deposited back into the solid rotating body and the avalanche thins and decelerates. The super inclination of the slope, combined with acceleration down the increased avalanche length, may also contribute to the peak velocity.
The active avalanching layer is very thin, and is close to the depth observed in the experiments shown in figure 2 and supplementary movie 2. Below the avalanching layer the relative velocity  $\hat {\boldsymbol {u}}$ rapidly decays into a quasi-static creep state. The pressure (figure 3b) has a lithostatic component, but with increasing depth the pressure gradient becomes increasingly gravity aligned. Since both the segregation velocity magnitude and the inertial number are strain-rate dependent, the inertial number (figure 3c) gives an accurate identification of the active layer in which segregation takes place. It appears slightly deeper than that implied by figure 3(a) since
  $\log _{10}(I)$ is plotted. It exhibits less variation in magnitude than
  $|\hat {\boldsymbol {u}}|$ and
  $p$ with changing orientation, in part due to the chosen logarithmic scale, but also because the strain-rate dependent inertial number is tied to velocity gradients rather than velocity. The white dashed line in figure 3(c) indicates the threshold for the high viscosity cutoff (3.9). Above the white dashed line the dynamic and creep regimes of the partially regularized rheology (2.7) are active, while below it the high Newtonian viscosity is applied. Since this quasi-static creeping region is predominantly in rigid body rotation, it has little influence on the overall flow dynamics.
4.4. Particle-size distribution
Figure 4 shows a sequence of images of the computed time-dependent evolution of the small-particle concentration in the 70 % filled drum with a 50:50 mix of large and small particles. Each image is directly comparable to the experimental photos in figure 2, and is separated by two seconds, or equivalently, 30 $^\circ$ angular increments, beginning at
  $t=2$ s and ending after two revolutions. Supplementary movie 6 shows the full time-dependent evolution. In regions of solid-body-like rotation, the shear rate is very close to zero, so the scaling laws, (2.19) and (2.20) imply that both the diffusion and the segregation are negligibly small. The grains therefore stay at
  $\varphi ^s=0.5$ during their initial phase of rotation. The surface avalanche is, however, very efficient at segregating differently sized particles, because the shear rate is high and the pressure is low. This implies that the segregation velocity magnitude (2.20) is much higher than in the solid rotating body, and the grains can segregate. As the particles are deposited along the lower reach of the avalanche into the solid rotating body of grains beneath, the segregation rate once again shuts off, and the deposited particle-size distribution is rotated with the drum. The active region of segregation is therefore confined to a narrow boundary layer close to the free surface, i.e. the avalanche. The highest rate of segregation occurs adjacent to the free surface, as observed experimentally here (see § 4.5) and elsewhere (Gray & Hutter Reference Gray and Hutter1997; Khakhar, McCarthy & Ottino Reference Khakhar, McCarthy and Ottino1997). This effect is intensified by the fact that particles near the free surface have longer trajectories through the actively segregating layer before being deposited, and hence, are subject to more accumulated shear.
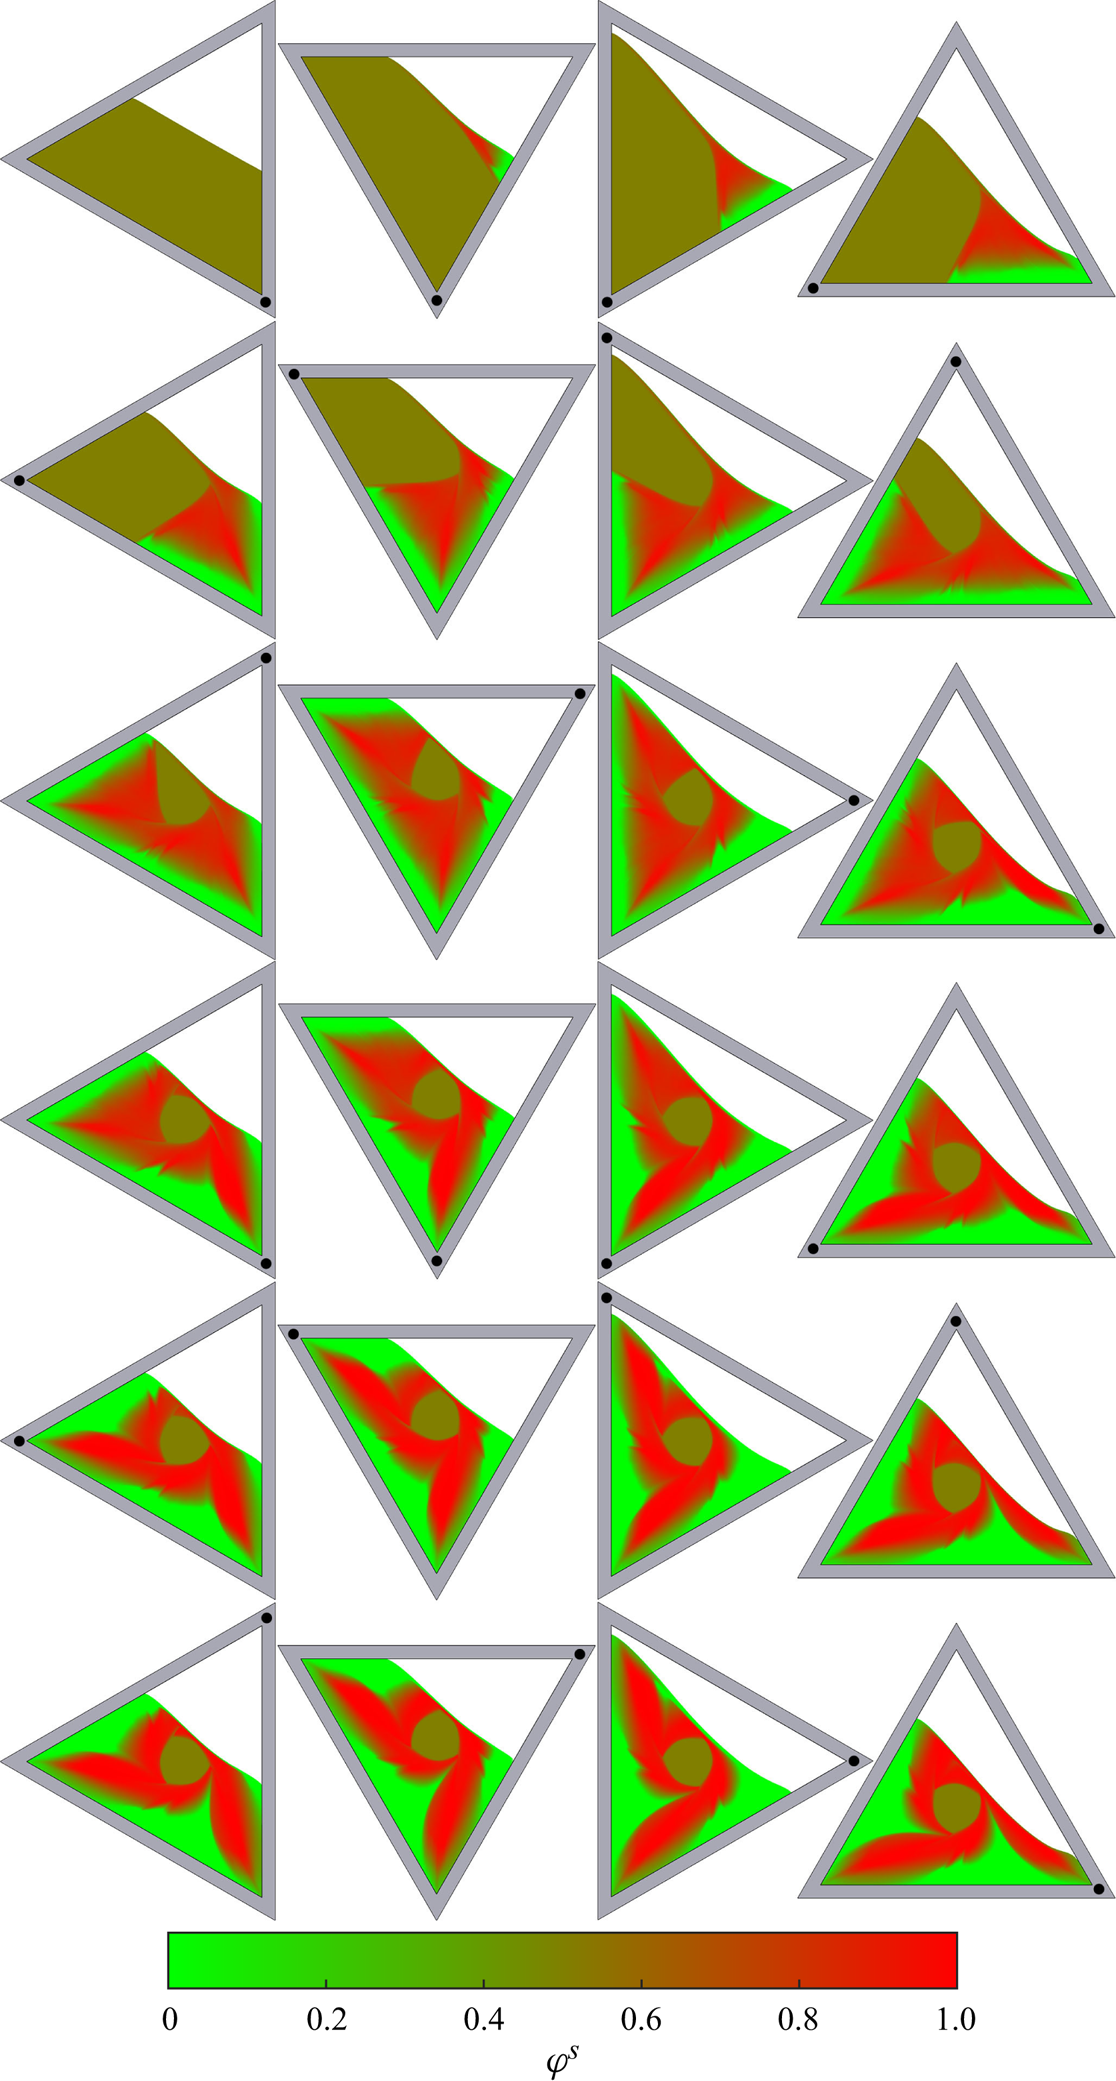
Figure 4. Small-particle concentration in a 70 % filled triangular rotating drum with a 50:50 mixture of large and small particles, computed using the parameters specified in tables 1 and 2. The simulation is shown over two full revolutions, beginning at  $t=2$ s and progressing in increments of 2 s, or 30
  $^\circ$ angular increments, from left to right, top to bottom. The excess air above the grains is coloured white. The images are directly comparable to the experimental photos in figure 2. A small black dot in one corner of the triangular frame provides a reference point for the clockwise rotation. Supplementary movie 6 shows the full time-dependent evolution, and this is compared side-by-side to the experiment in supplementary movie 7.
Since the fill level of the drum exceeds 50 %, a central core forms that is never entrained into the avalanche and remains at its initial concentration (Gray Reference Gray2001; Mounty Reference Mounty2007). The central core is a three-sided shape with curved sides, reminiscent of a Reuleaux triangle. The size of the core is in good agreement with the experiment (figure 2), which is a direct result of (i) the sidewall friction making the avalanche thinner and faster than equivalent flows without sidewall friction, and (ii) the segregation (2.20) and diffusion (2.19) laws confining the particle redistribution to the avalanching region. In contrast, in Barker et al. (Reference Barker, Rauter, Maguire, Johnson and Gray2021) simulations (which neglected sidewall friction) the avalanche was deeper and slower, and consequently, both the central core size and the segregation were underestimated compared with experimental observations (Hill et al. Reference Hill, Khakhar, Gilchrist, McCarthy and Ottino1999; Ottino & Khakhar Reference Ottino and Khakhar2000; Mounty Reference Mounty2007).
Over the first full rotation, the material separates out around the homogeneous core into distinct regions of predominantly large or small particles with a diffuse region separating them. The larger particles, that segregate to the surface of the avalanche, deposit close to the drum wall, while the smaller particles at the base of the avalanche, deposit adjacent to the central core. The combination of the complex time-dependent bulk flow (described in § 4.3) and the ordering mechanism of particle-size segregation then begins to generate a pattern that has small-particle rich arms. The first arm emerges after one complete rotation of the drum (figure 4), and the second arm then follows one third of a turn later. The time scale for the gradual formation of the pattern is captured by the numerical simulation, as shown by the excellent frame-by-frame match between figures 2 and 4, and supplementary movie 7. Over the second rotation of the drum, the arms pass through the avalanche again, the segregation becomes stronger and the pattern becomes more clearly defined. On each third of a revolution the pattern then approximately repeats. Simulations are therefore only performed for the first two drum revolutions.
The pattern exhibits a strong three-fold symmetry. To see this more clearly, it is useful to plot the  $\varphi ^s=0.5$ contour, and then replot it twice more rotated by
  $\pm 2{\rm \pi} /3$ radians. This is done in figure 5 at
  $t=36$ and 44 s. In both cases this produces a triskelion-like pattern with three arms that start adjacent to the central core and radiate outwards in a clockwise sense ultimately pointing towards the corners of the drum. The outer length of the arm is roughly parallel to the adjacent wall of the triangle, culminating in a flattened top. In reality, the full triskelion structure cannot be seen, because one arm necessarily lies above the free surface, but it is interesting to observe the three-fold symmetry using this approach. At
  $t=36$ s, the symmetry is almost perfect, because each arm has passed through the avalanche an equal number of times. At
  $t=44$ s, one of the arms has passed through the avalanche an extra time, so the symmetry is not as good. The arm that has passed through the avalanche an extra time has a large rich crevice that penetrates closer to the central core, elongating the small-particle rich arm. This emphasizes the fact that the pattern is continuing to evolve, with the best symmetries obtained when all the arms have passed through the avalanche the same number of times. The same symmetry is also evident in the experiments in figure 2, despite it being harder to generate a spatially homogeneous initial mixture.
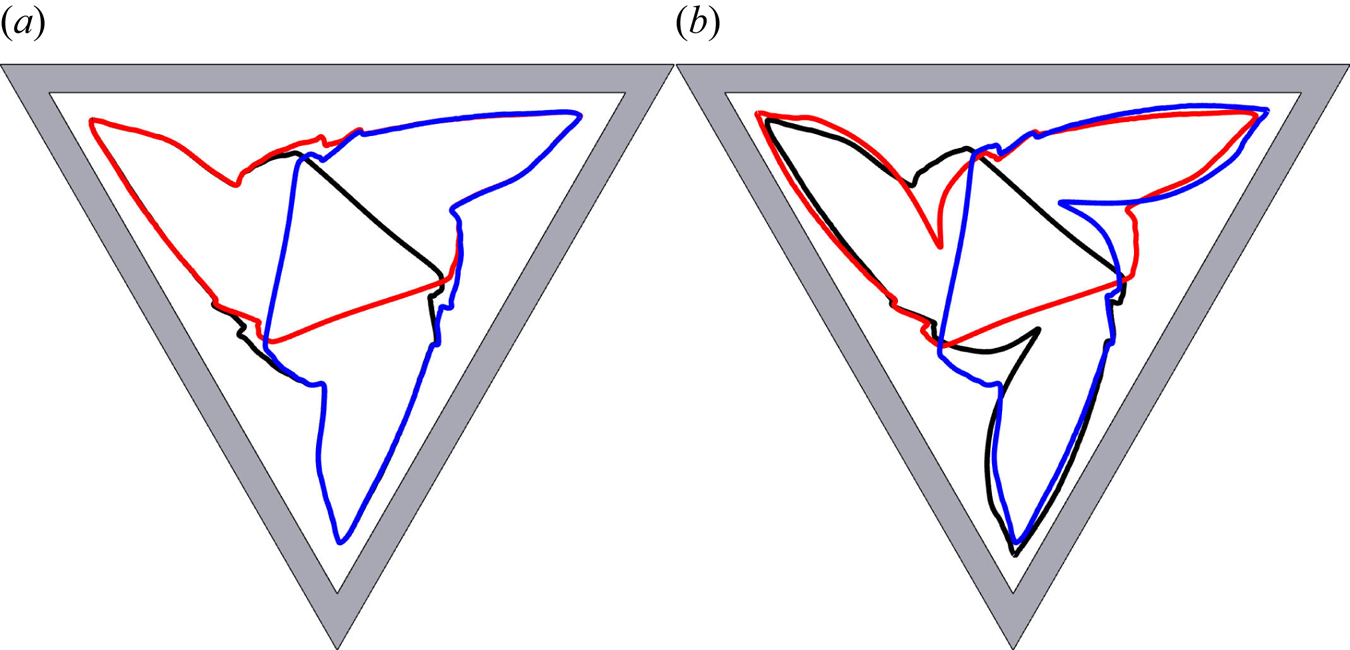
Figure 5. The rotational symmetry of the small-particle rich arms is shown by plotting the  $\varphi ^s=0.5$ contour for the numerical simulations of a 70 % filled triangular rotating drum containing a 50:50 bidisperse mixture at
  $t=36$ s (a) and
  $t=44$ s (b). In both cases the original contour is plotted in black, the same contour rotated by
  $-2{\rm \pi} /3$ rad (i.e. rotation in the clockwise direction) in red and the contour rotated
  $2{\rm \pi} /3$ rad (anticlockwise) in blue. At
  $t=44$ s, one arm has been entrained through the avalanche an additional time, leading to a crevice in this arm near the central core.
4.5. Quantitative analysis and numerical convergence
To provide a quantitative comparison between the simulations and the experiments, this paper focuses on the small-particle concentration field. This can be approximately determined from experimental images using the following method. First, the drum is filled with a mixture of known small-particle concentration, shaken to achieve approximate uniformity and then photographed. The drum, containing this same mixture, is repeatedly shaken and photographed to reduce noise. This process is then repeated for a variety of mean small-particle concentrations across the range  $\bar \varphi ^s\in [0,1]$. All the images are then cropped to remove the non-granular regions, and the colour profiles of the resulting raster images are processed in MATLAB to return a matrix giving the RGB (red-green-blue) intensities for each individual pixel. The ratio of the red intensity to the green intensity is determined for each pixel, and averaged over the entire domain. The red and green intensities exhibit a strong correlation with the mean small-particle concentration since they correspond to the colours of the small and large particles, respectively. This process returns a mean red to green pixel intensity ratio corresponding to each measured mean (over the granular domain) small-particle concentration
  $\bar \varphi ^s$, and the results for a given concentration can be reliably reproduced experimentally. The ratio can then be plotted against
  $\varphi ^s\in [0,1]$ and a best fit curve drawn to give a complete set of unique expected intensity ratios for every possible concentration. In fact, there is an approximately linear relationship between the intensity ratio and the particle concentration, and consequently, the mapping can be further improved.
Once the relationship between the intensity ratio and the concentration is assumed to be linear, the appropriate linear fit can be determined using data taken from only two concentrations. When the mean small-particle concentration  $\bar \varphi ^s=0$ or 1, it follows that
  $\varphi ^s=\bar \varphi ^s$ at every point in the granular mixture. Therefore, the images with these two mean particle concentrations can be divided into
  $8\times 8$ pixel cells, where the cell size is chosen to ensure a reasonable number of particles per cell, and the concentration in every cell is known a priori. The mean colour intensity ratio in each individual cell is then calculated, and the mean cell intensities when
  $\varphi ^s=0$ and 1 can be used to produce the linear fit between intensity ratio and small-particle concentration. This method has three major advantages over using a greater number of points for
  $\bar \varphi ^s$ and taking the mean pixel intensity ratio over the entire drum. First, since it uses data from
  $8\times 8$ pixel cells, it can be used to derive the concentration in cells of the same size from other drum images, without any additional assumption of validity. Second, since the concentration in every cell is known when
  $\bar \varphi ^s=0$ or 1, the standard deviation of the cell intensity ratio can be trivially calculated and used to plot a set of worst fit lines that facilitate accurate error estimation. Error is due to particle shadows and uneven light reflections (Hill et al. Reference Hill, Khakhar, Gilchrist, McCarthy and Ottino1999), which may be reduced, but not eradicated, by an appropriately positioned lighting set-up. Finally, when the drums are filled with pure phases of small or large particles, attempts at attaining a relatively homogeneous mixture are not subject to inadvertent segregation and so the colour intensity data are more reliable than for intermediate particle concentrations.
Using the calculated mapping from colour intensity to concentration, images of the developing rotating drum patterns from figure 2 are divided into  $8\times 8$ pixel cells, so that the mean red to green intensity ratio can be determined for the individual cell and a small-particle concentration value assigned using the set of expected intensity ratios. To account for the undisturbed core, which appears to have
  $\varphi ^s=0$ but in reality has
  $\varphi ^s=0.5$ due to the method of attaining the initial mixture composition (see § 4.1), this region is filled with black pixels for which an exception is made so that they are assigned the correct concentration value. Note that although some pixels elsewhere in the drum appear very dark due to gaps between particles adjacent to the transparent walls, over the
  $8\times 8$ pixel cells there is sufficient saturation of colour to avoid confusion with the central core region. This results in a projected small-particle concentration field for the entire drum. Using this method, the mean particle concentration of the experiments using an approximately 50:50 mixture of large and small particles is calculated to be
 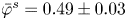 $\bar \varphi ^s=0.49\pm 0.03$, matching very closely with the approximate true value of
  $\bar \varphi ^s=0.5$.
The concentration field for the 70 % filled rotating drum after  $t=48$ s is shown in figure 6. The number of pixels per cell is chosen to give a detailed concentration field with strong image definition where each cell contains many particles. The subtle region of weaker small-particle concentration above the core in the crevice of the arm being entrained into the avalanche is more clearly visible in this image than in the pre-processed image, which is shown in the final panel of figure 2. As predicted by the theory, the predominantly large-particle regions adjacent to the drum walls are more strongly segregated than the small-particle regions adjacent to the central core, since segregation is strongest at the free surface, towards which the large particles are segregated. This was not evident in the pre-processed images, but has been verified by examining the field
  $(\varphi ^s-\bar \varphi ^s)^2$, which confirms that the predominantly large-particle regions deviate further from the mean particle concentration than the predominantly small regions.
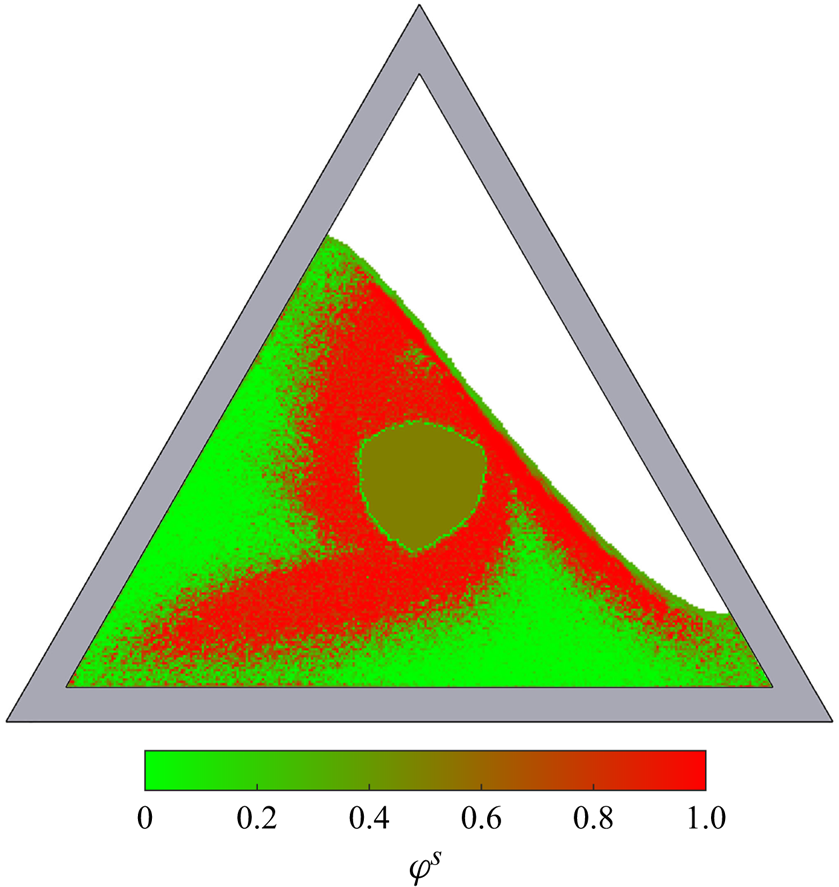
Figure 6. Approximated small-particle concentration field at  $t=48$ s for the experiment using a triangular drum 70 % filled with an approximately 50:50 mixture of large green and small red glass beads. The small-particle concentration is obtained using the projection method described in § 4.5.
To test the strength of the segregation and compare it directly to the simulation data, the segregation intensity is defined analogously to Danckwerts (Reference Danckwerts1952), as the standard deviation of  $\varphi ^s$ normalised by the mean small- and large-particle concentrations,
  $\bar \varphi ^s(1-\bar \varphi ^s)$,
 \begin{equation} \mathcal{S}=\sqrt{\frac{\displaystyle\iint_\omega(\varphi^s-\bar\varphi^s)^2 \,\text{d}{\kern1pt}x\,\text{d}z}{\displaystyle\bar\varphi^s(1-\bar\varphi^s)\iint_\omega \,\text{d}{\kern1pt}x\,\text{d}z}}, \end{equation}
where  $\omega$ is the part of the domain occupied by granular material. This implies that
  $\mathcal {S}=0$ for a homogeneously mixed material, and
  $\mathcal {S}=1$ when it is fully segregated. The computed and experimental segregation intensity are plotted as a function of time and at various grid resolutions in figure 7. Sidewall friction results in a free-surface avalanche that acts as a very thin boundary layer where all the segregation occurs. To correctly predict the segregation and, hence, the overall pattern formation, this boundary layer must be adequately resolved, which requires a very fine numerical mesh. For coarser meshes, the avalanche is under resolved and numerical diffusion therefore leads to an underestimation of the segregation intensity. Although the finest resolution, which uses 600
 $^2$ triangular cells, is not perfectly resolved, the two finest meshes yield similar results, and the time evolution of the segregation intensities demonstrates convergence of the solution with increasing refinement. Furthermore, the simulations appear to be converging on a solution within the error bounds of that derived from experiments. This comparison confirms the earlier observation that the segregation takes place over a similar time scale in simulations and experiments, even when the avalanche is severely under resolved. This means that the numerical simulations provide a strong qualitative and quantitative match with experimental data without the need for any fitting parameters.
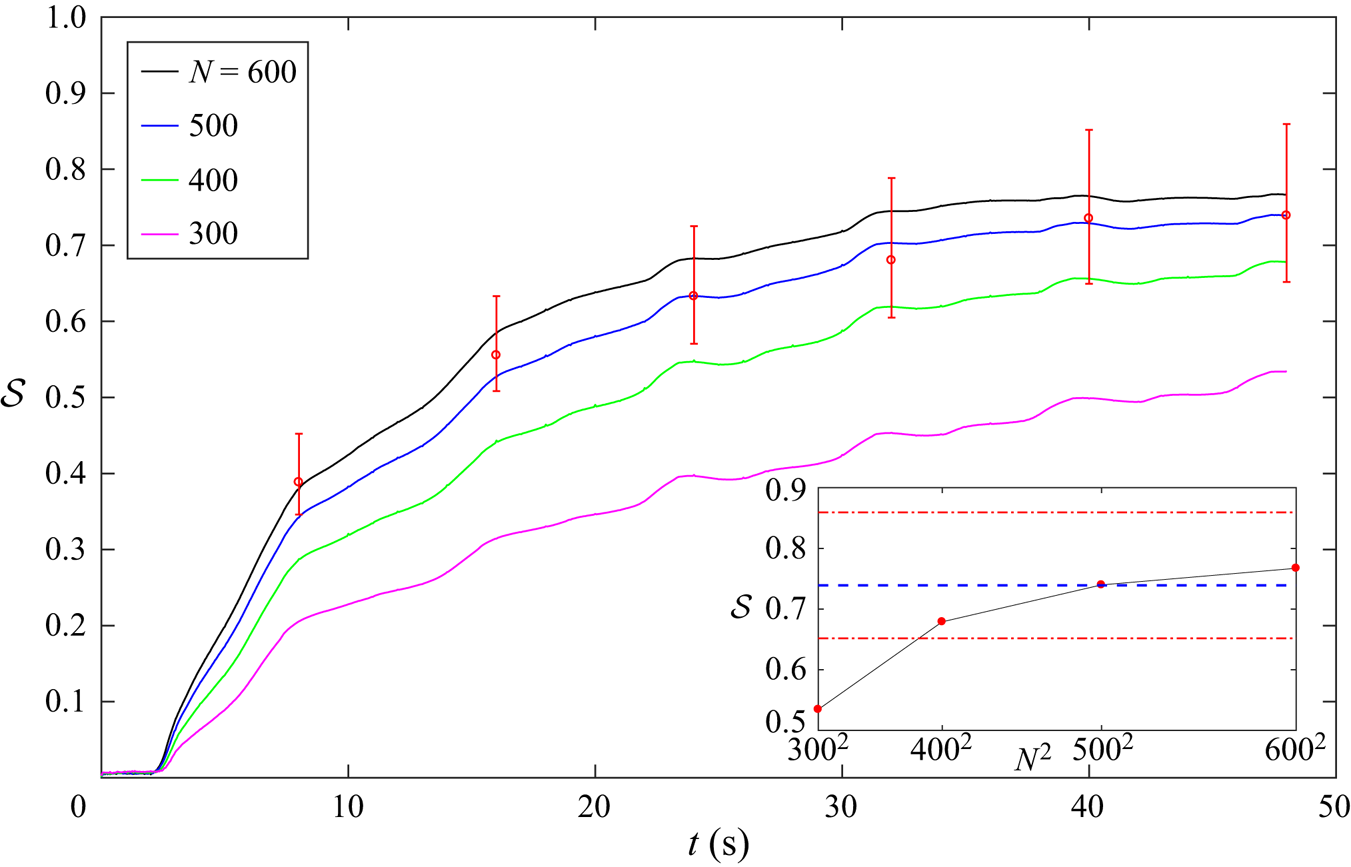
Figure 7. Comparison of the segregation intensity  $\mathcal {S}$, defined in (4.3), with time, in a 70 % filled drum with a 50:50 mix of large and small particles. The experimental data are computed every third of a revolution (i.e. every 8 s) and is shown using red circles. The error bars represent the
  $\pm$1 standard deviation in the RGB intensity mapping used to determine the small-particle concentration. The simulation data (coloured lines) is shown for grid resolutions
  $N=300$, 400, 500 and 600. This is equivalent to a total number
  $N^2$ mesh cells. In the inset, the segregation intensity of the simulations at
  $t=48$ s is plotted against the grid resolution, with the segregation intensity calculated for the experiment represented by the dashed blue line for comparison, while the dot-dashed red lines represent the experimental error of the intensity.
The simulation data shows periodic peaks and troughs in segregation intensity with a period of one third of a revolution. This can be expected given the variation in the avalanche dynamics with the shifting geometry (see § 4.3 and figure 3), which produces higher strain rates, longer particle trajectories through the avalanche and, hence, stronger segregation when the avalanche is at its longest. Both the experimental and computed segregation intensity begin to stabilize after the second revolution, with the final segregation intensity of  $S=0.77$ at
  $t=48$ s at the highest resolution. After this time it will continue to plateau over many revolutions, but will never become fully periodic (Mounty Reference Mounty2007).
5. The importance of lateral sidewall friction
The theoretical and numerical framework used to compute the rotating drum simulation in § 4 uses width-averaged, two-dimensional mass and momentum equations with Coulomb slip assumed on the transparent confining sidewalls. These sidewalls are separated by a narrow gap in experiments, in order to keep the flow fully two dimensional, and hence, allow observation of the pattern (see figure 2). It is of interest to see what effect the sidewalls have on the pattern that forms.
Figure 8(a) shows a comparison between the particle-size distribution patterns formed in the experiment in § 4.1 at  $t=48$ s, and numerical simulations with and without sidewall friction. As discussed in § 4.4, the simulation computed with sidewall friction matches excellently to the experimental results, without any fitting parameters. However, for the simulations without sidewall friction, almost no segregation has occurred after two drum revolutions. The segregation intensity is just
  $\mathcal {S}=0.0663$, which indicates that there has been little deviation from the initial mixed state. A very thin region of large particles and a weaker region of small particles are discernible close to the drum walls, but in place of the triskelion pattern there is a simple triangular shape. This indicates that sidewall friction is not only a necessary consideration for accurate modelling of rotating drum experiments performed in narrow gaps between transparent sidewalls, but is one of the dominant physical mechanisms determining the nature and extent of the segregation. At later times the segregation intensity continues to increase without sidewall friction, but even after 20 revolutions, when
  $\mathcal {S}=0.3007$, it has not reached a plateau. This indicates that the simulations without sidewall friction dramatically over estimate the segregation time scale.
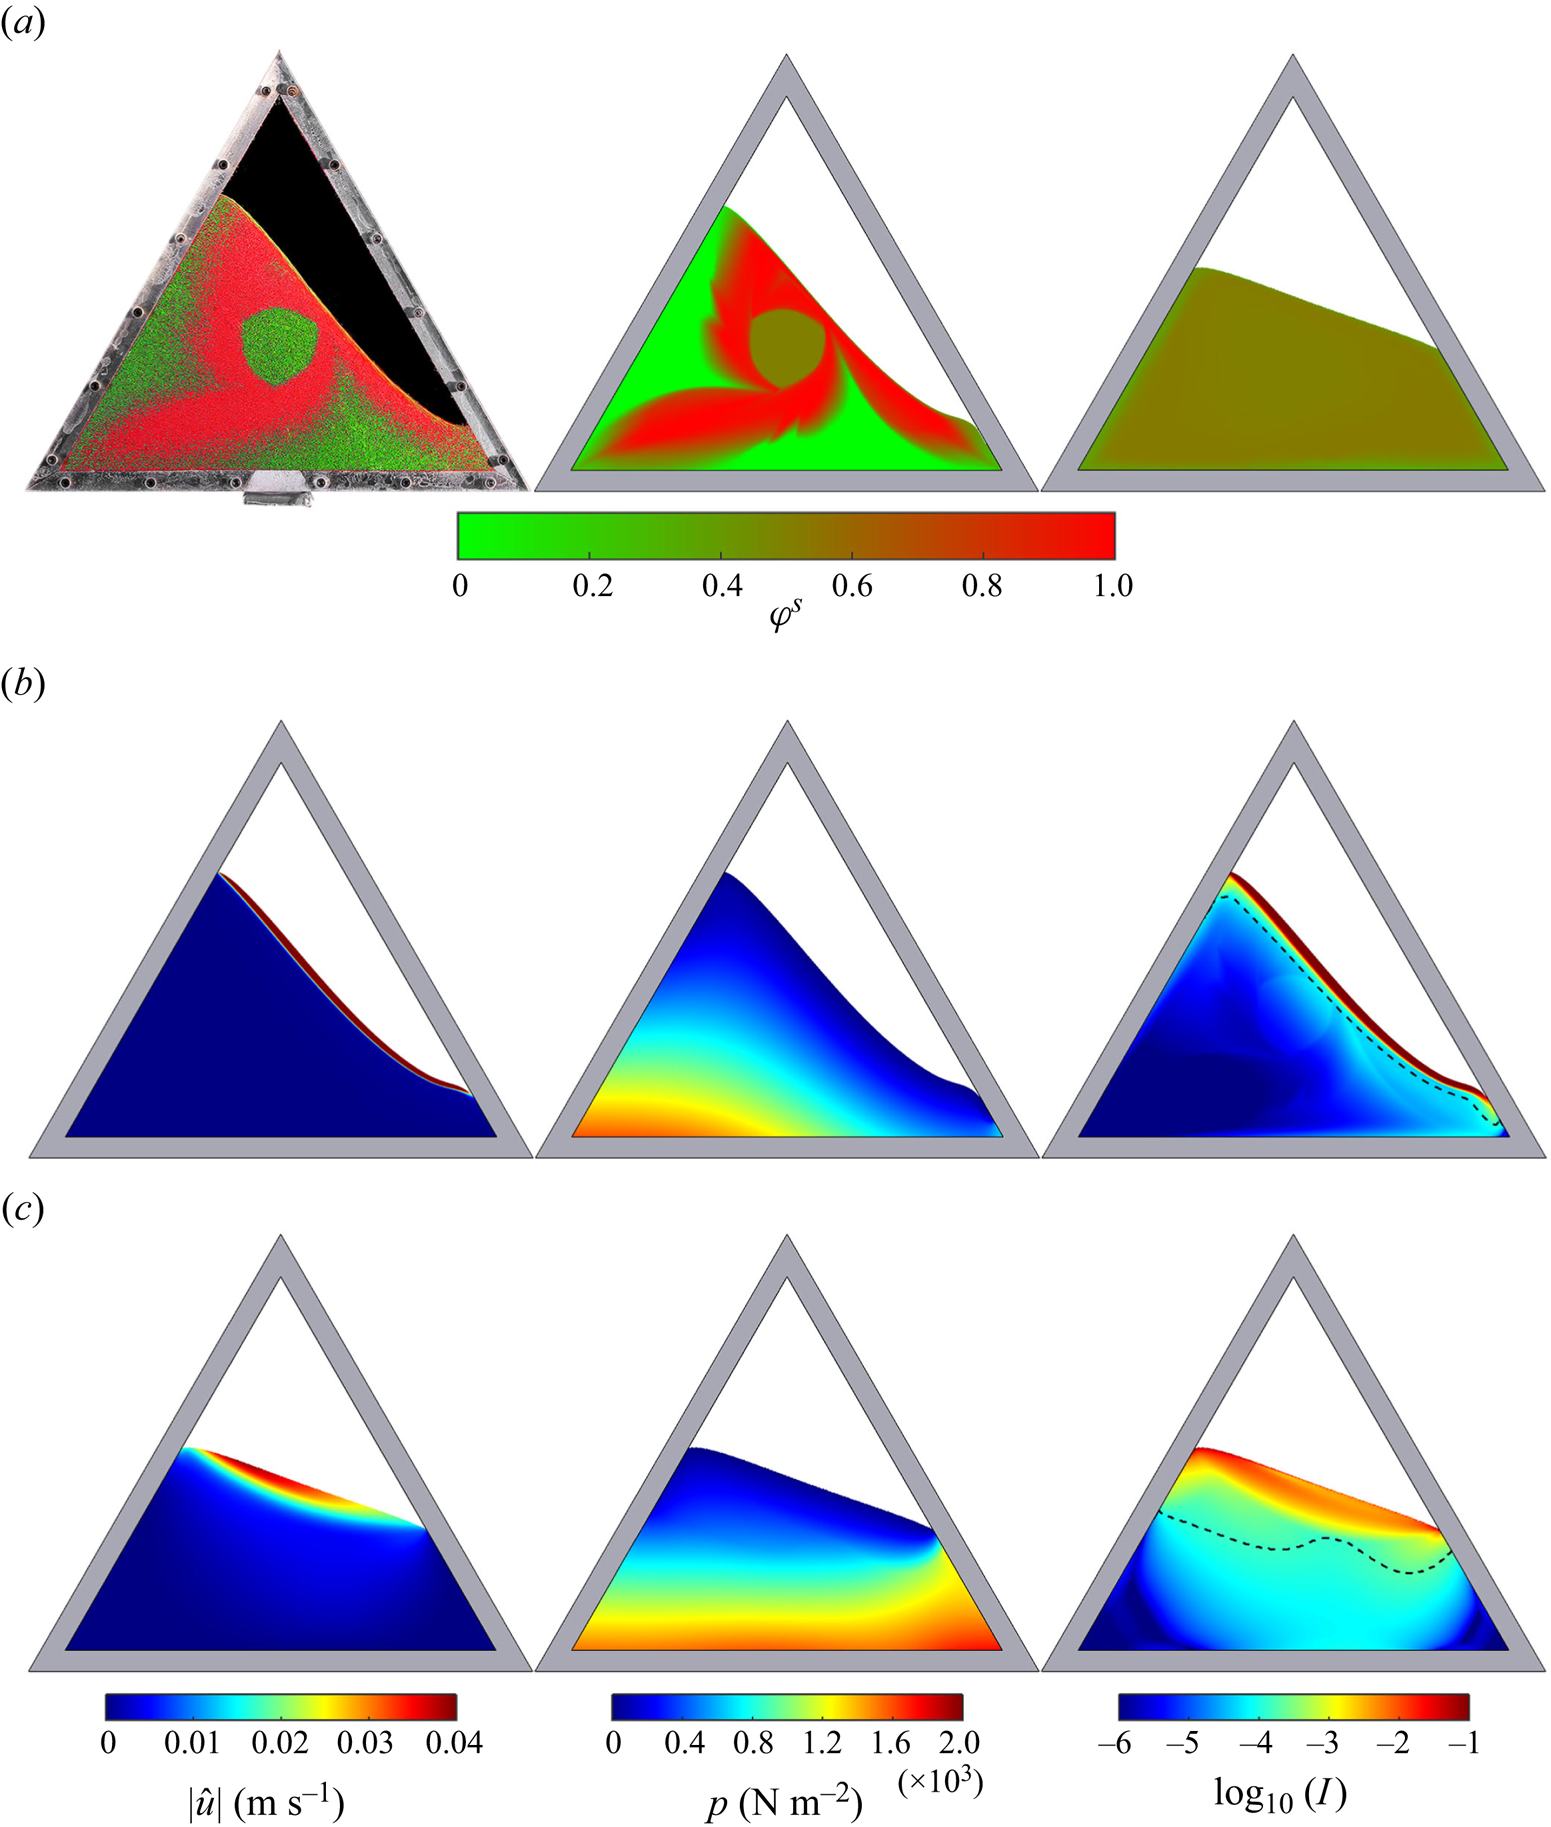
Figure 8. (a) Particle-size distributions in a bidisperse triangular rotating drum flow at  $t=48$ s for the experiment described in § 4.1 (left), the simulation with sidewall friction (middle) and without sidewall friction (right). Supplementary movies 2, 6 and 8 show the corresponding time-dependent evolution and are available online. (b) The corresponding simulated bulk flow fields with sidewall friction and (c) without sidewall friction. The simulations without sidewall friction assume
  $\mu _W=0$. The rest of the parameters are summarized in tables 1 and 2. The black dashed line indicates the position below which the high viscosity cutoff (3.9) becomes active. The particle segregation is extremely weak and the free-surface inclination angle is drastically reduced without sidewall friction.
In the absence of sidewall friction the free surface is straight rather than S-shaped, and the inclination angle is reduced to a value close to the static friction angle of 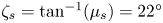 $\zeta _s=\tan ^{-1}(\mu _s)=22^\circ$ (Barker et al. Reference Barker, Rauter, Maguire, Johnson and Gray2021). The bulk flow fields, with and without sidewall friction, are plotted in figures 8(b) and 8(c), respectively. Since the segregation law (2.20) is the same in both simulations, it is the differences in the bulk flow dynamics that underpins the weak segregation in the absence of sidewall friction. The peak velocity magnitude
  $|\hat {\boldsymbol {u}}|\approx 0.14$ ms
 $^{-1}$ without sidewall friction, which is a five-fold reduction relative to the simulation computed with sidewall friction, where
  $|\hat {\boldsymbol {u}}|\approx 0.7$ ms
 $^{-1}$. Overall the modulus of the relative velocity in the free-surface avalanche is about an order of magnitude smaller without sidewall friction. The avalanche is also much thicker, as predicted by the observations of Jop et al. (Reference Jop, Forterre and Pouliquen2005), and the velocity decays only gradually. The pressure field is similar, but the inertial number never approaches the high values with
  $I\approx 1$ observed in the presence of sidewall friction. The high viscosity cutoff is activated much deeper into the flow without sidewall friction. This reveals why the mixture segregates so weakly; the reduced strain-rate magnitude, owing to the thicker, slower flow, feeds back into the segregation scaling law (2.20) and inhibits the particle segregation. Barker et al. (Reference Barker, Rauter, Maguire, Johnson and Gray2021) showed that this could be partially circumvented by using artificially over-sized particles, comparable to the order of magnitude to the avalanche depth. This naturally results in a more strongly segregated mixture, but nevertheless fails to predict the patterns observed in experiments with the accuracy of the computations presented in § 4. The simulations in figure 8 therefore demonstrate that for rotating drum flows confined within a thin channel, it is essential that lateral sidewall friction be incorporated to capture the correct flow dynamics and the resulting particle-size segregation.
6. Varying fill fractions
The fill fraction is now varied systematically using the same homogeneous 50:50 initial mixture of large and small particles, and the same rotation rate as in § 4. Figure 9 shows the experimental and computed patterns that form after two revolutions for fill levels of (a) 30 %, (b) 50 %, (c) 70 % and (d) 80 %. In comparison with the 70 % filled drum discussed in § 4, the homogeneous central core for the 80 % filled drum is much larger due to the elevated position of the free-surface avalanche, whereas for the 30 % and 50 % filled drums no core forms as all the particles pass through the avalanche during each revolution.
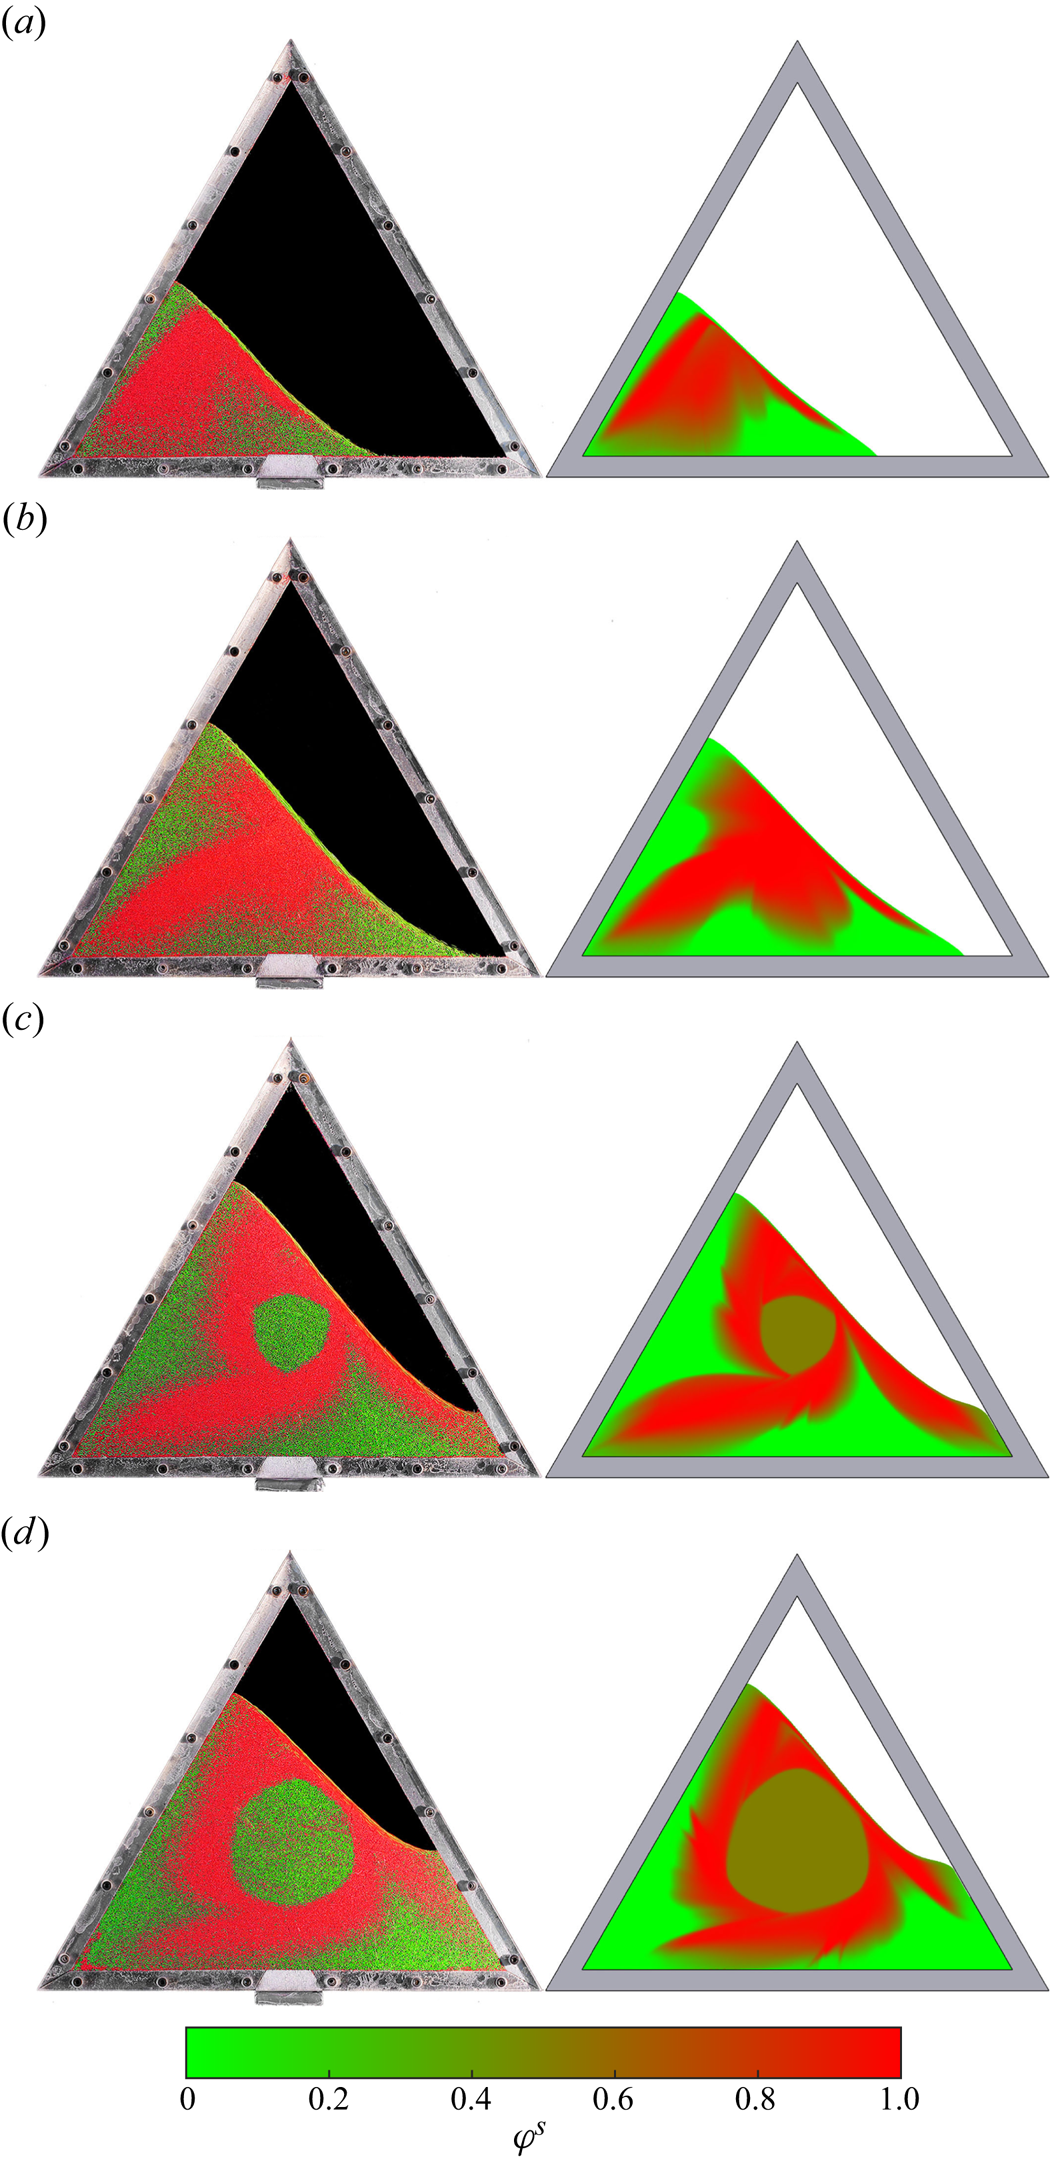
Figure 9. Comparison of triangular rotating drum patterns at various fill fractions for experiments (left) and computations (right). The same 50:50 mixture of large green and small red glass beads is used as in § 4, and the pattern is shown after two drum revolutions at  $t=48$ s. The drums are (a) 30 %, (b) 50 %, (c) 70 % and (d) 80 % filled. Supplementary movies 2 and 6 show the existing experimental and simulated 70 % filled case, while supplementary movies 9–14 show the other fill levels and are available online.
Structurally, a similar pattern emerges for the 70 % and 80 % filled drums, although interestingly the homogeneous central cores appear to have opposite orientations. In fact, the corners of the central core are formed when the free-surface avalanche is longest, and therefore, fastest and thickest, and the corners in the 80 % filled drum are simply more subtle because the core region bulges outwards between corners. This is evident in the experiment and particularly in the numerical simulation shown in figure 9(d), which successfully capture the broad features observed experimentally. The undisturbed core is slightly larger in the simulation, suggesting the avalanche thickness is underestimated, but it accurately reproduces the shape that develops in the experiment. Unlike the 70 % filled drum, the core does not approximate a Reuleaux triangle as the curvature of the sides is not approximately constant. The small-particle rich lobes are less pronounced than for the 70 % filled drum in figure 9(c), and do not exhibit the flattened tip in either simulation or experiment, instead producing a pointed tip. As shown in supplementary movies 11 and 14, the simulation at 80 % fill correctly captures the time evolution of the small-particle arms, which form over the first drum revolution and become slightly shorter after subsequent re-entrainment in the second revolution. The S-shaped free surface is reproduced very accurately by the numerical simulation, with the curvature particularly pronounced around the downslope avalanche position.
The patterns in the 30 % and 50 % filled drums are qualitatively very different to those discussed so far. Both cases are apparently reduced to a single small-particle lobe, which is repeatedly entrained through the free-surface avalanche and re-orientated towards the second corner of the drum frame in the clockwise direction, or by  $-4{\rm \pi} /3$. Furthermore, the arms have a slight arc in the anti-clockwise direction, unlike the 70 % and 80 % filled drums for which the arms have a clockwise arc, which is also predicted by both numerical simulations. At both 30 % and 50 % filled, the numerical simulation accurately captures the structure of the particle-size distribution observed in the experiment, although the S-shape of the free surface is weaker in the former simulation. At the 30 % fill level, the small-particle concentration is very strong on the outer curved edge of the arm and more diffuse towards the inside.
For the 50 % filled drum, there are regions of high small-particle concentration either side of the arm near the free surface, which would eventually coalesce into a more obvious second arm if the fill level were increased. In fact, the particle distribution structure at 50 % filled is a transitional stage between the structures observed at lower and higher fill fractions, and may be said to consist of two small-particle arms. At orientations when the free surface is approximately parallel to the lower drum wall, for example, at  $t=42$ s, plotted in figure 10, there are small-particle regions orientated towards both the corners of the drum occupied by granular material. These regions may be interpreted as a single arm, partially deposited downslope and partially in the upslope position, re-orientated by
  $-4{\rm \pi} /3$ each time it passes through the avalanche. However, they should instead be identified as two genuinely distinct small-particle arms re-orientated by
  $-2{\rm \pi} /3$ after each entrainment. In figure 9(b) the second arm is undergoing entrainment through the avalanche, separated from the other by a more diffuse region.
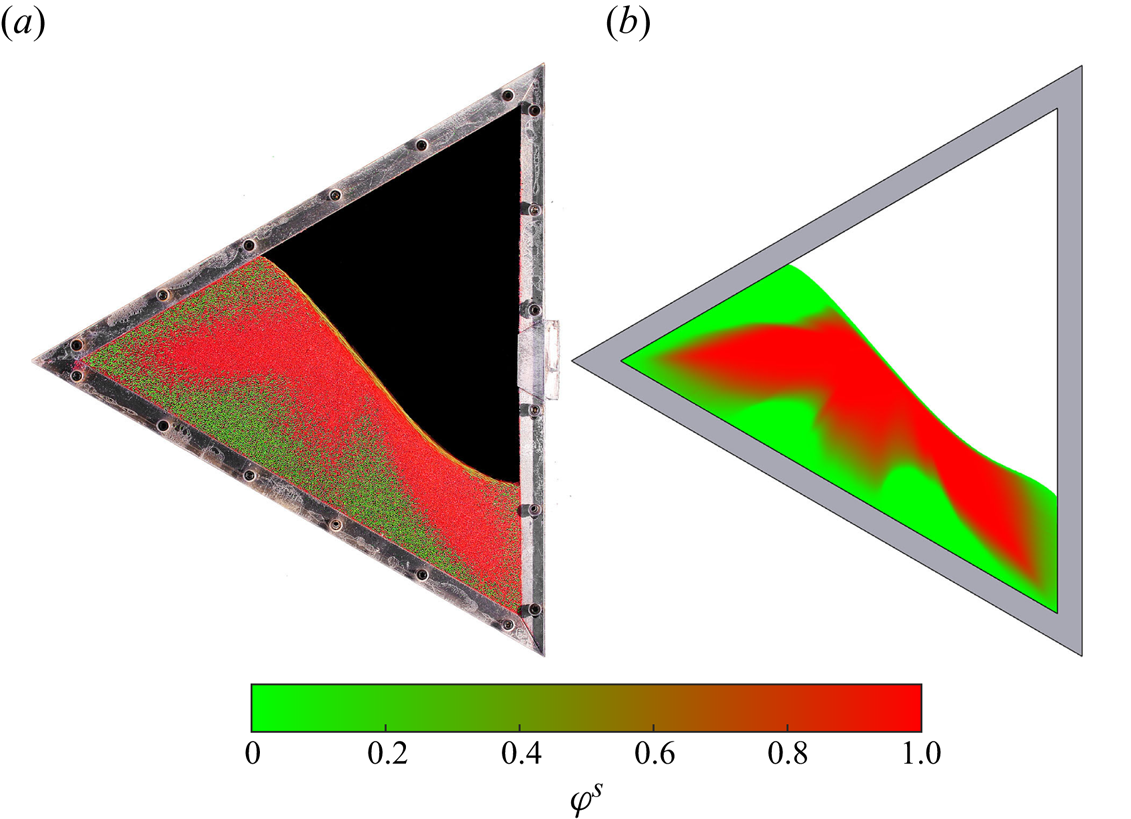
Figure 10. Photo of the experiment (a) and the small-particle concentration in the numerical simulation (b) of a 50 % filled drum at  $t=42$ s containing a 50:50 mix of large green and small red glass beads. Two small-particle arms are distinguishable when the free surface is approximately parallel to the lower drum wall.
Quantitative comparisons between the segregation intensity (4.3) in the numerical simulations and the experiments is shown in figure 11. In each case, the time scale and intensity of segregation in the simulations matches very closely with the experimental data. For both experiments and simulations, the final segregation at  $t=48$ s is weakest at 80 % fill (where
  $\mathcal {S}=0.69$, taken from the simulation data) and strongest at 50 % fill (
 $\mathcal {S}=0.81$), while the 30 % filled drum takes an intermediate value (
 $\mathcal {S}=0.73$). The segregation is weakest at 80 % fill partly due the enlarged undisturbed central core, and may be highest at 50 % fill due to the relatively small variation in the avalanche length, as can be seen in the supplementary movies. The intensity in the experiments is initially slightly stronger at 30 % fill than 50 % fill, before the latter case becomes significantly stronger in the second revolution of the drum. This behaviour is also predicted in the simulations, where the curves intersect near
  $t=16$ s before diverging. While the 80 % filled drum exhibits a relatively smooth increase with only small peaks and troughs of the segregation intensity, which very gradually plateaus, at 50 % and particularly at 30 % fill the intensity fluctuates more erratically. At 30 % fill each peak represents a brief plateau, which actually decrease in intensity before again increasing, and the estimated intensity of the experiments broadly confirms this phenomenon since the intensity is higher at
  $t=24$ s than
  $t=32$ s. The peak and trough shapes of the simulation curves are heavily dependent on the fill fraction, and they also become more pronounced at a 30 % fill fraction because the rotation of the drum walls dramatically alters the geometry of the enclosed granular region.
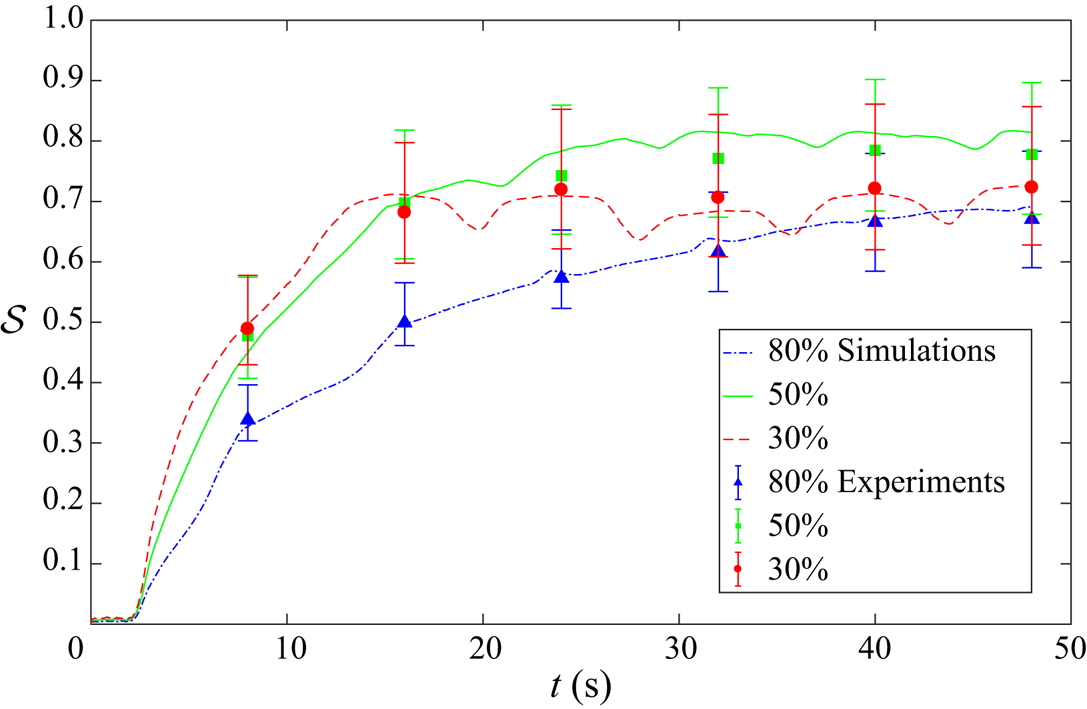
Figure 11. Comparison of the temporal evolution of the segregation intensity (4.3) between experiments (symbols with error bars) and numerical simulations (curves), for 80 %, 50 % and 30 % filled drums. A 50:50 mix of large and small particles is used in each case, and each simulation is performed with  $N^2=600^2$ grid points.
7. Varying mean particle concentrations
Attention is now turned to the dependence of the particle-size distribution and bulk flow fields on the mixture composition. Initially two further cases are examined; a 70:30 and a 30:70 mix of the of large green ( $d^l = 600\unicode{x2013}800$
  $\mathrm {\mu }$m) and small red (
 $d^s = 300\unicode{x2013}400$
  $\mathrm {\mu }$m) particles, in addition to the original 50:50 mix. For ease of notation, these mixtures will also be referred to by the mean initial small-particle concentration, i.e.
  $\bar \varphi ^s=0.3$, 0.5 and 0.7, respectively. In all cases the fill level is 70 %. In the experiments the same technique of shaking the drum in the horizontal orientation is used to produce an approximately homogeneous initial mixture. This time, however, the inversely graded layers of large and small particles can differ in thickness. Results from the experiments and numerical simulations are displayed in figure 12 and supplementary movies 2, 6 and 15–18.
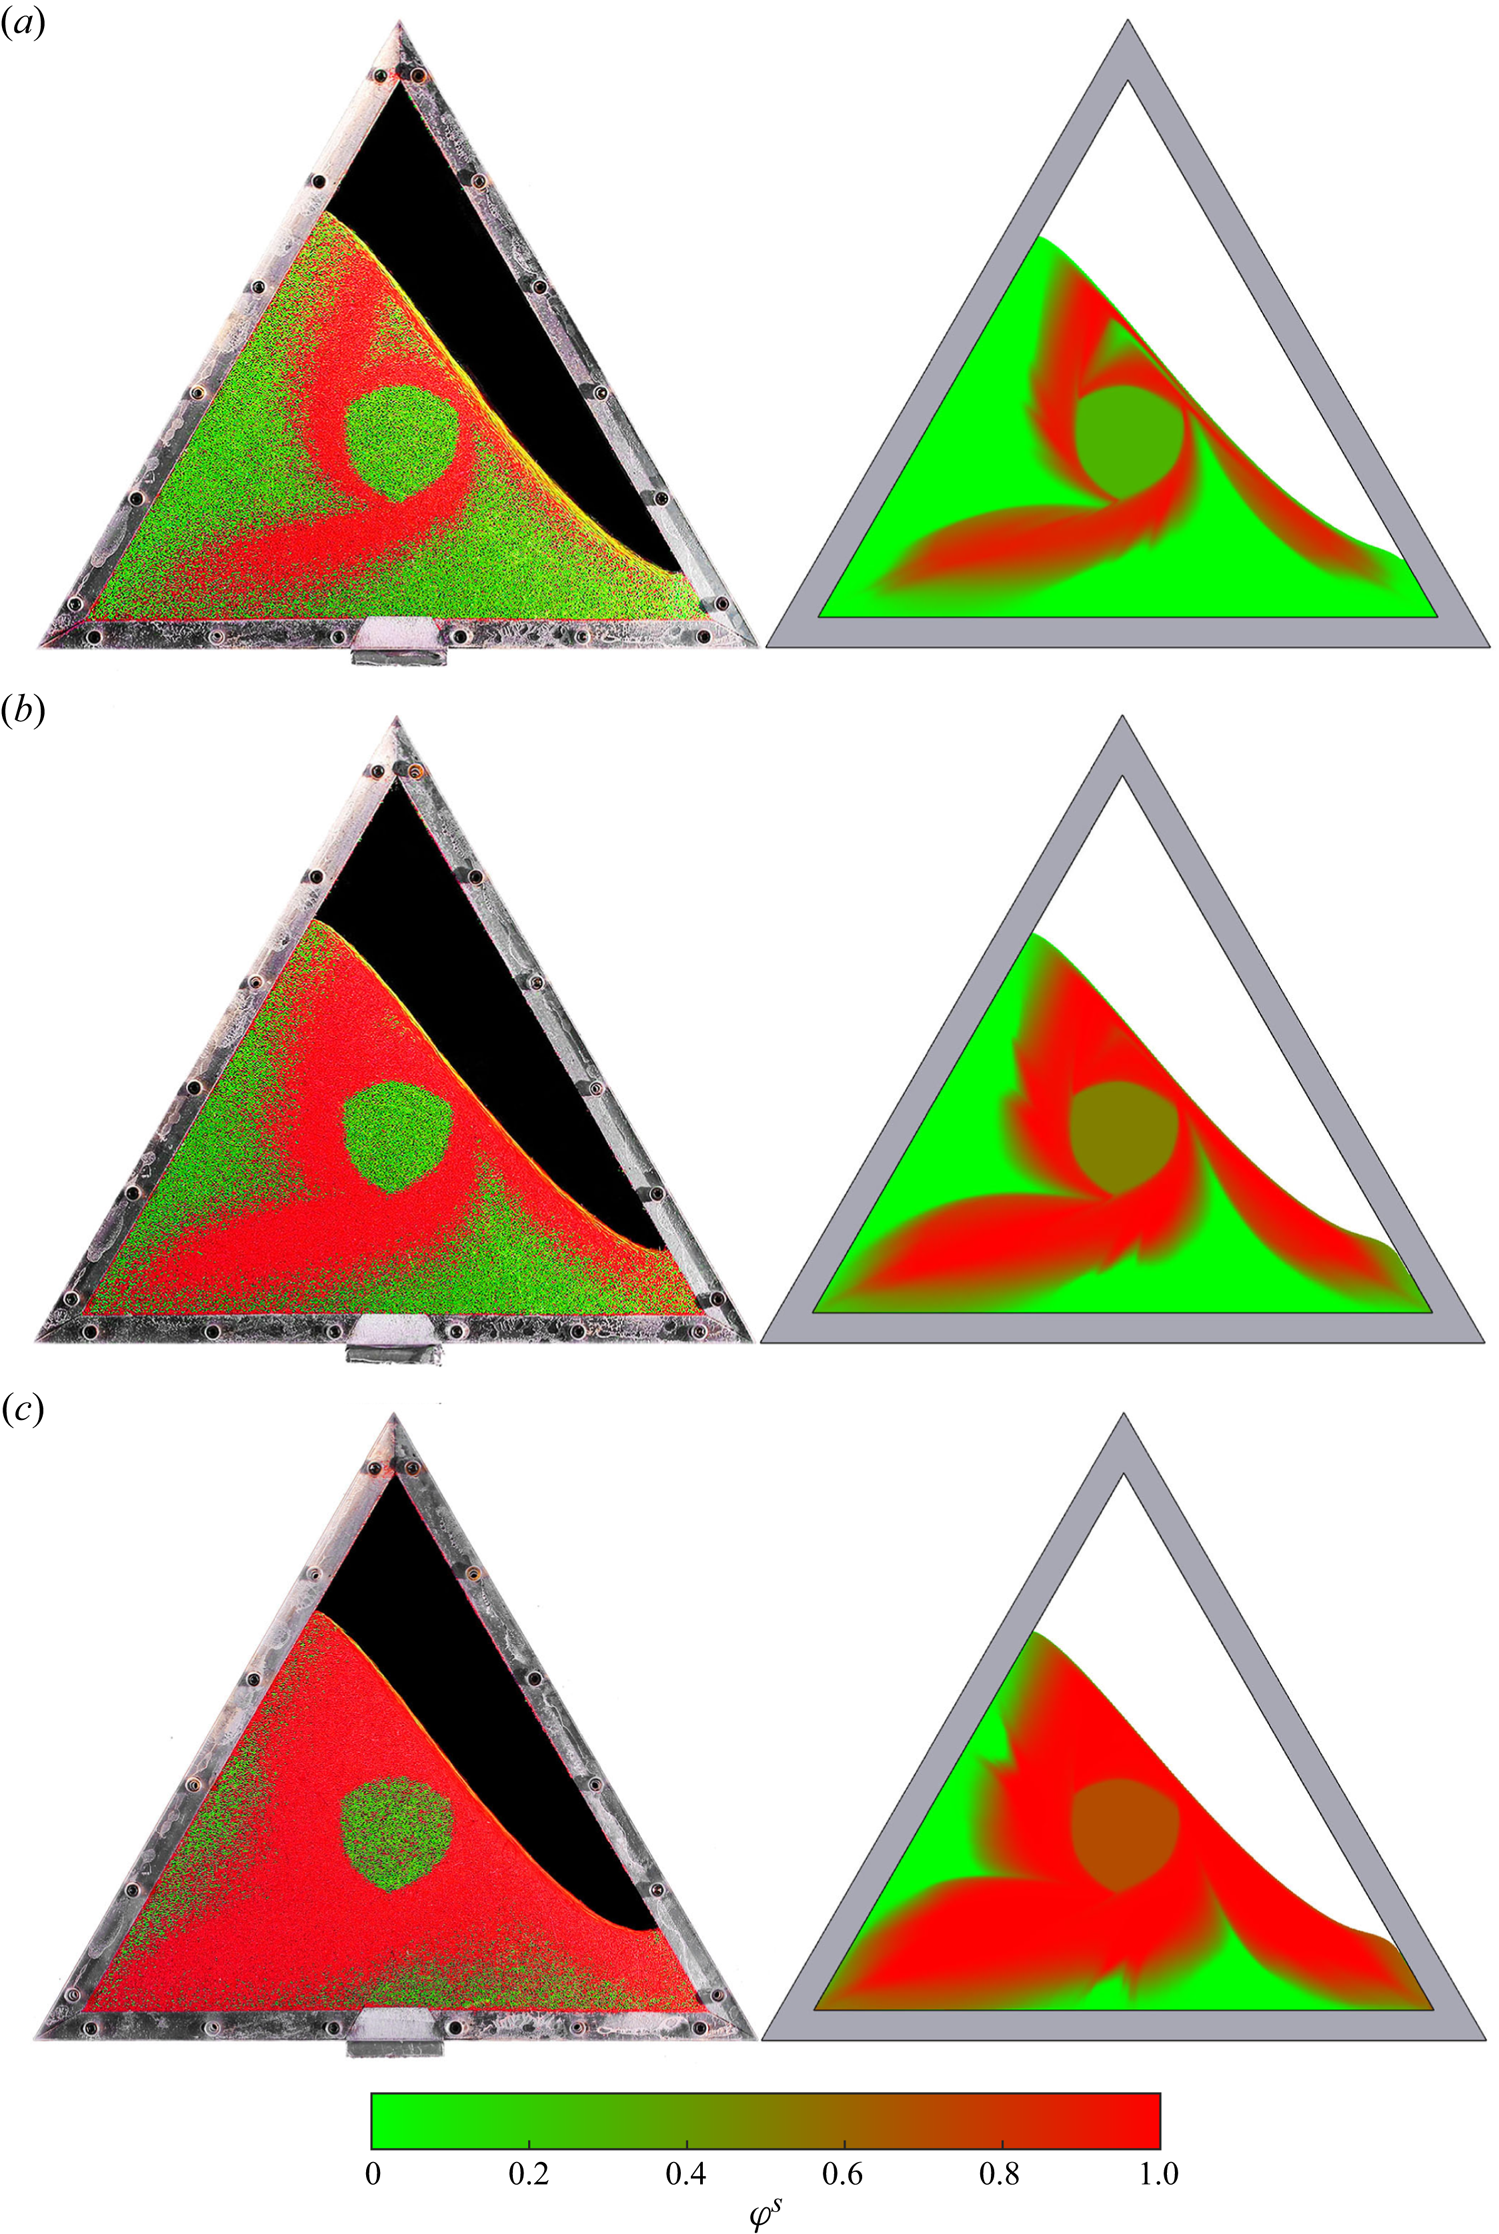
Figure 12. Comparison of the experimental (left) and computed (right) patterns for the case of (a) 70:30, (b) 50:50 and (c) 30:70 mixes of large green and small red glass beads in a 70 % filled rotating drum. These cases are equivalently referred to as  $\bar \phi ^s=0.3$, 0.5 and 0.7 mixes. The pattern is shown after two revolutions at
  $t=48$ s. Supplementary movies 2, 6 and 15–18 show the full time-dependent evolution of the patterns.
Structurally the small-particle arms are similar for each of the three mixes, and develop over the same time scale. The particle species separate out into somewhat diffuse regions over the first revolution, and then over the second revolution form a clear triskelion structure of small-particle arms surrounding an undisturbed core. The different core colours in each of the numerical simulations represent the varying mean initial particle concentration. The small-particle lobes are longer and thicker when the small-particle content is higher, as one would expect. Furthermore, the flattened top that is nearly parallel to the adjacent drum wall can be seen very clearly in the computed solution in figure 12(c), while in figure 12(a) it is not obviously present at all. Because the small-particle arms are very thin when  $\bar \varphi ^s=0.3$, the inner triangular region of high large-particle concentration, enclosed by the core and partially entrained arm, can be seen more clearly than in the other cases. Generally, the computed patterns and free-surface inclination angles are in very good agreement with the experiments, although the computed solution for
  $\bar \varphi ^s=0.7$ appears sharper than in the experiment.
The segregation scaling law (2.20) predicts that the segregation will be stronger in the highly sheared large-particle rich regions close to the avalanche surface, than in the less strongly sheared small-particle rich regions close to the avalanche base. These particle-size distributions are then preserved in the slowly rotating deposit. This is a real effect that can be seen in the experimentally derived concentration data in figure 6 in § 4.5. It is also reflected in the simulations in figure 4. Varying the initial mean particle concentration provides another perspective from which to consider this phenomenon.
Figure 13(a) shows the segregation intensities at  $t=48$ s for the experiments and simulations with
  $\bar \varphi ^s=0.3$, 0.5 and 0.7, as well as for two further extreme cases with
  $\bar \varphi ^s=0.1$ and
  $\bar \varphi ^s=0.9$. As the mean small-particle concentration increases, the mean particle size decreases, and one might reasonably expect from the scaling law (2.20) that this induces weaker overall segregation. However, the observed behaviour is significantly more complex than this. Instead, the segregation intensity initially increases with the mean small-particle concentration, up to a maximal value at
  $\bar \varphi ^s=0.5$, before it decreases for
  $\bar \varphi ^s=0.7$ and 0.9. The segregation intensities derived from the simulation data also match closely with the experiments, confirming this general trend. The agreement between the simulations and experiments when
  $\bar \varphi ^s=0.1$ and 0.3 suggests that the value
  $\phi ^s_c=0.2$, which determines the point below which the segregation velocity magnitude transitions to a quadratic dependence on the grain-size ratio, is accurate. The intensity is weaker for
  $\bar \varphi ^s=0.9$ than
  $\bar \varphi ^s=0.1$, as predicted based on the respective large-particle concentrations, but conversely is stronger for
  $\bar \varphi ^s=0.7$ than
  $\bar \varphi ^s=0.3$. To discern the reasons for these seemingly counter-intuitive results, it is necessary to look beyond the functional dependence of the segregation scaling law and consider the more intricate nature of segregation-mobility feedback interactions.
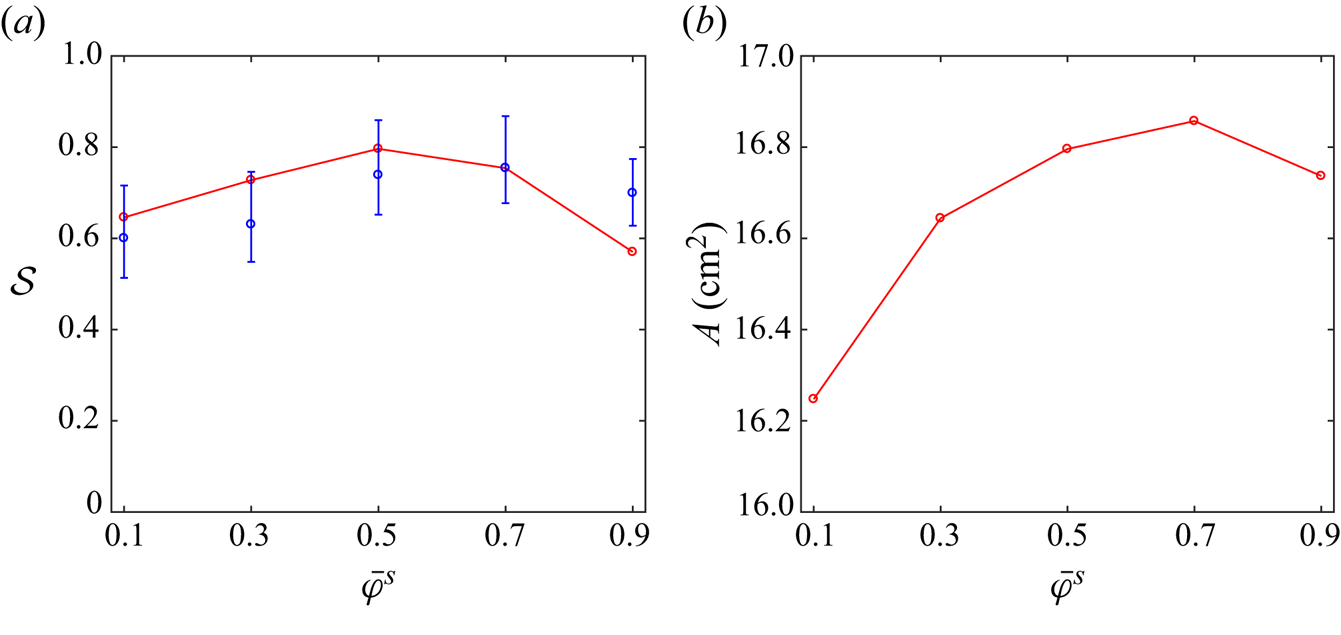
Figure 13. Variation of (a) the segregation intensity,  $\mathcal {S}$, and (b) the total area of the homogeneous central core,
  $A$, as a function of the mean small-particle concentration
  $\bar \varphi ^s=0.1$, 0.3, 0.5, 0.7 and 0.9, at
  $t=48$ s. The segregation intensity is plotted for the numerical simulations (solid red circles and lines) and experiments (blue circles). The mixture with
  $\bar \varphi ^s=0.5$ segregates most strongly. The area of the homogeneous central core is plotted for the numerical simulations, and is generally smaller for flows with a higher mean concentration of large particles, due to their increased friction and deeper erosion (Hill et al. Reference Hill, Khakhar, Gilchrist, McCarthy and Ottino1999; Barker et al. Reference Barker, Rauter, Maguire, Johnson and Gray2021).
Hill et al. (Reference Hill, Khakhar, Gilchrist, McCarthy and Ottino1999) performed experiments for different rotating drum geometries and observed that the avalanching layer was slower and deeper for flows with larger particles. This effect is captured by Barker et al. (Reference Barker, Rauter, Maguire, Johnson and Gray2021) fully coupled framework used here, since the effective friction  $\mu (I)$, defined in (2.7), is monotonically increasing in the inertial number
  $I$, which itself depends linearly on the average particle size
  $\bar d$, through (2.16). This means that (all other things being equal) larger particles are more frictional than smaller particles. In rotating drums the mass flux in the avalanche is imposed by the rotation of the drum, so when the surface avalanche is rich in slower-moving large particles, it becomes deeper. As a result, the homogeneously mixed central core becomes smaller with increasing large-particle composition as shown in figure 13(b). However, the frictional feedback is even more subtle than one might at first anticipate. As the mean small-particle concentration is decreased, the friction of the mixture increases, which in turn steepens the slope inclination and, hence, allows the more frictional mixture to attain higher velocities. This can be seen in figure 14, which shows the relative velocity magnitude as a function of
  $z$. The differences in the composition-dependent velocities are therefore not as big as one would have anticipated based on simulations on a fixed slope (Barker et al. Reference Barker, Rauter, Maguire, Johnson and Gray2021), but there is a very clear offset in position due to the increased slope inclination.
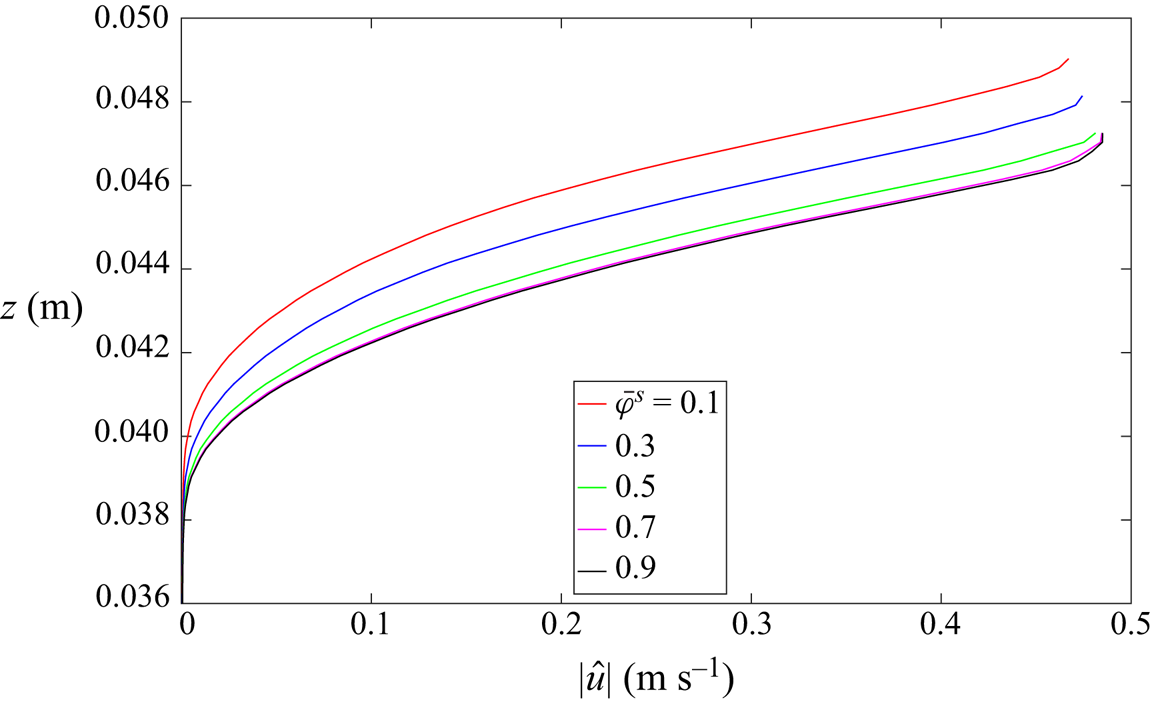
Figure 14. Magnitude of the relative velocity field (4.2) as a function of depth for 70 % filled rotating drums with different mean particle concentrations  $\bar \varphi ^s$. The profiles are measured at the centre of the avalanche at
  $t=48$ s, and cutoff at the free surface, identified by drawing the contour for
  $\varphi ^a = 0$. The vertical offset of the plots is due to the increased slope inclination as
  $\bar \varphi ^s$ is decreased.
Although the variations in the segregation intensity in figure 13(a) are modest, the reduced value of  $\mathcal {S}$ at low
  $\bar \varphi ^s$ may therefore be attributed to the reduced shear rate and deeper surface flows in the segregation scaling law (2.20). Conversely, at high values of
  $\bar \varphi ^s$ the reduced segregation rate can be attributed to the linear dependence of (2.20) on the average particle size
  $\bar d$. As a result, there is a point, at approximately
  $\bar \varphi ^s=0.5$, where the segregation intensity
  $\mathcal {S}$ is maximum. It is worth noting that the feedback effects of the bulk dynamics on the segregation intensity, the area of the homogeneous core and the slope inclination would not be predicted by a segregation model that used the same prescribed velocity and pressure fields in all the simulations. At 70 % fill these effects are relatively small, however, there is no guarantee that they would not be more significant at other fill levels. In particular, the results of Zuriguel et al. (Reference Zuriguel, Gray, Peixinho and Mullin2006) in a circular drum suggest that the system may be highly sensitive at 50 % fill.
8. Segregation in a tridisperse triangular rotating drum
In the experiment shown in figure 1, a tridisperse mixture of large green ( $d^l = 600\unicode{x2013}800$
  $\mathrm {\mu }$m), medium white (
 $d^m = 400\unicode{x2013}500$
  $\mathrm {\mu }$m) and small red (
 $d^s = 120\unicode{x2013}180$
  $\mathrm {\mu }$m) particles is used to generate the pattern in a 70 % filled drum with a 30:40:30 mix. At the rotation rate of
  $\varOmega =-{\rm \pi} /12$ rad s
 $^{-1}$, used in the experiments and simulations in § 4–7, the medium grains do not segregate into clearly discernable regions. The rotation rate is therefore reduced to
  $\varOmega =-{\rm \pi} /48$ rad s
 $^{-1}$ (0.625 rpm), as medium-particle rich regions form at this speed. The reason for this is that the reduced rotation rate makes the avalanche thinner, which increases the Péclet number for segregation,
  ${\textit {Pe}}_{\nu \lambda } = f_{\nu \lambda }/D_{\nu \lambda }$, due to the reduced pressure in the segregation scaling law (2.20). Increasing the Péclet number is equivalent to strengthening the segregation, as it compares the relative strength of the segregation to the diffusion. The full time-dependent experimental evolution of the pattern is available in supplementary movie 1.
The theory in § 2 is sufficiently general to model this case using the same parameters as in tables 1 and 2, and with the mean diameters specified in table 3. The numerical method in OpenFOAM is implemented for an arbitrary multi-component mixture and, hence, requires only the specification of an additional granular phase. Rather than describing the full set of advection–segregation–diffusion equations, which are analogous to the system of equations (3.4)–(3.7), for brevity, only the segregation and diffusive fluxes will be specified. For large, medium and small granular phases and an excess air phase, denoted by the constituent letters  $l$,
$l$,  $m$,
$m$,  $s$ and
  $a$, respectively, the segregation fluxes are
 $$\begin{gather} \boldsymbol{F}^l = ({-}f_{ls}\varphi^l\varphi^s - f_{lm}\varphi^l\varphi^m + f_{ag}\varphi^l\varphi^a) \frac{\boldsymbol{g}}{|\boldsymbol{g}|}, \end{gather}$$
 $$\begin{gather}\boldsymbol{F}^m = ({-}f_{ms}\varphi^m\varphi^s + f_{ml}\varphi^m\varphi^l + f_{ag}\varphi^m\varphi^a) \frac{\boldsymbol{g}}{|\boldsymbol{g}|}, \end{gather}$$
 $$\begin{gather}\boldsymbol{F}^s = (f_{sm}\varphi^s\varphi^m + f_{sl}\varphi^s\varphi^l + f_{ag}\varphi^s\varphi^a) \frac{\boldsymbol{g}}{|\boldsymbol{g}|}, \end{gather}$$
 $$\begin{gather}\boldsymbol{F}^a ={-}f_{ag}\varphi^a\varphi^g \frac{\boldsymbol{g}}{|\boldsymbol{g}|}, \end{gather}$$
and the diffusive fluxes are
 $$\begin{gather} \boldsymbol{\mathcal{D}}^{l} = \mathcal{D}_{ls}( \varphi^s\boldsymbol{\nabla}\varphi^l-\varphi^l\boldsymbol{\nabla}\varphi^s) + \mathcal{D}_{lm}( \varphi^m\boldsymbol{\nabla}\varphi^l-\varphi^l\boldsymbol{\nabla}\varphi^m), \end{gather}$$
 $$\begin{gather}\boldsymbol{\mathcal{D}}^{m} = \mathcal{D}_{ms}( \varphi^s\boldsymbol{\nabla}\varphi^m-\varphi^m\boldsymbol{\nabla}\varphi^s) + \mathcal{D}_{ml}( \varphi^l\boldsymbol{\nabla}\varphi^m-\varphi^m\boldsymbol{\nabla}\varphi^l), \end{gather}$$
 $$\begin{gather}\boldsymbol{\mathcal{D}}^{s} = \mathcal{D}_{sm}( \varphi^m\boldsymbol{\nabla}\varphi^s-\varphi^s\boldsymbol{\nabla}\varphi^m) + \mathcal{D}_{sl}( \varphi^l\boldsymbol{\nabla}\varphi^s-\varphi^s\boldsymbol{\nabla}\varphi^l), \end{gather}$$
 $$\begin{gather}\boldsymbol{\mathcal{D}}^{a} = \boldsymbol{0}, \end{gather}$$
where the overall concentration of grains is now
 \begin{equation} \varphi^g=\varphi^s+\varphi^m+\varphi^l=1-\varphi^a. \end{equation}
Table 3. Grain diameters for the small-, medium- and large-particle species used in the numerical simulations in § 8.
The simulation runs for two full revolutions, and the results from the experiment and numerical simulation are presented in figure 15. Supplementary movies 1 and 19 show the full time-dependent evolution of the pattern. The simulations show that at the slower rotation rate ( $\varOmega =-{\rm \pi} /48$ rad s
 $^{-1}$) the avalanche is indeed thinner, and hence, the central core is slightly larger than in the bidisperse simulations with
  $\varOmega =-{\rm \pi} /12$ rad s
 $^{-1}$. Initially, no region of predominantly medium sized particles is clearly discernible, although small- and large-particle rich regions begin to form quickly. This is because the medium sized particles are being simultaneously segregated in opposite directions by the other two species (8.2). In the second revolution, regions of predominantly medium particles form, and the numerical simulations correctly predict that they are strongest adjacent to the inner side of the small-particle arms, with weaker medium regions down the outer length. Overall, the simulations provide a very good qualitative match to the experimental particle-size distribution patterns, although the computed small- and medium-particle arms are larger and less pointed. The granular free surface is also slightly curved in the experiments, whereas it is almost flat in the simulations. The tridisperse simulations were the most computationally expensive in this paper, and required approximately 140 000 CPU hours to perform two drum revolutions using the highest resolution grid.
Figure 15. Comparison of the particle-size distribution in a 70 % filled triangular rotating drum containing a tridisperse mixture of large green (600–800  $\mathrm {\mu }$m), medium white (400–500
  $\mathrm {\mu }$m) and small red (125–160
  $\mathrm {\mu }$m) glass beads in a 30:40:30 mix. The experiment (left) and numerical simulation (right) are shown at (a)
  $t=64$ s, (b)
  $t=128$ s and (c)
  $t=192$ s. Each 64 s increment represents two thirds of a revolution. The numerical particle concentrations are represented by a three-way contour scale, where the phases go from
  $\varphi ^\nu =0$ to 1. The concentration of each phase at a specific point in the triangular scale is determined by projecting back onto the scale, parallel to the sides, as shown. The drums rotate over two full revolutions at a rotation rate of
  $\varOmega =-{\rm \pi} /48$ rad s
 $^{-1}$. Supplementary movies 1 and 19 show the full time-dependent development of the pattern in the experiment and simulation, and are available in the online supplementary material.
9. Conclusions and discussion
In this paper a continuum model based on the polydisperse fully coupled theory of Barker et al. (Reference Barker, Rauter, Maguire, Johnson and Gray2021) is used to compute the particle-size segregation patterns that form in a triangular rotating drum. The results are then compared with experiments performed in a narrow drum using bidisperse and tridisperse granular mixtures. The transparent confining sidewalls enable easy visualization of the resulting patterns, but also impose additional sidewall friction, which makes the flow thinner and faster than it would be in a wide drum (Hill et al. Reference Hill, Khakhar, Gilchrist, McCarthy and Ottino1999; Jop et al. Reference Jop, Forterre and Pouliquen2005). In order to quantitatively compare the experiments and simulations it is therefore necessary to width average the flow, so that the sidewall friction is represented by a single term in a two-dimensional momentum balance equation (2.28).
The bidisperse width-averaged model with wall friction reproduces the observed patterns across a wide range of drum fill fractions and small-particle concentrations, and quantitatively predicts how the segregation intensity evolves over time (see figures 2, 4, 7, 9, 11, 12, 13 and supplementary movies 2–7 and 9–18). In the absence of sidewall friction, the avalanche (in which segregation occurs) is predicted to be much slower and deeper, resulting in an under prediction of the segregation intensity by an order of magnitude (figure 8 and supplementary movie 8). This emphasises the critical importance of sidewall friction in modelling the flow and segregation here. The two-way coupling between flow and segregation also influences the segregation patterns. For example, an increased volume fraction of large particles results in a thicker, steeper surface avalanche (due to the particle-size dependence of the rheology), which in turn leads to weaker segregation (due to the shear rate and pressure dependence of the segregation rate). Segregation is also weakened by the addition of a third, intermediate, grain size, and it is necessary to rotate the drum slower in order to get clearly discernable regions that are rich in medium-size grains (figures 1 and 15, and supplementary movies 1 and 19).
The results presented here demonstrate the power of the coupling method developed by Barker et al. (Reference Barker, Rauter, Maguire, Johnson and Gray2021) and represent a strong validation of the partially regularized  $\mu (I)$ rheology and the segregation scaling law of Trewhela et al. (Reference Trewhela, Ancey and Gray2021). The original incompressible
  $\mu (I)$ rheology was derived from observations of steady-state DEM/DPM simulations and experiments on chutes and in circular rotating drums (Pouliquen & Forterre Reference Pouliquen and Forterre2002; GDR MiDi 2004; Jop et al. Reference Jop, Forterre and Pouliquen2005). Although it has been successfully applied to more complex geometries (Lacaze & Kerswell Reference Lacaze and Kerswell2009; Staron, Lagrée & Popinet Reference Staron, Lagrée and Popinet2014), it is perhaps surprising that the partially regularized theory (Barker & Gray Reference Barker and Gray2017) is able to predict the bulk flow dynamics in a highly transient triangular rotating drum with such accuracy. In the bidisperse simulations, both the avalanche depth and the free-surface shape and inclination in the experiments are reproduced very closely by this rheology. Furthermore, although the segregation scaling law of Trewhela et al. (Reference Trewhela, Ancey and Gray2021) was determined using data from refractive-index-matched oscillatory shear-box experiments with a single small- or large-particle intruder, the results presented here are only the latest successful application of this law to more complex geometries with less extreme particle concentrations (Barker et al. Reference Barker, Rauter, Maguire, Johnson and Gray2021; Trewhela et al. Reference Trewhela, Ancey and Gray2021). These results therefore suggest that the fully coupled theory used here provides a sufficient approximation of the real physics for accurate modelling of polydisperse rotating drums in the continuously avalanching or rolling regime (Rajchenbach Reference Rajchenbach1990) in general. This therefore represents a major breakthrough for continuum modelling of granular flow in rotating drums. This could prove extremely useful in industrial settings where, for example, mixers fitted with segregation-inhibiting baffles (McCarthy Reference McCarthy2009) could be tested numerically using continuum simulations before prototypes are produced.
Supplementary movies
Supplementary movies are available at https://doi.org/10.1017/jfm.2023.1022.
Funding
J.M.N.T.G. was supported by a Royal Society Wolfson Research Merit Award (WM150058) and an EPSRC Established Career Fellowship (EP/M022447/1). Additional support was provided by NERC grants NE/X00029X/1 and NE/X013936/1. All research data supporting this publication are directly available within this publication.
Declaration of interests
The authors report no conflict of interest.
Appendix A. Shear cell with sidewall friction
Consider a semi-infinite monodisperse body of grains, in a Cartesian coordinate system  $Oxz$, enclosed between confining sidewalls and driven by a top plate moving with velocity
  $(V_0,0)$ at
  $z=0$. The granular material therefore occupies the region
  $z\le 0$. The top plate is assumed to drive a steadily shearing velocity of the form
  $\boldsymbol {u}=(u,0)$ in a gravity-free environment. The only non-zero component of the strain-rate tensor is
  $D_{xz}=(1/2)\,\text {d} u/\text {d} z$, and hence,
  $\|\boldsymbol {D}\|=(1/2)|\text {d} u/\text {d} z|$. The
  $z$ momentum balance implies that the pressure is equal to a constant. For incompressible models, it is necessary to specify the pressure
  $p=p_0$ imposed by the top plate, which then applies throughout the granular material. Since
 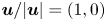 $\boldsymbol {u}/|\boldsymbol {u}|=(1,0)$, the
  $x$ momentum balance then reduces to
 \begin{equation} \frac{\partial \mu}{\partial z} = \frac{2}{W}\mu_W, \end{equation}
where  $W$ is the channel width and
  $\mu _W$ is the sidewall friction. Using the chain rule and the definition of the inertial number (2.5), this can be transformed into an ordinary differential equation (ODE) for the velocity,
 \begin{equation} \frac{\text{d}^2 u}{\text{d} z^2} = \frac{1}{\mu '(I)}\frac{2\mu_W}{W d}\sqrt{\frac{p_0}{\rho_*}}, \end{equation}
where  $d$ is the grain diameter,
  $\rho _*$ is the intrinsic grain density and
  $\mu '(I)$ is the derivative of
  $\mu$ with respect to
  $I$. It is possible to obtain an exact solution by invoking the
  $\mu (I)$ curve (2.6) of Jop et al. (Reference Jop, Forterre and Pouliquen2005). In this case
  $\mu$ can be differentiated to give
 \begin{equation} \mu'(I)=\frac{(\mu_d-\mu_s)I_0}{(I_0+I)^2}, \end{equation}
and so after again using the definition of the inertial number (2.5), (A2) becomes the second-order nonlinear ODE
 \begin{equation} \frac{\text{d}^2 u}{\text{d} z^2} = \beta\left(1 + \gamma\frac{\text{d}u}{\text{d}z}\right)^2, \end{equation}
where  $\beta$ and
  $\gamma$ are the constants
 \begin{equation} \beta=\frac{2\mu_W}{Wd}\left(\frac{I_0}{\mu_d-\mu_s}\right)\sqrt{\frac{p_0}{\rho_*}} \quad \text{and} \quad \gamma=\frac{d}{I_0}\sqrt{\frac{\rho_*}{p_0}}. \end{equation}
It is assumed that the material yields within a finite depth region, and therefore, that the velocity is identically zero below a certain depth. Solving (A4) subject to the boundary conditions that  $u=0$ and
  $\text {d}u/\text {d}z=0$ at some (as yet) unknown depth
  $z=-h$ implies that
 \begin{equation} u(z) = \frac{- \log(1-\beta\gamma(z + h))}{\beta\gamma^2} - \frac{z + h}{\gamma}. \end{equation}
The depth  $h$ can be located exactly using the boundary condition
  $u=V_0$ at
  $z=0$, implying
 \begin{equation} \log(1-\beta\gamma h) + \beta\gamma h ={-} \beta\gamma^2V_0. \end{equation}
This has a solution in the form of a Lambert  $\mathcal {W}$ function, and the flow depth is therefore
 \begin{equation} h = \frac{\mathcal{W}({\rm e}^{-\beta\gamma^2V_0 - 1}) + 1}{\beta\gamma}. \end{equation}
A numerical solution is computed in OpenFOAM assuming a no-slip boundary condition at the base of the domain and periodic conditions on the left and right boundaries. The sidewall friction causes the velocity to rapidly decay to zero below the driving top plate, as shown in figure 16. Both the numerical and exact solutions agree very closely. In particular, the numerical simulation is able to locate the avalanche depth very accurately regardless of the extent of the domain in the  $z$ direction, i.e. if the domain extends below the position
  $z=-h$, the velocity
  $u$ will still reduce to approximately zero at the same position. Closely related solutions also occur in vertical chutes and pipes (Barker, Zhu & Sun Reference Barker, Zhu and Sun2022).
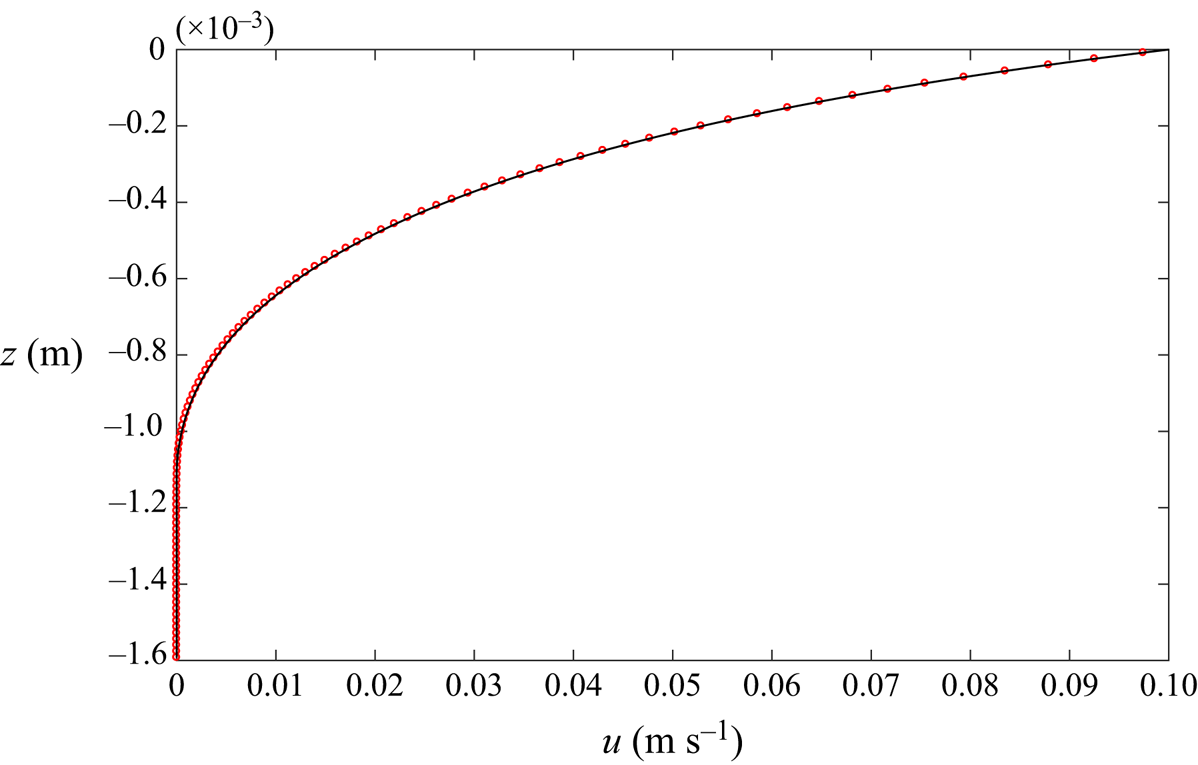
Figure 16. Comparison of the numerical solution computed in OpenFOAM by solving equations (3.1) and (3.2) (red open circles) to the exact solution (black curve) given by (A6). The solution is computed using the parameters defined in table 2, and assuming that the channel width  $W=3$ mm, the wall friction coefficient
  $\mu _W=\tan (15.5^\circ )$, the constant pressure
  $p_0=50$ N m
 $^{-2}$ and the top plate velocity
  $V_0=0.1$ m s
 $^{-1}$. In addition, a particle diameter of
  $d=d^s = 0.35\times 10^{-3}$ m was used.


 Open access