

1. Introduction
Under tension in aqueous solution with small or monatomic counterions, the DNA duplex stretches, unwinding if not topologically constrained, and eventually denatures. The extension against force shows a jump by a factor of ~1·5−1·7 (depending on sequence, pulling geometry and solution) at ~65–70 pN (Bosaeus et al. Reference Bosaeus, El-Sagheer, Brown, Smith, Åkerman, Bustamante and Nordén2012; Liu et al. Reference Liu, Bu, Song, Zhang, Li, Zhang, Shen and Li2010; Vlassakis et al. Reference Vlassakis, Williams, Hatch, Danilowicz, Coljee and Prentiss2008; Williams et al. Reference Williams, Rouzina and Bloomfield2002). Several models have been proposed to explain the sudden increase in length, which is widely agreed to be the signal of a collective structural transition. The formation of regions of single-stranded DNA (ssDNA) (Williams et al. Reference Williams, Wenner, Rouzina and Bloomfield2001) or of ladder-like stretched and untwisted double-stranded DNA (dsDNA) have been suggested (Bosaeus et al. Reference Bosaeus, Reymer, Beke-Somfai, Brown, Takahashi, Wittung-Stafshede, Rocha and Nordén2017; Cluzel et al. Reference Cluzel, Lebrun, Heller and Lavery1996; Konrad & Bolonick, Reference Konrad and Bolonick1996; Lebrun & Lavery, Reference Lebrun and Lavery1996; Smith et al. Reference Smith, Cui and Bustamente1996). Although the structural details and degree of order are not clear or universally agreed in the literature, in general at modest extensions of long sequences not dominated by AT base pairs, we expect to see a clear two-state transition to a partly untwisted ladder-like structure, in which the base pairs remain intact but the average rise per base pair is equilibrated to a new value of ~5·8 Å, compared to the rise in unstretched B-DNA of 3·4 Å.
The stretched phase or phases are known by the umbrella label of ‘S-DNA’. For GC-rich structures having strong hydrogen bonding, the base pairing is preserved in the putative S-DNA structure, and the base stacking may also be somewhat preserved by tilting and sliding of the base pairs or by opening of ‘bubbles’ between base pairs (Konrad & Bolonick, Reference Konrad and Bolonick1996). Reorientation of the base pairs may increase the solvent-exposed area by changing the groove width while permitting them to remain in contact such that a complete water gap does not open between them (Roe & Chaka, Reference Roe and Chaka2009). The detailed S-DNA structure, particularly the inclination, depends on the pulling scheme. Experimental results of Albrecht et al. show that the differences in behaviour of DNA when using different pulling schemes can depend on the loading rate, with stretching forces propagating first at high pulling rates, but shearing becoming dominant at slower pulling rates (Albrecht et al. Reference Albrecht, Neuert, Lugmaier and Gaub2008). Others have also shown that there are structural differences when using different pulling mechanisms (Bag et al. Reference Bag, Mogurampelly, Goddard and Maiti2016; Danilowicz et al. Reference Danilowicz, Limouse, Hatch, Conover, Coljee, Kleckner and Prentiss2009; Roe & Chaka, Reference Roe and Chaka2009).
The most readily available information on DNA under tension is the empirically measured force-extension curve (Rief et al. Reference Rief, Clausen-Schaumann and Gaub1999; Smith et al. Reference Smith, Finzi and Bustamante1992), which provides the clear signal of some transition, but no atomistic-level information. This is supplemented by fluorescence and polarised-light studies (van Mameren et al. Reference Van Mameren, Gross, Farge, Hooijman, Modesti, Falkenberg, Wuite and Peterman2009; Nordén et al. Reference Nordén, Elvingson, Kubista, Sjöberg, Ryberg, Ryberg, Mortensen and Takahashi1992; King et al. Reference King, Gross, Bockelmann, Modesti, Wuite and Peterman2013), and by atomistic simulations which are able to provide explicit descriptions of the DNA but which are limited in the accessible timescales and system sizes (Bag et al. Reference Bag, Mogurampelly, Goddard and Maiti2016; Konrad & Bolonick., Reference Konrad and Bolonick1996; Lebrun & Lavery, Reference Lebrun and Lavery1996; Li & Gisler, Reference Li and Gisler2009; Roe & Chaka, Reference Roe and Chaka2009).
DNA is often subjected to tension in its biological context, for purposes including transport, transcription and tertiary structure manipulation (Nicklas, Reference Nicklas1988). A striking example of this is the crystal structure (pdb: 3cmt) of DNA bound to the RecA protein (Chen et al. Reference Chen, Yang and Pavletich2008), a snapshot of homologous DNA recombination in action. Homologous recombination using RecA is employed for DNA repair (Kuzminov, Reference Kuzminov1999), and via other recombinases is also the fundamental process of sexual reproduction, in which copies of similar genes are exchanged between DNA strands from either parent. In the RecA structure, the extended protein-bound DNA duplex does not adopt a recognised S-like configuration, but rather disproportionates into groups of three bases, with orderly planar base stacking retained within each triplet. This triplet disproportionation has been observed in solution when bound to RecA (Nordén et al. Reference Nordén, Elvingson, Kubista, Sjöberg, Ryberg, Ryberg, Mortensen and Takahashi1992), in crystallographic structures of the RecA–DNA complex (Chen et al. Reference Chen, Yang and Pavletich2008) and also has been suggested as a stable phase even without co-factors (Bosaeus et al. Reference Bosaeus, Reymer, Beke-Somfai, Brown, Takahashi, Wittung-Stafshede, Rocha and Nordén2017). Simple energy minimisation (without thermal fluctuations or any explicit solvent) of d[GCG]4 DNA under constraints of a 1·5 relative extension and also of imposed helical symmetry with unit cell 3 bp yields a structure partitioned into triplets of three stacked base pairs separated by a stack-breaking gap of approximately one base-pair thickness (Bertucat et al. Reference Bertucat, Lavery and Prévost1998). The early minimisation calculation shows that a period 3 or ‘triplet’ structure is physically plausible when considered purely in static chemical terms, although it has not since been experimentally or computationally observed in solution. We note that the term ‘triplet’ here refers to a duplex of length three bases (perhaps more properly a ‘triad’), and not to a triplex of three strands.
Orderly triplet formation when complexed is in contrast to current general understanding of the structural behaviour when extended in solution, which leads us to examine whether the triplet phase can be stabilised in solution and if it could in this case be considered a canonical biologically active structure of DNA on the same footing as the A, B and Z forms. Using molecular dynamics simulations of duplex DNA with an applied force, we do not observe stable triplet structure in an aqueous solution of monatomic counterions, but do find that it is stable without specific complex to a structured enzyme, forming triplets in a solution either of terminus capped monomeric arginine peptides (Ac-Arg+-NHMe Cl−) or (more weakly) of the well-known intercalant ethidium bromide (Et+Br−).
The presence of intercalators has been observed to drive significant alterations in the quasiequilibrium force versus extension curve, with an effect at high concentrations of smoothing over the B to S transition and possibly of modifying the structure of the S phase (Vladescu et al. Reference Vladescu, Mccauley, Nuñez, Rouzina and Williams2007). By carrying out simulated stretching experiments in the presence of DNA-binding cofactors, we intend to reduce the barrier and collectivity associated with the B–S transition, thus increasing the likelihood that the sub-microsecond simulation timescale can describe the typical laboratory-scale (milliseconds) process, and also to investigate the structural role of biologically relevant moieties (Arg) in relation to DNA under tension.
We discuss planar-stacked triplet disproportionated DNA as a solution phase of the double helix under tension, and refer to it as ‘Σ DNA’, with the three right-facing points of the Σ character serving as a mnemonic for the three grouped base pairs. In the same way as for unstretched Watson–Crick base-paired DNA structures, we remark that the structure of the Σ phase is linked to function: the partitioning of bases into codons of three base pairs each is the first phase of operation of recombinase enzymes such as RecA, facilitating alignment of homologous or near-homologous sequences. By showing that this process does not require any very sophisticated manipulation of the DNA, we position it as potentially appearing as an early step in the development of life, and correlate the postulated sequence of incorporation of amino acids (phase 0 or ‘the GADV world’ (Ikehara et al. Reference Ikehara, Omori, Arai and Hirose2002), phase 1 or ‘GADVESPLIT’ (Koonin & Novozhilov, Reference Koonin and Novozhilov2009; Wong, Reference Wong1975, Reference Wong2005), then the remaining amino acids, CMFYHRKNQ), into molecular biology with the ease of Σ-formation for sequences including the associated codons. We also note that the machinery of nucleotide to peptide translation occurs necessarily with reference to triplets of bases, so that further investigation into the Σ phase of single and double strands of RNA and DNA might be a valuable source of insight into the origins not only of recombination, but also of gene expression.
2. Methods
2.1 Triplet propensity calculation
To calculate the triplet propensity, we proceed from datasets giving base-pair step formation energies via a brute force Monte Carlo approach. Initially, a random sequence of 60 amino acids is drawn with equal probability for each of the ‘phase 1’ amino acids. A DNA duplex is then defined by randomly drawing a codon for each amino acid (based on those codons available in the modern ‘universal’ genetic code). In order to have equal sequence content in both strands, the initial sequence is then concatenated with its complement, generating a palindromic test DNA sequence of 360 bp. Defects are then inserted at random into the sequence such that ⅓ of base steps are broken, and allowed to equilibrate their positions for 150 MC steps per defect present, where an MC step is a defect repositioning attempt via Metropolis Monte Carlo at 300 K. This long sequence then serves as a ‘reservoir’ of stack breaks: in order to find the triplet propensity for a given test codon, it and its complement are inserted into the reservoir duplex and re-equilibrated for a further 30 steps/defect before collecting statistics for the distribution of stack breaks. The triplet propensity ΔG τ is stated simply as a negative log probability for breaks to form at each end of the test codon but not inside it. The calculation was repeated (with re-drawing of the reservoir sequences) until convergence, which was validated by comparing redundant codons: the ΔG τ for all pairs such as GGA·TCC and TCC·GGA was verified to differ at worst in the third significant figure. The short script used for the calculation is included as Supplementary software.
2.2 Atomistic simulation protocols
Molecular structures were prepared using the Nucleic Acid Builder (NAB) (Macke & Case, Reference Macke, Case, Leontes and Santalucia1998). Salt was represented using the Joung–Cheatham parameters for ions (Joung & Cheatham, Reference Joung and Cheatham2008) and TIP3P model of water was used for solvation (Jorgensen et al. Reference Jorgensen, Chandrasekhar, Madura, Impey and Klein1983). The ethidium molecule was represented using the GAFF (Wang et al. Reference Wang, Wolf, Caldwell, Kollman and Case2004) with partial charges and bond parameters assigned via the ANTECHAMBER tool (Wang et al. Reference Wang, Wang, Kollman and Case2006). Simulations were run using the GPU-accelerated implementation of pmemd (Salomon-Ferrer et al. Reference Salomon-ferrer, Götz, Poole, Le Grand and Walker2013) in the AMBER16 package (Case et al. Reference Case, Betz, Cerutti, Cheatham, Darden, Duke, Giese, Gohlke, Goetz, Homeyer, Izadi, Janowski, Kaus, Kovalenko, Lee, Legrand, Li, Lin, Luchko, Luo, Madej, Mermelstein, Merz, Monard, Nguyen, Nguyen, Omelyan, Onufriev, Roe, Roitberg, Sagui, Simmerling, Botello-Smith, Swails, Walker, Wang, Wolf, Wu, Xiao and Kollman2016) using the AMBER 99SB+bsc0 force field parameters for the biomolecules (Hornak et al. Reference Hornak, Abel, Okur, Strockbine, Roitberg and Simmerling2006; Pérez et al. Reference Pérez, Marchán, Svozil, Sponer, Cheatham, Laughton and Orozco2007). Generated DNA fragments were simulated in a rectangular periodic box with 10 Å distance from the DNA to the box boundaries. Sodium and chloride ions were added so as to give an electrically neutral system with approximately physiological Cl− concentration (order 0·1 M) (Table 1). The SHAKE algorithm (Ryckaert et al. Reference Ryckaert, Ciccotti and Berendsen1977) was used to constrain all bonds involving hydrogen atoms. To calculate electrostatic interactions, the particle mesh Ewald sum was employed with a 2 fs time step (Darden et al. Reference Darden, York and Pedersen1993). The direct part of the Lennard–Jones interactions was cut off at 8 Å.
Table 1. Details of the atomistic simulations

Sixteen instances of 150 ns were run for each system, giving a cumulative simulation time of 14·4 µs. Effective concentration of 88 intercalants in 9 k water molecules is ~0·5 M. 70 and 24 Na+ ions in a box size of approximately 40 × 40 × 210 Å corresponds to a concentration of ~0·33 and ~0·1 M respectively.
EtBr and arginine intercalators were initialised in the bulk solvent rather than being manually inserted between base pairs: this approach is likely to underestimate the amount of intercalator bound at a given extension, but has the advantage that no bias is introduced with respect to the binding site or pose. The simulation trajectories were collected at a rate of one frame per 2 ps.
For each calculation, 16 independent instances were prepared and equilibrated in the B conformation for 10 ns. Pulling of the DNA then took place using steered molecular dynamics, for 16 instances of six different systems, over a time period of 150 ns (giving a pulling rate of 0·068 nm ns−1). Due to the slow kinetics of intercalator dissociation in unstretched DNA, which for typical mono-intercalators is of the order of one per second (Biebricher et al. Reference Biebricher, Heller, Roijmans, Hoekstra, Peterman and Wuite2015), binding of intercalators was essentially irreversible in silico except via extensionally driven conformational change. The choice to make multiple 150 ns simulations rather than fewer multi-microsecond runs was a decision to pursue good stochastic sampling of an explicitly non-equilibrium process, rather than attempting the computationally very challenging goal of equilibrium-like sampling, which is not achieved even on the laboratory timescale of <1 s per cycle of extension and relaxation.
DNA was pulled using force applied to the centres of geometry of the top and bottom base pairs, such that no topological restraint was applied and force was distributed equally between 3′ and 5′ strand ends. The choice to spread the applied force was made based on an assumption that the distribution of applied force in an early biological context was likely to be relatively smooth (e.g. via hydrodynamic combing or weakly specific binding of cofactors) rather than limited to two specific atoms.
Averaging of angles (for study of DNA structural parameters) was carried out by taking the mean cosine and sine, then the arctangent of the mean values. Structures were analysed using CURVES+ (Lavery et al. Reference Lavery, Moakher, Maddocks, Petkeviciute and Zakrzewska2009).
In order to present a dimensionless relative extension, the unstretched contour length per bp was estimated over 24 bp as 3·46 Å (Arg Cl), 3·43 Å (EtBr) and 3·43 Å (NaCl) for the G12C12·G12C12 sequence and 3·57 Å (Arg Cl), 3·41 Å (EtBr) and 3·38 Å (NaCl) for the [GGC]4[GAC]4 · [GTC]4[GCC]4 sequence.
2.3 Base-pair step classification
Base-pair steps were classified according to the following rules (see Fig. 5, e.g structures):
-
• β: (‘Base-paired and stacked’): one or more Watson–Crick hydrogen bonds were preserved for each pair in the step, with rise <5·6 Å.
-
• ζ: (‘Zipper’): one or more hydrogen bonds were present between each base and the backbone of the opposite strand.
-
• σ: (‘Space’): one or more WC hydrogen bonds were preserved for each pair in the step, rise was ⩾5·6 Å, and at least one of the two vertical pairs of bases was completely separated, with no contact ⩽3·5 Å.
-
• τ: (‘Tilted’): one or more WC hydrogen bonds were preserved for each pair in the step, rise was ⩾5·6 Å, but one or more atomic contacts remained for each vertical pair of bases.
-
• μ: (‘Melted or mismatched’): WC hydrogen bonding to the opposite base was disrupted, and not replaced with zipper hydrogen bonding.
Hydrogen bonds were defined for triangles donor-H-acceptor such that the angle at H was >135° and the distance donor–acceptor was <3 Å (cpptraj defaults) (Roe & Cheatham, Reference Roe and Cheatham2013). The rise cutoff for stack breaking was made at 5·6 Å based on (Chen & García, Reference Chen and García2013). An atomic contact was defined as a distance <3·5 Å. Examples of each conformation are shown in Fig. 2. Averages were collected over steps [3…21] of the 23 steps available in the sequences studied, in order to minimise end effects.
3. Results
3.1 Sequence dependence of disproportionation
It is not clear what form the original genetic code had, as it is likely to have co-evolved to some extent with the associated enzymes of transcription and translation. We can make guesses about the history of the genetic code by considering the metabolic networks leading to the different amino acids: it is hypothesised that a list of so-called ‘phase 1’ amino acids were present earlier in evolution than the remaining ‘phase 2’ amino acids, based on the complexity of the cellular machinery used in current organisms to synthesise, for example, methionine (M) from threonine (T) (Koonin & Novozhilov, Reference Koonin and Novozhilov2009; Wong & Bronskill, Reference Wong and Bronskill1979). If the genetic code in the epoch of a much simplified amino-acid alphabet already had the current structure of three base pairs per codon (‘triplet code’) it was therefore highly redundant at this time.
In the current triplet code, the ‘phase 1’ amino acids supposed to have been incorporated earliest into biology (the list of GADVESPLIT) are coded by triplets which have a specific physical tendency: the energetic cost to break base stacking at the triplet boundary is low, relative to the complete modern genetic code. In this paper, we first motivate the statistical observation of preferential triplet disproportionation in the phase 1 genetic code. We then analyse atomistic simulation data to show that disproportionation into coding triplets occurs spontaneously under tension for appropriate sequences and solution conditions.
The weak form of our observation provides a physical mechanism to minimise read frame and recombination alignment errors in the early evolution of the genetic code. We further motivate this to make the stronger claim of a possible route for the origin of the triplet genetic code, with the three base-pair structure arising from simple physical conditions in the absence of the sophisticated enzymatic machinery which later evolved to maintain the triplet code in modern organisms with a full alphabet of amino acids.
3.2 Estimation of sequence-dependent triplet-forming propensity
The free energy of base stacking in duplex DNA was long ago calculated combinatorially for the various pairs of bases, by Friedman and Honig (Friedman & Honig, Reference Friedman and Honig1995). Stacking energies are directional (crucially, GC·GC is stronger than CG·CG), here when writing a sequence the direction 5′ → 3′ is assumed.
From the tabulated data (Friedman & Honig, Reference Friedman and Honig1995), if we approximate the stacking energy for complementary duplex DNA as the sum of the stacking energies for the two base steps, the weakest step is CG·CG (−10·14 kcal mol−1). We therefore hypothesise that a series of codons of the form GNC (where N means ‘anything’) should have the special property of partitioning naturally at the codon boundary C to G when under tension. We make a statistical analysis based on the stack-breaking free energies, to produce a measure of the propensity for a given codon, when embedded in a wider sequence, to partition extension to the codon boundaries.
To calculate the triplet propensity, we take a brute-force Monte Carlo approach, selecting a long sequence and allowing stack breaks to equilibrate according to a Boltzmann distribution, before sampling the probability for each codon to partition stack-break defects such that it has a stack break at each end but not inside it.
Tabulating this information for the 20 canonical amino acids (showing the triplet propensity for the most triplet-prone codon available to each amino acid), we can see a clear pattern of reduced triplet disproportionation energy for the primordial ‘stage 1’ amino acids (Table 2).
Table 2. Phase one amino acids (*,☥) tend to have (at least one) codon associated with them that partitions favourably at its boundaries
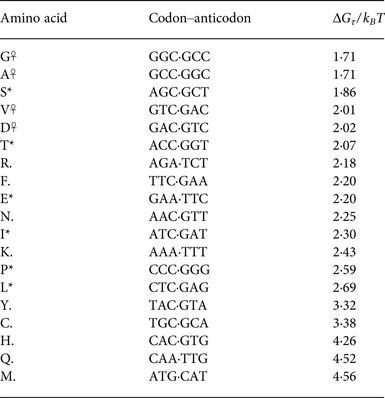
The most favourable partitioning is for the phase 0 (DAGV) amino acids (☥).
The dramatic pattern evident in the tabulated partitioning energies is that stage 1 amino acids overwhelmingly have relatively favourable free energies to partition into triplets aligned to their codons. The exception to this pattern is interesting: arginine (R) is not listed in Wong & Bronskill's (Reference Wong and Bronskill1979) tabulation of stage 1 amino acids (Wong & Bronskill, Reference Wong and Bronskill1979), possibly due to the large energetic cost needed to synthesise it from citrulline in modern organisms (Ratner & Petrack, Reference Ratner and Petrack1953).
It has been advanced the CGN and AGN codons which yield arginine in the modern genetic code previously coded for the chemically similar non-canonical amino acid ornithine (Jukes, Reference Jukes1973), and that the function of this codon was usurped in a presumably dramatic evolutionary event when selection advantage was found in having access to the more strongly basic arginine molecule. The original phase 1 list GADVESPLIT contains no basic amino acids at all making the addition of ornithine seem valuable in order to form a good range of folded proteins, and the replacement of ornithine with arginine a beneficial evolutionary step in giving access to a stronger base.
Arginine stands out for a second reason: the DNA-binding recombinase RecA achieves triplet disproportionation by cradling the negatively charged DNA in a large number of positively charged R side chains (and some K). Thus, we should perhaps not be surprised if a phase of biochemical evolution in which control of triplet disproportionation is important should have some means to produce either arginine or similar moderately bulky basic residues.
The weaker statement of this work, that the stage 1 part of the genetic code is structured so as to support a minimisation of read-frame errors by physically favouring the partition into aligned triplets under tension, is related to a known subtle and remarkable property of the genetic code. This property is that its redundancy is structured almost optimally so as to support overlapping codes orthogonal to the primary code specifying amino acids (Itzkovitz & Alon, Reference Itzkovitz and Alon2007), allowing the evolution of sequence changes altering DNA structure and interactions even within protein-coding regions, without changing the coded protein. The overall flexibility of the genetic code in allowing arbitrary steganographic codes is not however sufficient to explain the strong pattern which we observe: Table 3 shows that codons for phase 1 amino acids are significantly more able to encode this partitioning than those in phase 2. We further observe that the residues advanced by Ikehara et al. (Ikehara et al. Reference Ikehara, Omori, Arai and Hirose2002) as forming the minimal set for a functional proteome (marked ☥ in Table 3) are also those which partition most naturally into triplets.
Table 3. All codons, coloured by Gτ with a light colour indicating higher probability to disproportionate into triplets

The pattern purine-x-pyrimidine gives greatest triplet disproportionation, also having a (bulky) G or C base in the middle of the codon gives more favourable Σ formation. Because energies were found in the duplex form, complementary codons (e.g. GGC,GCC) necessarily have the same G τ . ☥, * indicates phase 1 amino acids, ☥ indicates phase 0. X indicates a stop codon.
We should note that the calculation of stacking energies by Friedman and Honig is a very elegant paper but is not the most recent attempt to measure this quantity. On the experimental side, Protozanova et al. have measured free energy of stacking for base-pair steps in a nicked DNA duplex (Protozanova et al. Reference Protozanova, Yakovchuk and Frank-kamenetskii2004). It is attractive to generalise these stacking-free energies for nicked DNA to the intact DNA double helix; however, NMR analyses have shown that the broken phosphodiester bond pushes the conformation away from canonical B-form (Pieters et al. Reference Pieters, Mans, Van Den Elst, Van Der Marel, Van Boom and Caltona1989; Roll et al. Reference Roll, Ketterlé, Faibis, Fazakerley and Boulard1998; Snowden-Ifft & Wemmer, Reference Snowden-Ifft and Wemmer1990) which leaves a question mark over the applicability of the data for our purposes. Protozanova et al. report values of −0·91 and −2·17 kcal mol−1 for CG·CG and GC·GC stacks, while further experimental results for association of completely free duplex ends by Kilchherr et al. report −2·06 and −3·42 kcal mol−1 (Kilchherr et al. Reference Kilchherr, Wachauf, Pelz, Rief, Zacharias and Dietz2016). Calculations by Lemkul and MacKerell (Lemkul & MacKerell, Reference Lemkul and MacKerell2017) make a more complex treatment of the base stacking interactions, arriving at values for the key CG·CG and GC·GC comparison of −7·59 versus −11·69 kcal mol−1. Overall then, while there is significant disagreement on the magnitude (and sometimes the ranking) of the 10 stacking energies for complementary base-pair steps, the key feature of a weak CG stack which points to the existence of a GNC triplet code is preserved. We include as Supplementary data repeated calculations of triplet formation-free energies with the Protozanova et al. and Lemkul and MacKerell datasets (Fig. S1). These Supplementary calculations show the same privileged status for the GADV and phase 1 amino acids as those based on the Honig dataset, although many details are different, and also in the Lemkul and MacKerrell calculation, the residue glycine loses its privileged triplet status almost entirely due to a very weak reported value for the GG·CC stack. We also include as a Supplementary software the python script used to carry out the triplet propensity calculation.
3.3 Spontaneous triplet disproportionation under tension, amplified in the presence of organic cations
Beyond the pairwise hydrophobic and electrostatic interactions of base stacking (covered by the classic calculation used to generate Tables 2 and 3) the potential importance of complex entropic, structural and solvent effects makes it necessary to carry out a full atomistic molecular dynamics investigation of DNA under tension. Given the expected importance of sequence effects, simulations were run both with a low-entropy sequence of d[G12C12] (encoding four glycines and four prolines) and a sequence chosen to show strong triplet disproportionation based on Table 2, [GGC]4[GAC]4·[GTC]4[GCC]4, encoding four repeats each of the high-scoring amino acids Gly and Asp on the first strand, then Val and Ala on the complementary strand (the GADV set of (Ikehara et al. Reference Ikehara, Omori, Arai and Hirose2002)). DNA duplexes were stretched by an additional 100 Å from their relaxed lengths, over a time period of 150 ns, giving a stretching rate of 0·029 Å ns−1 bp−1. Because of the apparent importance of arginine, based on Table 2 and on the RecA structure (Chen et al. Reference Chen, Yang and Pavletich2008), simulations were run both in NaCl and in a solution of Ac-Arg-NHMe Cl.
We find that for the GC-rich sequence encoding phase 1 amino acids, the triplet-disproportionated Σ conformation of DNA is observed, with the strongest triplet formation taking place in the presence of the terminus-capped arginine residues (Ac-Arg-NHMe). Figure 1 shows a regular pattern of vertical stripes (preferred base-pair step breaks) with period 3 bp, over a large range of extensions. The low-entropy sequence in the presence of arginine shows some weak structure at high extensions, due to exclusion effects which disfavour binding of cations to adjacent sites. In the high-entropy sequence, some structure of period 3 is seen, even in the absence of arginine; however, this is relatively weak (as suggested by the order 1 k B T free energies of disproportionation in Table 2).

Fig. 1. Kymographs of rise per bp-step under imposed whole-DNA extension. Triplet disproportionation is strongly evident in (b), while the strain is spread most evenly in (c). Presence of arginine in a homogeneous sequence (a) or presence of CG steps in the absence of arginine (d) induce only weakly structured disproportionation.
The triplet-disproportionated structures show the essential features of Σ-DNA (Fig. 2) as seen in the RecA-bound crystal structure: preserved Watson–Crick base pairing, approximately planar orientation of the bases (Fig. 3), and a large cavity every third base pair.

Fig. 2. The ‘primordial’ sequence partitions under tension predominantly at the CG steps, forming triplets (a), with Watson–Crick hydrogen bonding and planar base stacking preserved subject to some thermal disorder (a, b). Triplets are stabilised by one or two arginines (cyan) intercalating the stretched base steps (b, c) with non-specific binding that tends to place the charged end of the side chain close to the phosphate, and partially or entirely excludes water from between the bases; (c) is a zoomed and rotated view of the highlighted cavity in (b).

Fig. 3. Average inclination of the low- and high-entropy sequences in the presence and absence of intercalators (arginine and EtBr). Average inclination for the high-entropy sequence [GGC]4[GAC4] · [GTC]4[GCC]4 remains relatively flat up to extension 1·5 and beyond, even without intercalant (b, d, f). For the low-entropy sequence G12C12·C12G12, average inclination remains flat up to extension of 1·5, but it experiences a sudden change after the extension passes 1·5 (a, c). In the presence of EtBr inclination increases smoothly after the extension point of 1·5 and reaches the second flat region of extension beyond 1·6 (e).
Extending beyond approximately 3 Å bp−1 leads to breakup of the Σ phase and also to loss of Watson–Crick hydrogen bonding, as the bases interdigitate with each other and hydrogen bond to the backbone.
The question of planarity of the base stacking is important to monitor as a structure of stretched DNA in which formation of stack breaks is avoided by collective tilting of the stack has been associated with stretching in the 3′–3′ geometry (Roe & Chaka, Reference Roe and Chaka2009). Without intercalators, the average base-pair inclination in the presence and absence of intercalators up to the extension point of 1·5 was flat (Figs 3b , 3d and 3f ), which indicates no collective tilting. For the high-entropy sequence, in the presence of intercalators, this trend continued after an extension of 1·5 but without intercalators showed a sudden drop at around 1·7. For the low-entropy sequence (G12C12·G12C12), the change of average inclination up to an extension of 1·5 is the same as for the high-entropy sequence. The bare sequence and the one in the presence of arginine reach a maximum inclination at a relative extension of 1·6–1·7 and drop afterwards (Figs 3a and 3c ), but in the presence of EtBr, a continuous increase is observed after extension 1·5, followed by a second flat region after 1·6 (Fig. 3e ). That average inclination tends to be small during DNA extension for the high-entropy sequence with or without organic cations is consistent with the results put forward from experiment (Bosaeus et al. Reference Bosaeus, Reymer, Beke-Somfai, Brown, Takahashi, Wittung-Stafshede, Rocha and Nordén2017) as suggesting Σ formation even in free solution.
3.4 Base-pair step classification
Figure 4 shows the proportions of different local conformations consistent with different phases. Examples of each conformation are shown in Fig. 5. Local conformations were classified according to the physical interactions which were either broken or preserved, with Watson–Crick hydrogen bonds and planar base stacking giving way over medium extensions of 1·3–1·5 to a complex regime in which regions of melted base pairs (no or mismatched hydrogen bonding) compete with regions in which the Σ phase dominates with WC hydrogen bonding preserved, but with stacking periodically either broken or reduced by non-collective tilting. At extensions beyond 1·7, in the absence of intercalator molecules, the zipper phase emerges.

Fig. 4. Base-pair steps (four bases) were classified by local conformation as β: base-paired and stacked, μ: melted, ζ: zipper, as planar with broken stacking (σ) or as τ : tilted. The left panels (a, c–k) show the three major states of the DNA, with a melting transition over extensions 1·2–1·6, followed (in the absence of intercalator) by a hyper-stretched zipper conformation. The right panels (b, d–l) show the incidence of states (σ, τ) in which the rise exceeds 5·6 Å, with preserved Watson–Crick hydrogen bonding. In systems with intercalator and a triplet coding sequence (h, l); steps at the codon boundary (p3) have an enhanced proportion of σ states, peaking in the extension range 1·4–1·5.
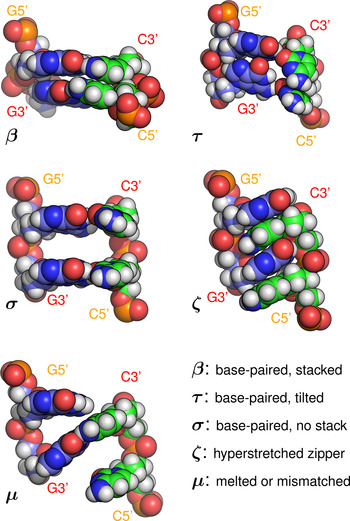
Fig. 5. Example base-pair step conformations (all of sequence GG·CC) classified by the type of stacking and hydrogen bonding present. Note that the initials β, τ, σ, ζ, μ do not refer to phases (collective structures) but local conformations. A step labelled as ‘β’ would, for example, be consistent with the A, B, C, Z, or Σ phases, all of which include base stacking and Watson–Crick hydrogen bonding.
In the presence of intercalators, the zipper phase is destabilised and WC base-paired conformations are stabilised. Although the count of conformations consistent with the Σ phase increases again at high extension with intercalators, the threefold periodicity is weakened. The presence of the Σ phase (in the full sense of two β-steps alternating with one σ-step) reaches a maximum average proportion of about 30%, with the remainder at this point made up mostly of melted or indeterminate configurations, or of boundary regions between melted and structured phases (Figs 4h and 4l ).
4. Discussion
The mechanics of DNA under tension are affected by various factors including the counterions (Vlassakis et al. Reference Vlassakis, Williams, Hatch, Danilowicz, Coljee and Prentiss2008), sequence (Rief et al. Reference Rief, Clausen-Schaumann and Gaub1999) and temperature (Fu et al. Reference Fu, Chen, Marko and Yan2010). Molecular combing results show that DNA in its stretched form is not denatured, with a double-helix structure which is characterised by a diameter of 1·2 nm (Maaloum et al. Reference Maaloum, Beker and Muller2011). X-ray diffraction of stretched cross-linked films of a mixed sequence of DNA show gaps of ~8 Å (André et al. Reference André, Fontaine-vive, Möller, Fischer, Maret, Forsyth and Gisler2008), nearly the same size as seen in the DNA–RecA complex. These experimental results suggest the existence of a stretched form of solution DNA with preserved base-pair stacking.
In order to relate the physics of DNA stretching with its function in storing and copying information, we have estimated the sequence dependence of the free energy cost in water at moderate ionic strength to unstack a given codon from its neighbours at the codon boundaries, leaving the codon itself intact as a triplet of stacked base pairs. This initial calculation reveals that although the aqueous solution environment does not strongly drive triplet partitioning, that a distinct hierarchy of triplet formation energies exists with respect to sequence features. The triplet formation energy estimates show that sequences coding for ‘stage 1’ amino acids hypothesised to have appeared early in evolution (plus arginine) are more likely to partition into triplets at the codon boundaries than to partition in any other pattern when under tension. In order to investigate this phenomenon, we carried out pulling simulations of DNA duplexes encoding stage 1 amino acids, in the presence of arginine and also of ethidium bromide, as well as control simulations using low-entropy sequences, and also tested aqueous conditions with monatomic salt only.
In order to observe substantial triplet disproportionation, both a bulky organic cation (i.e. arginine or ethidium) and a sequence selected from codons yielding phase 1 amino acids was required, with the combination of these two factors operating in a non-additive way to produce a solution structure of stacked base-pair triplets. Overstretching the Σ-duplex led to formation of interdigitated zipper DNA, while stretching without cofactors or appropriate sequence led to disordered but not fully denatured structure consistent with experiments (Balaeff et al. Reference Balaeff, Craig and Beratan2011; Bosaeus et al. Reference Bosaeus, Reymer, Beke-Somfai, Brown, Takahashi, Wittung-Stafshede, Rocha and Nordén2017) and simulations (Konrad & Bolonick, Reference Konrad and Bolonick1996).
Ikehara et al have shown that codons matching the pattern GNC probably constituted the original, minimal functional genetic code. These authors argue based on multiple strands of reasoning that the amino acids GADV, translated from these codons, constitute the unique minimal adequate set to generate functional globular proteins (Ikehara et al. Reference Ikehara, Omori, Arai and Hirose2002). We argue that it is no coincidence that the same GNC codons are those which drive maximal triplet disproportionation, allowing recombination and possibly protein synthesis to operate without the sophisticated enzymatic machinery which exists today. We hypothesise that a bootstrap process took place, with crude triplet disproportionation facilitating recombination, driving-accelerated evolution and leading to more sophisticated protein–DNA interactions, in turn allowing expansion in further stages of the genetic code.
We attempted to reductively study the factors driving Σ formation of DNA, which we deem to be force (applied via filament formation in the case of RecA, but capable of being applied in many ways), sequence content and the presence of cationic amino acids (as part of a structured protein today, possibly not so in early biology). We have found that these factors operate collectively to drive Σ formation, in competition with tilting or melting of the DNA base pairs. We do not rule out Σ DNA as a long-lasting stable collective structure of DNA while under tension in solution; however, we are also not able to strongly confirm this as the microsecond timescale accessed is considerably shorter than the longest (1 s) equilibration timescale of the system.
4.1 Speculative box
We speculate that ornithine (instead of arginine) may play the role of triplet promoter in some organisms, or have done so earlier in the evolutionary process. The usurpation of ornithine codons to instead signify arginine may have led to a jump in the efficiency of recombination and an evolutionary explosion.
Supplementary material
The supplementary material for this article can be found at https://doi.org/10.1017/S0033583517000130.
Acknowledgements
This project was financially supported by the University of Luxembourg. Computer simulations presented in this paper were carried out using the HPC facility of the University of Luxembourg (Varrette et al. Reference Varrette, Bouvry, Cartiaux and Georgatos2014). The authors thank Bengt Nordén for considerable guidance, criticism and inspiration.
Financial Support
This work was supported by the University of Luxembourg (grant number R-AGR-0136).
Conflict of Interest
None.


 Open access