


Online shopping for groceries was the fastest growing sector of the supermarket industry between 2010 and 2018 in the UK(1) and elsewhere(2); Kantar Worldpanel data indicate that the effects of the Covid-19 pandemic are likely to further support this trend(3). In the UK in 2018, 7 % of supermarket shopping was conducted online, representing over £11 billion annually(1). Online grocery sales are particularly strong in the UK, France, the USA, China and South Korea(2).
Increasingly, online supermarkets are being used as a source of ‘big data’ for monitoring the food system and developing novel nutrient composition tables to support public health research. In the UK, data collected from six online supermarkets have been used to monitor the healthiness of ready meals and pizzas(Reference Harrington, Adhikari and Rayner4) and to evaluate the impact of the Soft Drink Industry Levy on sugar levels in drinks(Reference Scarborough, Adhikari and Harrington5). In Australia, data collected from two online supermarkets have been used to monitor price promotions on sugar-sweetened beverages(Reference Zorbas, Gilham and Boelsen-Robinson6) and foods(Reference Riesenberg, Backholer and Zorbas7). These studies assume that the nutrition information, defined as nutrient declarations and/or supplementary nutrition information(Reference Rayner, Wood and Lawrence8), available in online supermarkets is representative of physical (i.e., brick and mortar) supermarkets. Pricing and price promotions were compared between the two settings, but there is limited research in this area. One New Zealand study comparing fruit and vegetable pricing in physical stores with an online supermarket found that many fruits and vegetables were cheaper in the online supermarket(Reference Pearson, Winter and McBreen9); however, it is unclear whether this finding applies outside of New Zealand and whether it applies to other food and drink products found in supermarkets.
Product availability(Reference Hollands, Carter and Anwer10) and provision of nutritional information(Reference Crockett, King and Marteau11) are important factors for promoting healthy eating when grocery shopping. There is also some evidence that online grocery shoppers are less price sensitive and have completed higher levels of education(Reference Jilcott Pitts, Ng and Blitstein12), although much more research is needed on this topic, particularly in a UK context. If prices and promotions – two aspects of marketing known to influence purchasing behaviour(Reference NIebylski, Redburn and Duhaney13-Reference Martin, Bauld and Angus16) - differ between online and physical stores, then this could influence health inequalities. This is particularly so if categories associated with health outcomes, for example, fruits and vegetables(Reference Aune, Giovannucci and Boffetta17) and alcohol(Reference Rehm, Baliunas and Borges18), differ in how they are marketed online and in physical stores.
We compared a sample of food and drinks (hereafter referred to as ‘food’ as shorthand for food and drink products) collected in six physical supermarkets with products found in the online offering of those supermarkets to assess coverage, data validity and differentiation of online supermarkets. Specifically, we estimated the proportion of foods available in physical supermarkets that can also be purchased online; we compared nutritional data which should be identical in the two settings and compared provision of front-of-pack (FOP) food labelling, price and price promotions between identical foods available to purchase in online and physical stores.
Methods
Data collection from physical supermarkets
We collected data on price, price promotions, FOP nutrition labels and nutrition information from physical supermarkets by photographing the shelf barkers, and front and back packaging of a random sample of foods from each of Tesco, Sainsbury’s, Asda, Waitrose, Morrisons and Iceland. For each supermarket, we selected the nearest superstore to the city of Oxford, UK; we used the supermarkets’ own definition of superstore, as listed on their websites. We received permission from store managers to collect data.
Our protocol for random sampling of foods, established before data collection, followed a published method(Reference Hieke, Kuljanic and Pravst19). The population that we sampled consisted of all items available for purchase in the supermarket excluding non-food items, items from deli/fresh food counters and items for sale at the checkout. Deli and fresh food counter products were excluded due to difficulty in photographing products without assistance from supermarket staff. Checkout items such as mints or chewing gum were excluded as it was assumed that these items would also be available for purchase in other places in the supermarket, and hence including them in the sampling frame would lead to over-representation. For each supermarket, a researcher visited and identified all of the sections (i.e., aisles and end of aisle displays) where eligible foods were available and assigned each section a number. The number of different foods available in each section was estimated by counting the number of foods in one section; this provided an estimate of the maximum number of products in each section. A random number generator, weighted by the estimated number of foods per section, was used to generate thirty-five randomly selected numbers. Following a standard protocol, these generated numbers were then used to count products in each section; when the randomly generated number was reached, that product was included in the sample. To allow for stratified analyses for two categories strongly associated with health, in each supermarket, an additional seven foods were randomly selected from the fresh fruit and vegetable section, and seven from the alcohol section, making a total of forty-nine foods sampled in each supermarket. We were unable to find any similar previous studies to provide effect sizes for power calculations; therefore, the sample size was based on the number of products needed to estimate Cohen’s kappa statistic with 95 % CI of +/− 0·1.
Two researchers used the photographs to build a dataset that consisted of supermarket and product IDs, product name, product size, price observed on the day, whether or not on price promotion (defined as an advertised temporary difference in price), whether or not FOP nutrition labelling of any kind is present and nutritional information per 100 g for the following mandatory(20) values: energy, fat, saturated fat, carbohydrates, sugar, fibre, protein and salt. Non-nutritional FOP labels describing dietary types or health claims were not investigated in the current study. Using the FoodEx2 classification system(21) to categorise the foods sampled, in total fifty-three categories of food were sampled across the six supermarkets (Fig. 1).
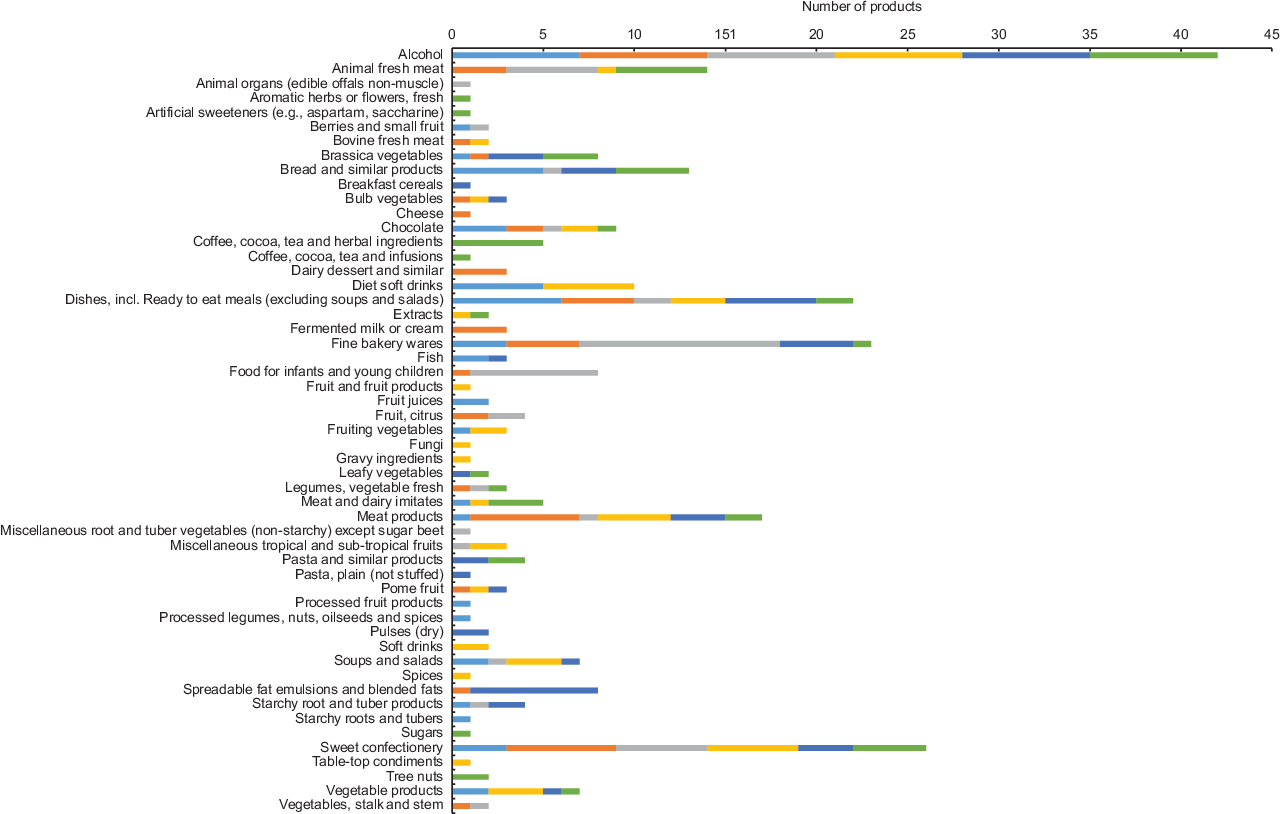
Fig. 1 Food categories sampled in each supermarket. ![]() , Asda;
, Asda; ![]() , Iceland;
, Iceland; ![]() , Morrisons;
, Morrisons; ![]() , Sainsburys;
, Sainsburys; ![]() , Tesco;
, Tesco; ![]() , Waitrose
, Waitrose
Data matching with online supermarkets
We used foodDB to identify equivalent products from online supermarkets. A full description of this dataset is provided elsewhere(3). Briefly, foodDB is a research-ready dataset of over 14 million observations of food and drink products available in online supermarkets, collecting weekly ‘snapshots’ since November 2017. Time-stamped data are collected weekly from seven UK online supermarkets (the six supermarkets included in the current study, plus Ocado which does not have any physical stores) using automated methods which capture, process and store data on over 99 % of all food and drink products available to purchase online. Data collected include product price, promotions, product size, ingredients, nutritional information and image. These data are curated in a MySQL database. The presence of FOP labelling was assessed by a researcher manually assessing the images identified in the online database.
For each of the foods sampled in the physical stores, foodDB snapshots within a maximum of a month of the physical data collection were searched for an equivalent product matched on date of collection, supermarket, product name and product size. Where an equivalent product could not be found, we relaxed the criterion of matching on product size (e.g., if an equivalent food with product size 400 g could not be found in the online supermarket from the same time period, but the same food with product size 200 g was available, we selected the smaller variant). In the cases where product size was not matched, we only included these foods in the comparison of nutritional values. Therefore, this resulted in two datasets. The full match dataset that matched both the name and product size in the physical and foodDB databases was used for comparison of price, price promotions and presence of FOP labels. The product-match dataset was used to compare the nutritional data per 100 g.
Analysis
We assessed the coverage by calculating the proportion of foods collected that were available in online supermarkets for the general, fruit and vegetable, and alcohol samples. Next, we calculated the proportion of price promotions and FOP labelling in online and physical supermarkets. We then assessed the median and interquartile values for price and all nutritional variables using a Wilcoxon rank-sum test to assess if there were significant differences between the online and physical datasets.
To explore the degree of agreement between the online and physical supermarket samples, we calculated inter-rater reliability for price, whether or not on price promotion, whether or not contains FOP nutrition labelling and each of the eight nutrients stated on back-of-pack nutrition labelling. For the binary variables, we used Cohen’s kappa statistic. For the continuous variables, we used the concordance correlation coefficient and produced Bland–Altman plots to assess evidence of systematic bias. These analyses were conducted on the general sample and also on the two subsamples of fresh fruit and vegetables, and alcoholic drinks separately. For nutritional information, we used data as presented in both physical stores and online supermarkets; the data presented in nutritional tables inconsistently use 0, 1 or 2 decimal places. For purposes of these calculations, we used the value ‘x’ wherever nutritional information was reported as ‘<x’ (e.g., <0·1 g salt per 100 g).
Results
Matching of products
Table 1 shows the success in matching products identified in physical stores with equivalent foods from online supermarkets found in foodDB. We found that 14·7 % (95 % CI 10·3 %, 20·4 %) of the general sample were not found in online supermarkets, but this reduced to 9·5 % (6·0 %, 14·5 %) when including product matches (where the product name matched, but the size of the product differed between physical and online supermarkets). Confidence intervals for both full matches and product only matches overlapped for the general sample and the fruit and vegetables, and alcohol samples (Table 1). Full and product only matches by supermarket are available in the online Supplementary Tables. Prices in physical and online supermarkets had similar medians (£1·87 v. £1·85); nutritional value medians and interquartile ranges were also similar between the two settings (Table 2).
Table 1 Percentage match between physical store samples and online supermarkets samples
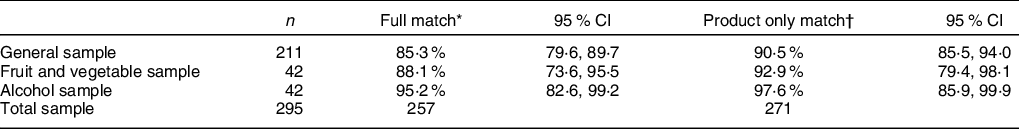
* Both a product and size match between the physical and online supermarket.
† The same product was found in both the online and physical supermarkets, but the size of the product differed.
Table 2 Description and comparison of price in £ per product and nutritional data in g/100 g in physical and online supermarket total samples (n 295)
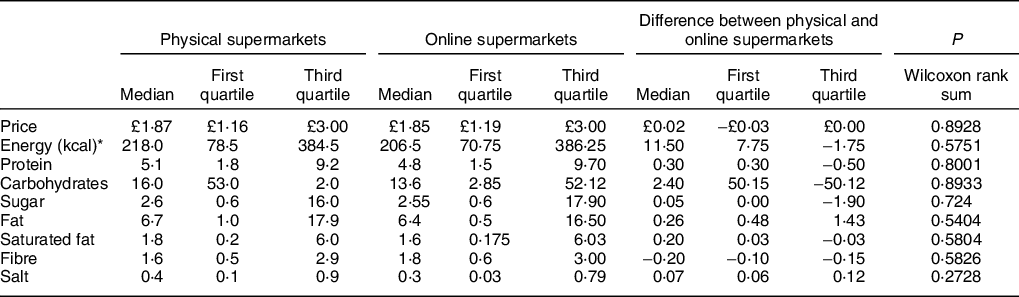
* To convert kcal to kJ, multiply by 4·184.
Comparing front-of-pack labelling, price and promotions
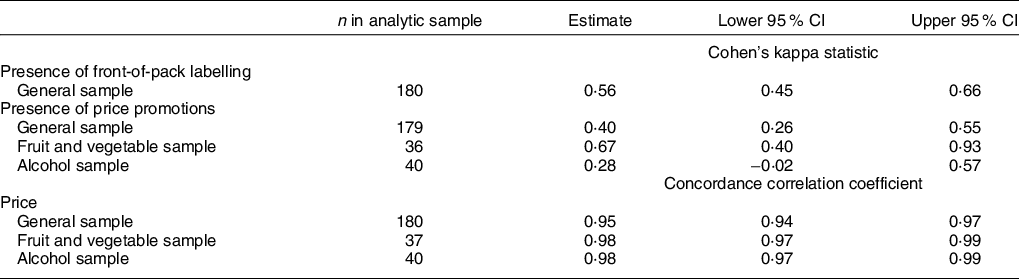
The price displayed for products was very similar between the physical and online stores, with little indication of difference for the general sample, alcohol or fruit and vegetables samples (concordance correlation coefficient > 0·9 for all samples). Bland–Altman plots showed no evidence of bias (Fig. 2). The presence of FOP labelling was only assessed in the general sample as alcoholic drinks are only allowed to display an energy label on a voluntary basis(Reference Hieke, Kuljanic and Pravst19), and fruit and vegetable products are often not packaged. There was moderate agreement between physical stores and online supermarkets (Cohen’s kappa = 0·56 (95 % CI 0·45, 0·66)), with 74 % of FOP labels present on products from physical stores, compared with 42 % on products in online stores (P < 0·001). There was fair agreement in the general sample for the presence of price promotions (Cohen’s kappa = 0·40 (95 % CI 0·26, 0·55)) with more price promotions present in physical supermarkets (32 % of products) as compared with online supermarkets (24 % of products); however, CI were wide for the alcohol and fruit and vegetable samples (Table 3).
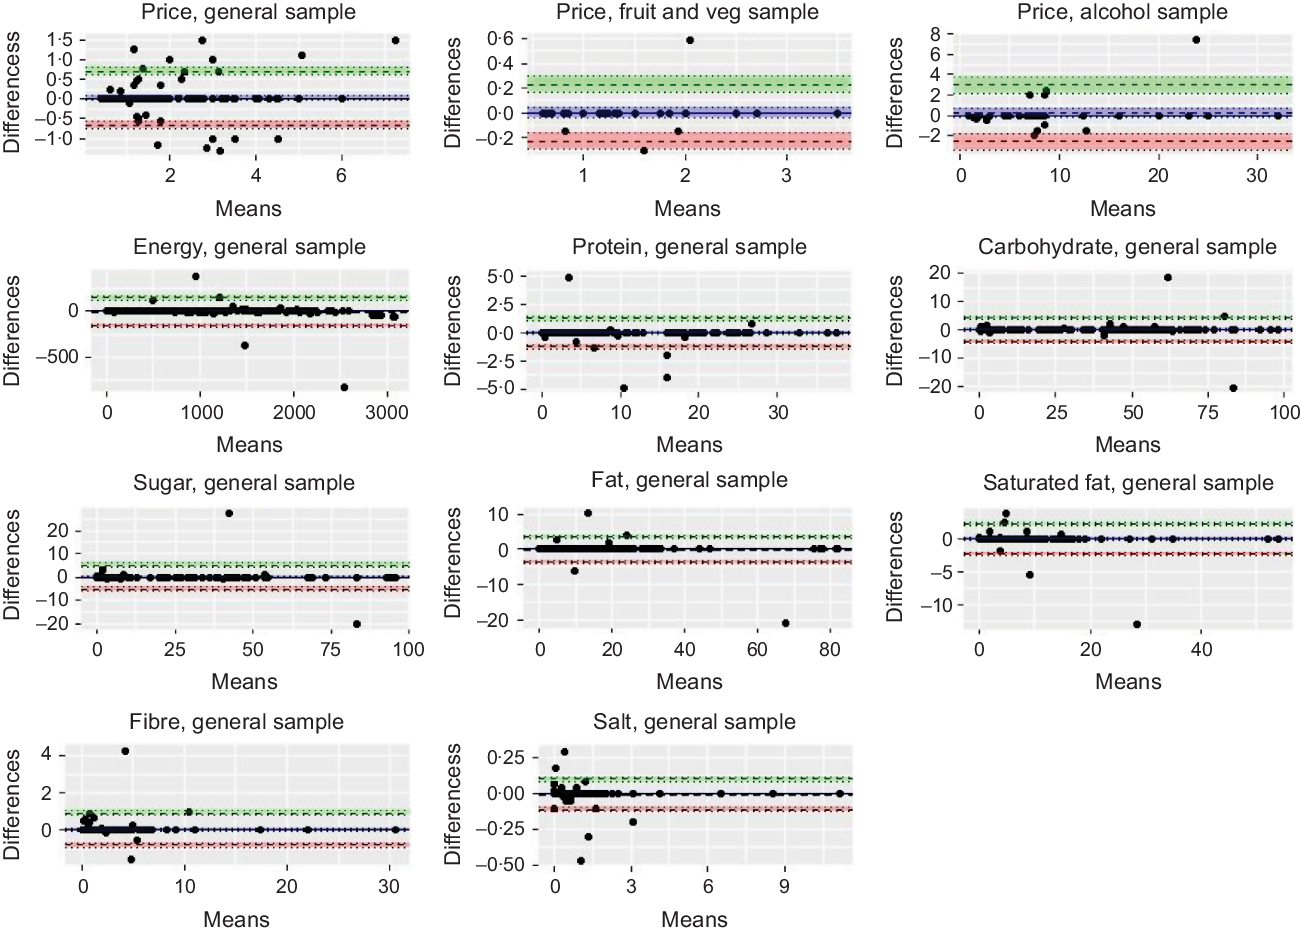
Fig. 2 Bland–Altman plots
Table 3 Comparison of price, presence of front-of-pack labelling and price promotions between online supermarkets and physical supermarkets, using full match dataset
Nutritional information validation
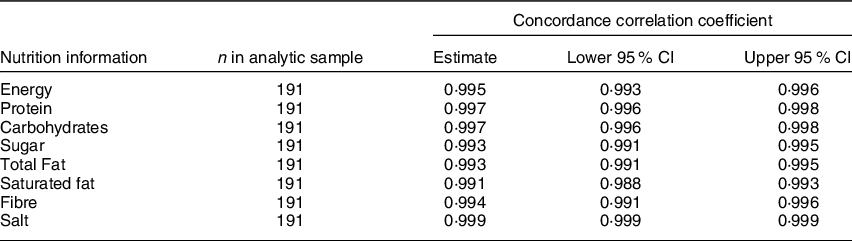
In the general sample, the nutrient composition information displayed on online supermarkets was almost identical to the nutrient composition information displayed on the packaging found in physical supermarkets (Table 4). Bland–Altman plots for all nutrients showed no evidence of bias (Fig. 2).
Table 4 Comparison of nutritional information between online supermarkets and physical supermarkets, using the product-match dataset and general sample
Discussion
In a random sample of foods selected from six UK supermarkets, we found that there was a good correlation in the availability of products between online and physical supermarkets. The nutritional information displayed on packaging is almost identical to the nutritional information displayed on online supermarket websites. The presence of FOP labelling was somewhat inconsistent between the two settings. Prices were very similar between online and physical supermarkets, but there is evidence of marked differences in price promotions between the two settings.
Nutrient composition tables on packaging are required by law to be accurate(22) and previous research has suggested that nutritional labels are a reasonably accurate representation of the food contained in the packaging(Reference Albuquerque, Nunes and Oliveira23). Our study shows that the nutritional information available online and in physical stores in the UK correlates very highly; therefore, it is viable to use data from online supermarket databases such as foodDB(Reference Harrington, Adhikari and Rayner4) for nutrition studies and interventions.
The difference in price promotions between online and physical stores is interesting and particularly relevant in light of the UK government’s 2018 childhood obesity plan(24) which outlines a policy to ban price promotions on unhealthy foods. As this policy may also be applied online, it is important to identify differences between physical and online stores to determine how effective the regulations may be and to prevent exacerbation of inequalities. The report also indicates a plan to ban promotions of unhealthy items by location in physical retail stores; although it states an aim to extend policy to online shopping, the precise details of this are unclear.
As use of online supermarkets increases, understanding how differences in price promotions impact dietary inequalities is becoming increasingly important. The higher number of price promotions in physical stores means that it may be easier to get better value for money when grocery shopping in physical stores. Although our survey was underpowered to assess whether price promotions varied according to the healthiness of products, there is some evidence that higher sugar foods are more likely to be price promoted(Reference Smithson, Kirk and Capelin25) and shoppers whose baskets contain high proportion of foods on price promotion buy higher numbers of less healthy foods(20). Price promotions are made use of similarly by people with differing incomes and family structures in physical retail stores in the UK(Reference Coker, Rumgay and Whiteside26); however, it is unknown if this translates to online supermarket shopping. Further research into promotions online is needed to better understand patterns in promotions, the impact on purchasing behaviour and the implications for policy.
The presence of FOP labelling differed somewhat between online and physical supermarkets. As the aim of FOP nutritional labelling is to convey the nutritional content of a food in a simple manner, this may mean that those doing their grocery shopping online lose out on this information. However, many online supermarkets provide traffic light labelling on the individual product pages which may overcome this issue somewhat.
We made an assumption that products of the same type with different sizes have the same ingredients and nutrient composition; this was the basis for the ‘product only’ match group. If the nutritional composition per 100 g was to change with the size of the product, then this would have an impact on our findings for the ‘product only’ matches.
Our study was underpowered to detect differences between the sub-categories of alcohol and fruit and vegetables and to produce supermarket-level results. Future research should use these data for sample size calculations, to enable studies to be adequately powered to detect differences in price promotions between online and physical stores, and whether these differences are associated with the healthiness of a product.
Our data collection was limited to Oxford and its surrounding areas; therefore, it is possible that regional variation in price and price promotions may be present which could not be investigated in our study. Supermarkets are known to practice price flexing or varying process by geographic location(27). Given that there are variations in price by geographic location, it is possible that there may also be variation in the offering of online supermarkets according to the location of the shopper; however, to date this is unknown.
Overall, we found there is good correlation between online supermarkets and physical stores. The current study provides some validation for using online and big data methods to monitor food systems, as well as using online supermarket data for public health interventions.
Acknowledgements
Acknowledgements: This paper was supported by the NIHR Biomedical Research Centre at Oxford. Financial support: This work was supported by the Medical Research Council (MR/R015465/1), British Heart Foundation (FS/15/34/31656), University of Oxford Nuffield Department of Population Health Early Career Fellowship (Award date Jan 2019), The Scientific and Technical Research Council of Turkey (TUBITAK 2219), NIHR Project Grant (16/130/01), NIHR Biomedical Research Centre at Oxford (IS-BRC-1215-20008). These funders had no role in the design, analysis or writing of this article. Conflicts of interest: There are no conflicts of interest. Authorship: P.S., A.K., R.H. and P.B. were involved in the design of the study. D.D. and P.B. conducted the data collection. V.A., P.S. and P.B. analysed the data. All authors contributed to writing the manuscript. Ethics of human subject participation: The current study did not involve human participants.
Supplementary material
For supplementary material accompanying this paper visit https://doi.org/10.1017/S1368980020004346


