

Fishing-dependent coastal communities are vulnerable to numerous stresses that threaten their long-term viability, including sea level rise, resource depletion, environmental degradation, and coastal gentrification. Concerns about these communities are shared by many stakeholders outside of the immediate community because fishers not only provide fresh seafood and regional economic diversity, they also maintain links to cultural heritage and traditional ways of life. Moreover, the condition and extent of the coastal wetlands that characterize the physical setting of many of these communities affects the status of proximal estuarine ecosystems and coast-wide fisheries of migratory species (Gedan, Silliman, and Bertness Reference Gedan, Silliman and Bertness2009).
Environmental restoration of coastal marshes has been proposed as an element of enhancing resilience of fisheries and coastal communities (e.g., Gulf Coast Ecosystem Restoration Task Force). To guide investments, decision makers often look to economic analyses of benefits derived from socioecological services to help establish priorities, design cost-effective approaches, and resolve conflicts (e.g., Johnston et al. Reference Johnston, Magnusson, Mazzotta and Opaluch2002). These services are also referred to as ecosystem services, typically defined as “benefits that people obtain from ecosystems” (Millenium Ecosystem Assessment (MEA) 2005). However, we use the term socioecological services to highlight that benefits emerge through the interaction of ecosystems with social, cultural, and economic systems. People contribute to production of benefits from ecosystems because they provide the labor and capital needed to realize benefits from using the ecosystem or to express appreciation for services they do not use but value (Wainger and Mazzotta Reference Wainger and Mazzotta2011).
A challenge of using monetary valuation of socioecological service benefits to guide decisions is that many types of hard-to-measure benefits are typically omitted, including intangible benefits associated with heritage protection or ecological resilience. Most often, economic valuation approaches translate human concerns into a subset of changes that can be quantified and then monetized – a translation that, by necessity, reduces the quantity and quality of information provided. While practitioners understand that economic valuation surveys or choice experiments are rarely intended to comprehensively represent social values, policy makers can be pressured to weight the “hard data” of monetary valuation more than concerns that cannot be readily monetized.
To reintroduce some of the diversity and breadth of values for decision-makers, qualitative methods can be used to more thoroughly characterize concerns (Lo and Spash Reference Lo and Spash2013, Starr Reference Starr2014). Qualitative methods, drawn from cultural anthropology, sociology, psychology, decision science, and economics are widely used to understand perspectives, thought processes, and preferences. Further, many methods aim to provide opportunities for individuals to develop informed and thoughtful preferences (Robinson and Hammitt Reference Robinson and Hammitt2011). These approaches involve interviews, small group discussions, focus groups, and/or preference elicitation techniques that can be used alone or in combination with valuation approaches (Lo and Spash Reference Lo and Spash2013).
Challenges presented in using the rich information generated by qualitative approaches are at least twofold. First, with the exception of decision science approaches, information is not typically organized in a manner that helps a decision maker understand which tradeoffs are more or less acceptable to stakeholders. Second, results are often presented in a narrative format that provides exceptional depth of understanding but also complicates decisions and overwhelms time-limited decision makers. While decision science approaches may provide more explicit information on willingness to trade off diverse outcomes, resources may not always be available to conduct quality investigations. Thus, results of social science investigations that would not normally produce quantitative data can be made more accessible to decision makers by condensing narrative information into metrics that use ordinal ranks or other types of numeric values to represent relative preferences. Such information can enhance understanding of the acceptability of alternative actions, even if the information does not directly measure willingness to make tradeoffs. Research into qualitative analysis is active, and methods are evolving to enhance the objectivity of results, for example, by adoption of robust sampling approaches (Guest Reference Guest, Bernard and Gravelee2014, Ritchie et al. Reference Ritchie, Lewis, Nicholls and Ormston2014).
In this paper we explore the use of Q methodology (Brown Reference Brown2003) to efficiently summarize qualitative information. Q methodology is a social science research method used to systematically assess diverse viewpoints on a topic. It was created in the 1930s by the psychologist and physicist William Stephenson, and since then it has been used to study diverse topics, including national forest management, effects of tourism on local residents, and health care priorities (Steelman and Maguire Reference Steelman and Maguire1999, Hunter Reference Hunter2013, van Exel et al. Reference Van Exel, Baker, Mason, Donaldson and Brouwer2015).
Despite the challenges of concise presentation, qualitative preference information may enrich decision making by deepening the understanding of public values. Prior work has indicated that focus groups yield different information about public values than valuation surveys (e.g., Kaplowitz and Hoehn Reference Kaplowitz and Hoehn2001). These differences have been attributed to many factors, including a lack of representation of less tangible values in valuation surveys and the effect of group dynamics on how individual preferences are constructed for unfamiliar and public goods (Gregory and Slovic Reference Gregory and Slovic1997, Lo and Spash Reference Lo and Spash2013). Thus, qualitative approaches are poised to broaden the set of concerns, which can reveal conflicts and common ground among stakeholders and ensure that the salient stakeholder issues and values have been considered.
The remainder of this paper is organized as follows. The next two sections establish the goals and details of the case study. The methods section describes the Q methodology and multivariate statistical methods used to conduct analyses and interpret findings. The results and discussion sections describe the alternative perspectives revealed, stakeholder differences, and changes in preferences resulting from the collaborative learning process. The paper concludes with a summary of findings.
Goals
This study was nested within a much larger study (an academic-government partnership) that developed community resilience goals and evaluated their ability to be achieved through marsh restoration and other social and biophysical adaptation strategies (Johnson Reference Johnson2016, Johnson, Needelman, and Paolisso Reference Johnson, Needelman, Paolisso, Companion and Chaiken2017). The primary goal of this study was to capture the strength of people's preferences for sustaining socioecological services of a coastal community to inform coastal adaptation choices. Further, we explored whether or not perspectives varied by stakeholder type and how, to understand potential sources of conflict. To encompass a wide range of relevant perspectives, we defined stakeholders to include community members, representatives of state and federal government, national nongovernmental organizations (NGOs), and academic researchers (ecologists, cultural anthropologists and economists). These groups were included due to their strong interest in the outcomes of decisions made to enhance climate change resilience. The state of Maryland owns or manages the majority of the marshland area as part of a Wildlife Management Area and a National Estuarine Research Reserve (which includes federal partners). The area also serves as a scientific study area for most of the participating ecologists. Other stakeholders represented institutions with goals to restore the Chesapeake Bay aquatic and coastal ecosystems or to preserve local heritage.
A secondary goal of this study was to test whether a collaborative learning approach to stakeholder engagement (Feurt Reference Feurt2008) changed values or not; we tested the hypothesis that allowing people to interact as they developed their preferences for unfamiliar goods and services would alter attitudes, as suggested by prior research (Gregory and Slovic Reference Gregory and Slovic1997, Lo and Spash Reference Lo and Spash2013). Group interaction can overcome some of the cognitive difficulty of constructing preferences for unfamiliar goods (e.g., acres of bird habitat). Evidence of this cognitive difficulty comes from the finding that hypothetical bias, which inflates willingness to pay in stated preference surveys, tends to be lower for private goods compared to public goods (List and Gallet Reference List and Gallet2001). The benefit of group interaction is thought to be that it allows people to refine their understanding of the importance of such services to themselves and others in their communities (Ostrom et al. Reference Ostrom, Burger, Field, Norgaard and Policansky1999).
Case Study
The case study area was a rural coastal fishing community of the Chesapeake Bay, situated on the lower eastern shore of Maryland (Figure 1). The region is culturally significant because it has the largest remaining fleet of historic skipjacks (traditional wooden sailing vessels for dredging oysters) operating commercially in Chesapeake Bay. The cultural heritage of the region is largely defined by the iconic watermen and the associated values of independence and self-sufficiency. In 2015, the proportion of the peninsula's residents employed in the Farming, Fishing & Forestry sector was 20 percent (Johnson Reference Johnson2016). In addition, many residents reported that they engage in marsh-dependent fishing, hunting, and trapping for recreation and barter. However, the region is changing culturally and economically as retirees from distant urban areas (known as come-heres in the local vernacular) settle in the region. Further, many watermen are dependent on spouses or family members employed outside of the community to provide financial stability and benefits such as health insurance.

Figure 1. Map of case study area on the eastern shore of Maryland, US
This low-lying area is dominated by a large coastal marsh system, parts of which are being restored using ditch plugging. Ditch plugging is being assessed as a means to restore the natural hydrology and promote higher marsh accretion rates, making the marshes more resilient to climate change-induced sea level rise. If ditch plugging contributes to marsh preservation, it would be expected to contribute to the continuity of many socioecological services that benefit the local community, including property protection from floods and erosion, community aesthetics, and existence values for the marsh and its habitat. The increased marsh inundation associated with ditch plugging is also expected to attract waterfowl for hunting but has the potential to create harm if it increases mosquito populations. Mosquito populations are being monitored, as part of the restoration and preliminary results suggested effects of ditch plugging on mosquitoes were modest (Leisnham results in Needelman et al. Reference Needelman, Paolisso, Land, Leisnham, Baldwin, Johnson, Wainger, McMurray and Dindinger2015).
The effects of coastal wetland losses in this area are likely to extend beyond the local residents because such losses would be expected to reduce socioecological services for proximal coastal communities and distant beneficiaries. These regional services include tangible use benefits such as food production, recreational opportunities, and intangible (nonuse) benefits such as preserving wetland species and ecosystems for the enjoyment or use of future generations (Turner, Georgiou, and Fisher Reference Turner, Georgiou and Fisher2008). Fisheries hundreds of kilometers away could potentially be affected if nursery habitat losses disrupt migrating fish populations, as suggested by ecological principles (Boesch and Turner Reference Boesch and Turner1984) although not empirically demonstrated (Brown Reference Brown2003). Other socioecological services from marshes with regional interest include habitat and stop-over areas for migratory bird populations that cross multiple continents, carbon sequestration that promotes global risk reductions, and heritage and cultural values.
Methods
The project in which this preference study was embedded was conducted over two years, using a collaborative learning process to meaningfully engage stakeholders. Collaborative learning, as we use the term, is an approach designed to promote cooperative natural resource management. The methods are aimed at bridging the divide between “technical competence” and an “open process” for decision making, meaning that stakeholders learn technical terms, concepts, and tradeoffs to fully participate in management discussions (Daniels and Walker Reference Daniels and Walker2001, Feurt Reference Feurt2008). The primary stakeholder interactions occurred during six workshops in which participants heard scientific presentations, engaged in large- and small-group discussions (including verbal shared history), compared perspectives through instantaneous voting, and worked together in small groups on projects aimed at engaging the broader community (e.g., projects with area youth and designing displays for local festivals).
The participants in the preference study were the stakeholders engaged in the larger project: community residents, nongovernment and government officials, and social and natural scientists. These stakeholders were identified and recruited into the project through multiple sampling methods. First, ethnographic insights, based on over 15 years of fieldwork in the area, were used to identify key informants with knowledge of the various community subgroups based on geography, length of residence and association with the area, and professional and cultural diversity (Paolisso Reference Paolisso2002). Second, ongoing qualitative research used snowball sampling to identify and recruit additional study participants based on the views of current study participants to enhance missing or deficient views and perspectives (Johnson Reference Johnson2016). Finally, we monitored project collaborative learning activities for information about additional participants who would bring new perspectives and representation to the study. Combined, we believe that these qualitative field methods allowed us to reach thematic saturation and representation with our sample of participants (Guest Reference Guest, Bernard and Gravelee2014). Some local participants were paid to attend ($100 per workshop), which may have broadened representation across affected groups. Of the total stakeholders, which included the research team and government scientists, 33 percent of pre-engagement participants and 43 percent of postengagement participants were local residents.
Applying Q methodology
A key choice in conducting qualitative preference elicitation is whether or not to use group discussions, individual elicitation, or some combination. Group dynamics can allow participants to share information that can help individuals construct preferences for unfamiliar goods. However, group discussions can easily be led by a few dominant participants or become distorted by peer pressure (among other group effects), causing some perspectives to be lost.
To balance these competing effects of group dynamics, Q methodology was applied here as a combination of group interaction and individual elicitation exercises. Group interaction allowed people to share information to explore their preferences, while individual interviews and ranking exercises allowed individual perspectives to be privately reported, to minimize peer pressure effects. In addition, because Q-sort requires respondents to prioritize goals, the technique is similar to an economic valuation analysis that would require making tradeoffs and can be used to quantify strength of preferences.
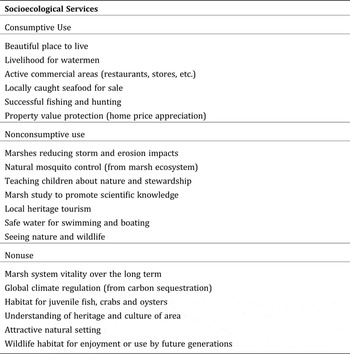
The first step of applying Q methodology was to use ethnographic field methods (facilitated discussion at the first workshop and one-on-one interviews) to capture the language used by stakeholders to describe their values. Interviewers asked open-ended questions such as, “What are some steps that are needed to build resilience in the social-ecological system of the Deal Island Peninsula?” to elicit concerns in participants' own words. From those interviews, team members compiled phrases that represented socioecological services. Results were summarized into 19 statements (Table 1), roughly evenly divided among consumptive use (resource removal or degradation), nonconsumptive use (uses without removal or substantial harm to ecosystems), and nonuse (intangible) benefits categories (see National Research Council (NRC) 2005). The services represented a wide range of potential benefits that included direct effects of marshes (e.g., Marshes reducing storm and erosion impacts) and indirect cultural outcomes (e.g., Understanding of heritage and culture of area).
Table 1. Socioecological services by category
We hypothesized that consumptive use services would score the highest for the local residents, because these provide the most tangible benefits and because fisheries are a traditional source of income in the community. Conversely, nonuse services were hypothesized to be scored the lowest by residents because the benefits were expected to be the least familiar.
To explore strength of preferences for the socioecological services of the Deal Island peninsula, participants were asked to rank a stack of randomly ordered cards, containing the 19 socioecological service statements, using two steps. First, participants were directed to sort the cards into three piles representing 1) most important to sustain, 2) least important and 3) everything else. Second, participants were directed to distribute the cards onto a predefined template (Figure 2), representing a quasinormal distribution, in which only a few statements could receive the highest or lowest scores. Participants were instructed that placement at the top or bottom of a column was equivalent. Results of the Q-sort were recorded by assigning each socioecological service a value from -4 to 4, to represent placement within each bin of the distribution.

Figure 2. Q-sort template used to rank socioecological services
Q-sorts were completed early and late in the collaborative learning process to represent pre-engagement and postengagement perspectives of the participants. The pre-engagement Q-sort took place primarily at the second workshop but also at the third workshop for new arrivals. The postengagement Q-sort was conducted at the final workshop. The Q-sort exercises were followed by facilitated small group discussion to learn more about the reasoning behind individual scoring.
Multivariate statistical analysis of Q-sorts
Q-sort results were analyzed to define distinct stakeholder perspectives, referred to here as value perspectives, using principal components analysis (PCA) with a varimax rotation (PQMethod software, Schmolck and Atkinson Reference Schmolck and Atkinson2014). Each Q-sort distribution (created by a participant) is an observation, and observations are grouped, using PCA factors, to represent distinct value perspectives. For the case study, these perspectives represent similar sets of rankings on socioecological service values.
The number of PCA factors used to represent diverse perspectives is chosen by selecting from among statistical results developed using different numbers of factors. The final set is chosen to maximize within-perspective correlations and minimize between-perspective correlations. The number of perspectives used is limited to PCA factors with eigenvalues greater than one, a criterion used to remove factors that explain an insignificant portion of the variance.
A common practice of Q methodology is to remove observations that do not have a good fit on a single factor and thus confound the ability to generate distinct perspectives that minimize correlation between factors. The alternative to removing observations is to create a greater number of perspectives that would generate more precision but reduce generalizability of findings. Such analytic choices need to be made in the context of how results are being used, and here we prioritized generalizable and simplified results.
The preflagging function of PQMethod was used in each analysis to identify and remove confounding observations, defined as those observations that explain minimal variance on the factor. Specifically, an observation explains minimal variance when 1) the squared loading of a given observation on the factor is less than half of the squared sum of the observation's loadings on all the factors, or 2) an observation has a statistically insignificant loading (p > 0.05) on the factor. Further, Q-sorts with roughly equal loadings on more than one factor were also removed. The effect of excluding Q-sorts on results was evaluated by comparing mean scores by service categories (Table 1) for the included Q-sorts, excluded Q-sorts, and the total combined set.
Results and changes between pre- and postengagement perspectives were analyzed with two methods. The PCA factors, or value perspectives, were described using the archetypal scores of the statements loading on the factor. Archetypal scores were determined by assigning ranks to the normalized z-scores of the group (Van Exel and de Graaf Reference Van Exel and de Graaf2005). The service with the highest z-score among observations within a group was assigned an archetypal score of 4, the statement with the second highest z-score was assigned a score of 3, etc. Differences between pre- and postengagement results were evaluated by comparing mean scores of services by stakeholder type for the categories of consumptive use, nonconsumptive use, and nonuse services (Table 1).
Results and Discussion
The pre- and postengagement factor analyses each identified three factors, each representing a distinct value perspective of the socioecological services (Tables 2 and 3) that were sufficiently similar that we discuss them as a single set of results. In both rounds of Q-sorts, the perspectives that emerged included a multidimensional mix of priorities on socioecological services (Tables 2 and 3). We interpreted the results generally as a spectrum from high scores on the least tangible benefits of marshes (Ecological sustainability emphasis) to high scores on the most direct benefits (Community livelihood emphasis). In between these two end-member perspectives was a group that balanced tangible and intangible benefits (Balanced). About 60 percent of the variance was explained with these three factors in both rounds.
Table 2. Pre-engagement archetypal Q-sort scores by perspective

Note: Bolded numbers indicate the highest and lowest ranked statements in each perspective
Table 3. Postengagement archetypal Q-sort scores by perspective

Note: Bolded numbers indicate the highest and lowest ranked statements in each perspective.
An important caveat to this generalization of results was that in the postengagement Q-sort, the difference between the Ecological sustainability and the Balanced perspectives was less distinct. Although scoring patterns retained similarities from pre- to postengagement, some archetypal scores were inconsistent over the two rounds because a high or low score for a service moved between perspectives. The names of the postengagement perspectives have been modified to reflect this blending of perspectives (Table 3).
The blending of perspectives appears to represent changes in attitudes over the course of the project. Using the Q-sort perspectives alone to represent evidence of change was challenging because the number of participants was smaller in the second round (due to a reduced attendance at the final project meeting). However, a comparison of individual participant's changes between the two rounds supports the idea that individual perspectives changed. Each respondent was given a code to represent if the second-round score represented movement to a more ecological perspective (-1), a more community-focused perspective (1), or remained the same (0). Mean scores by stakeholder group showed that academics moved towards the community focus, government stakeholders moved to a more ecological perspective, and local residents showed no change (Table 4), as discussed further below.
Table 4. Average movement between pre- and postengagement Q-sorts by stakeholder type

*Average scores per stakeholder category represent the mean movement of the group between the pre- and postengagement Q-sorts. Changes per individual were coded in terms of whether or not the participant's second round factor indicated a change to a factor with greater ecological emphasis (−1); greater community emphasis (1); or no change (0).
Small group discussions following the Q-sorts revealed that a common element of the Ecological sustainability and the Balanced members was a preference for foundational services or those that, when sustained, would improve outcomes of many other socioecological services. As one person in the follow-up discussions said, “bigger systems have to be in place in order for a community or livelihood to exist.” Bigger systems were understood to be services that supported many other services, and two common examples given were Marsh system vitality over the long-term and Wildlife habitat for enjoyment or use by future generations.
Discussions also revealed that the Community livelihood perspective reflected the concerns of many stakeholders about the economic and physical sustainability of the local community. Tangible services, such as Livelihood for watermen and Marshes reducing storm and erosion impacts, were foremost in their minds. As one participant stated, “the livelihoods of people must be prioritized.” Another participant indicated that if “the erosion issue” was not addressed now, in 10 years, the community would be facing major consequences.
In the specific results that follow, we used the range of -4–4 archetypal scores associated with a given bin in the distribution to describe the relative importance of services. However, scores were not direct ranks because a score of 3 or 4 was assigned to only one service, while 0 was assigned to 5 services, as specified in the distribution used by participants (Figure 2). Low scores should not be construed as a lack of concern for those socioecological services because many participants expressed attitudes that all services were important.
Effect of omitted Q-sorts
Some minor biases in the postengagement Q-sort factors are likely to have resulted from omitting the confounding Q-sorts that were identified by the PQMethod preflagging algorithm. However, because all quantitative results other than the Q-sorts are based on the entire set of responses (e.g., Table 4), this bias is expected to have minimal effect on conclusions. The number of Q-sort responses excluded from the PCA analysis was seven from the pre-engagement and five from the postengagement, with the remaining number being thirty-five and eighteen, respectively. The effect of omitting these Q-sorts on conclusions appears minor in the pre-engagement Q-sort because the mean scores by service type for the included Q-sorts were similar to the mean scores of the total set (Table 5). For the postengagement Q-sort, the mean score for nonconsumptive uses was 0.09 higher for the total set relative to the included set and the mean for nonuses was 0.07 lower, suggesting that some minor biases in factor analysis resulted from this data-screening technique. The number of removed Q-sorts was roughly evenly distributed across the stakeholder types and thus would not be expected to bias interpretations by stakeholder type.
Table 5. Changes in mean Q-sort scores pre- and postengagement for included and omitted Q-sorts

Perspective differences by stakeholder type
Stakeholder representation in perspectives roughly matched hypotheses regarding expected priorities for use and nonuse services, but all groups had diverse membership, suggesting that stakeholder groups were not unidimensional in their concerns (Figure 3). Academic/NGO researchers were overrepresented in the Ecological sustainability group, and local residents were overrepresented in the Community livelihood groups (Tables 2 and 3). Government officials were overrepresented in the Ecological sustainability group for the pre-engagement results but not the postengagement results. However, some differences among stakeholders were only a matter of degree of preference rather than a fundamental difference. As one example, Marsh system vitality over the long term received an archetypal score of 2 by the Community livelihood perspective (pre and post) and a score of 4 in the Ecological sustainability perspective (pre and post).Footnote 1 The Balanced perspective score on this service moved from 3 to 4 pre and post. Thus, this service received consistently high scores across perspectives and stakeholder types but differed in the strength of the preference.

Figure 3. Stakeholder group representation in value perspectives for pre- and postengagement Q-sorts
Some of the consumptive use services highlighted key differences between perspectives. The service Livelihood for watermen was uniformly scored highly by the participants, but the scores were always highest for the Community livelihood perspective (score = 3) and lowest for the Ecological sustainability perspective (score = 1), with the Balanced perspective in between (score = 2). Another defining service was Property value protection, for which the score was substantially higher in the Community livelihood perspective than in either the Ecological sustainability or Balanced perspectives for both the pre- and postengagement Q-sorts. Sustaining active commercial areas (e.g., restaurants) tended to score low across all perspectives, but was, surprisingly, lowest in the postengagement Community livelihood perspective.
The low average scores on the services that involved tourism in the postengagement Q-sort, Sustaining active commercial areas (-4) and Local heritage tourism (-1), reflected a preference by the majority of participants to avoid changing the community character due to increasing commercial tourism activities.Footnote 2 However, scores were dichotomous on these services in the postengagement Q-sort, which revealed a divide among participants who felt a) that the community was better off going it alone or b) that a greater connection to the outside world was needed to sustain the community. The second perspective was aligned with a strategy that was proposed in a working group to enhance tourism and knowledge of the area's unique heritage as a means to garner greater investment by local and state governments in resisting sea level rise in this community. The participants in the Community livelihood perspective appeared to largely reject this idea because scores for commercial activities dropped in the postengagement Q-sort. In contrast to concerns about overt commercialization, many community members expressed favorable attitudes towards the economic contributions and investments made by come-heres, or recently arrived retirees, who have renovated homes or installed shoreline armoring.
Movement pre- and postengagement
The service categories of consumptive use, nonconsumptive use, and nonuse were used to explore the hypothesis that collaborative learning would cause participants, particularly non-scientists, to increase their scores on nonuse services between pre- and postengagement. However, the results indicated a diversity of starting and ending points by individuals that did not neatly fit this hypothesis. When viewed by stakeholder type, nonuse services started out with consistently high rankings across all groups and also dropped in all groups in the postengagement results (Table 6). However, additional evaluation of results highlighted the information lost through this aggregation.
Table 6. Average service scores by stakeholder and service category, pre- and postengagement

Based on a summary of mean scores by service categories and stakeholder type (Table 6 and Figure 4), the largest movement in perspectives between pre- and postengagement occurred as the academic research group scores moved closer to those of the local resident group. Researchers, on average, increased their scores on consumptive use services and decreased them on non-consumptive uses, while nonuse services stayed about the same. In the federal and state government category, the biggest change was a reduction in average nonuse value score, although average values remained high.

Figure 4. Average scores pre- and postengagement by stakeholder type and socioecological service category (consumptive use, nonconsumptive use, or nonuse)
The local residents appeared to have had the least movement on scores pre- and postengagement when aggregated by service categories. However, a service-specific examination of changes (Figure 5) showed that some of the largest changes in average scores in this group were declines in the key consumptive use service of Livelihood for watermen (service 8) and increases in the nonconsumptive use of Marsh study to promote scientific knowledge (service 7). These changes moved the local resident group closer to the scores of academic/NGO researchers, suggesting some alignment of values through the collaborative learning process. The exception to this interpretation was a substantial increase in the service of Attractive natural setting (Service 15) in the local resident group, which remained a low scoring service for other groups.

Figure 5. Average scores for local residents of individual services within services categories for pre-and postengagement
Previous studies had suggested that group interaction could increase the strength of preferences for nonuse values or public goods among the general public (e.g., Niemeyer Reference Niemeyer2004). Our study did not support this idea as nonuse values started out with high scores and dropped after the collaborative process. However, the average scores by service category masked some individual changes that suggested that stakeholder scores became more similar after the collaborative process. Because Q-sort limits the number of high scores that can be assigned to services, the partial alignment of values across stakeholders resulted in some nonuse value scores declining so that use services could be given higher scores. Further, local residents decreased their scores on some consumptive use services and increased their scores on non-consumptive use services, which likely reflected a broadening of thinking in the group about the types of benefits of socioecological services. As one person expressed it, increased understanding of how “the fate of the marshes and the community were intertwined” appears to have moved residents to increase ranks on some specific nonconsumptive uses.
A factor that potentially confounded our test of this hypothesis was that the group was not a randomly selected group and thus may have been biased towards people who began the process with relatively high values for social benefits. However, multiple methods were used to limit bias by recruiting members of diverse community subgroups to provide broad representation. The group also included people who accepted compensation to participate, in addition to volunteer participants, which sustained engagement of people who otherwise would not have been able to participate due to conflicting economic obligations.
Possibilities and limits of using Q-sort for assessing tradeoffs
Following the traditional use of Q-sort, we did not ask participants to consider explicit tradeoffs between socioecological services. Many of the services could compatibly co-occur, but some could come into conflict as a result of the proposed marsh restoration or shoreline protection strategies. To explore tradeoffs through Q methodology, we considered nuances of preferences revealed through different language. The list of socioecological services we used in the Q-sort purposely included similar or overlapping services with different wording. We found, for example, that the service Attractive natural setting initially scored much lower than Seeing nature and wildlife, seemingly representing a preference for a more tangible service that residents can enjoy. Similarly, Livelihood for watermen was consistently preferred to Locally caught seafood for sale, even though these services can be related. However, because catch is sold throughout the region and country, this preference clarified that the economic returns to fishing (and the community that they support) were seen as more important than providing for local consumption.
These Q-sort results were consistent with discussions that revealed that, as a group, residents 1) valued the ability of the marsh to attract and support wildlife somewhat more than its open space aesthetics and 2) prioritized benefits to their community over benefits for others. The decision implications of these and other findings were that marsh restoration that supported wildlife and was compatible with sustaining the community would be more acceptable to residents than plans that protected the marsh at the expense of either wildlife (e.g., seawalls) or altered the current non-commercial character of the community.
Some specific tradeoffs were not easily revealed through the Q-sort exercise but were raised by participants in discussions. A primary concern for a few participants was that although marsh restoration might increase waterfowl for hunting and increase accessibility of fish, it might also might increase mosquito populations.Footnote 3 The Q-sort results showed that the service Natural mosquito control (from marsh ecosystem) had an archetypal score of 0 (medium priority) in one perspective each in the pre and postengagement rounds (Community livelihood or Balanced/Sustainable) and negative scores (-1 or -2 or relatively low priority) in the other perspectives. Thus, scoring showed a moderate to low level of concern and revealed that this issue was not a major concern for the majority of participants.Footnote 4 Another concern that could have been overlooked if the Q-sort results had been used without small group discussions was that regulations aimed at protecting the marsh, such as limiting the use of shoreline berms, were a concern to local residents because they could hinder the community's ability to protect elements of heritage, such as cemeteries. The Q-sort we developed addressed tradeoffs in a limited way but the method could be modified to address more specific preferences of how best to adapt to or manage climate change risks.
Conclusions
The Q-sort method that we applied was a blend of approaches from cultural anthropology and economics that served to enrich our understanding of the strength of preferences for a broad set of socio-cultural services. We found the combination of discussions and ranking exercises complemented each other to provide understanding of the depth and breadth of concerns. The qualitative rankings were an efficient approach to summarizing these concerns and describing differences and commonalities among stakeholder groups.
The Q-sort approach revealed that perspectives on socioecological services in the stakeholder group representing this coastal fishing community fell roughly along a spectrum from high scores on intangible benefits to high scores on tangible benefits. Stakeholder groups (residents, academic/NGO researchers, and government officials) were distributed broadly on this spectrum. However, patterns were somewhat predictable in that residents were more likely to be in the group that put a higher priority on local economic well-being and property protection and academic/NGO researchers were more likely to be in the group that prioritized marsh condition and associated intangible benefits. Nonetheless, differences among perspectives often resulted from small differences in socioecological service ranks, rather than fundamental disagreements.
The collaborative learning process caused the goals of stakeholders to align to some extent, even though this was not the intent of the project. The alignment was due to researchers raising their scores on services of most concern to local residents and residents raising their scores on the service of Marsh study to promote scientific knowledge and reducing scores on the key service of Livelihood for watermen. Overall, these results suggested that intensive engagement can lead to greater appreciation of alternative perspectives but not major changes in values.
The Q-methodology was useful for exploring values, while still retaining the variety of individual perspectives needed to design resilience strategies acceptable to diverse stakeholders. For example, strategies to increase capital for restoration by promoting tourism turned out to be widely disliked by local community members. This finding was enriched by ethnographic field methods that revealed that the community's strong faith, self-reliance, and ethic of cooperation were sources of resilience that could be threatened by increased outside influences (Johnson Reference Johnson2016).
We found the primary advantage of using Q methodology was the ability to provide a quantitative interpretation of qualitative preference information in a time-efficient manner. Further, most participants found it relatively easy to conduct the Q-sort, suggesting that it may have lower cognitive difficulty relative to some other types of elicitation approaches. Results also provided quantitative outputs that were tested using qualitative/ethnographic data to produce deeper and more integrated insights beyond what each approach could produce alone. Because the method, in general, largely retains the language used by stakeholders to describe benefits, it helps ensure that participant concerns have been evaluated and that concerns are recognizable in the results. Finally, the relative ease of this method suggests that systematic collection and presentation of qualitative preference data are within reach and could be used to complement monetary valuation to support inclusive coastal governance.


 Open access