


Introduction
The pioneering work of Baldwin has demonstrated the importance of mathematical modeling of nutritional processes. In dairy ruminant nutrition modeling, several complete models have been proposed by Baldwin et al. (Reference Baldwin, France and Gill1987a, Reference Baldwin, France, Beever, Gill and Thornleyb and Reference Baldwin, Thornley and Beeverc and 1995), Danfaer (1990, Reference Danfær, Huhtanen, Udén, Sveinbjörnsson and Volden2005a and Reference Danfær, Huhtanen, Udén, Sveinbjörnsson and Voldenb), Paul (Reference Paul1990) and Smith (Reference Smith1970). The development of these models was made possible by the accumulation of experimental data concerning size and turnover of tissue and metabolic compartments and also data related to metabolic flows. However, all these models have a major limitation which is the representation (or lack thereof) of the regulatory subsystem of metabolism (Sauvant, Reference Sauvant1994 and Reference Sauvant1996). Therefore, the objective of the present work was to develop a mathematical model of metabolism during lactation, which includes a theoretical regulatory subsystem. The aim of this whole animal, dynamic and mechanistic model was to link the kinetics of dry matter intake, milk yield and live weight throughout the course of lactation with a minimal active structure, which allows digestive flows, metabolic pathways and milk composition to be simulated during lactation. An empirical model was used to describe feeding pattern and the lactation curve, and a theoretical drive for the balance between tissue anabolism and catabolism was used. Using these features at defined levels of milk production, the model provided a mechanistic representation of the animal’s metabolism. Thus, in our model, an empirical regulatory sub-system was associated with a mechanistic operating sub-system based on the representation of the flows of six major pools of metabolites through eight major anatomical modules. A 4-min time step of integration was chosen, which is consistent with the high turnover rate of metabolites such as plasma NEFA. However, model outputs were pooled into daily means.
The principles described in this paper are valid for all lactating ruminants although the calibration of the parameters was only considered for the dairy cow. The basic principles behind this model have been published by Sauvant and Phocas (Reference Sauvant and Phocas1992).
Material and methods
Model conception and description
General principles
The organism was considered as a compartmental system including two major sub-systems connected by flows of information (Sauvant, Reference Sauvant1992 and Reference Sauvant1994). The operating sub-system was made up of tissue compartments, pools, and flows of digesta and metabolites. The regulatory sub-system used internal auxiliary variables that control metabolic flows. Since the present work focused on the long-term aspects of lactation, mainly homeorhetic controls (Bauman and Currie, Reference Bauman and Currie1980) were included in the model although several homeostatic systems of regulation were also introduced. Therefore, in the present version of the model and based on the above-mentioned principle, the model aims to simulate major metabolite flows and the resulting evolution in body weight associated with a given pattern of feed intake and milk production. An empirical model was used to create standard intake and lactation curves.
Model modules, compartments and flows
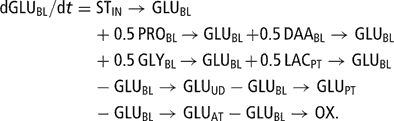
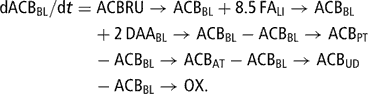
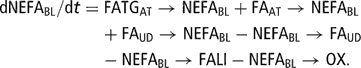
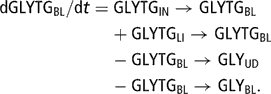
The model was subdivided into eight major modules corresponding to anatomical components: rumen (RU), intestines (IN), blood plasma and lymph (BL), protein tissue (PT), adipose tissue (AT), liver (LI), udder (UD) and uterus (UT). The milk synthesized in the udder and stored in the mammary gland cisterns (MI) was defined as a specific module of the model as well. These sub-sections encompassed compartments or metabolite pools (Table 1). Pools of the same metabolite can be present in different model modules (e.g. glucose in BL, AT, PT and UD), and a metabolite can occur in different forms (e.g. amino acids in proteins, free or deaminated). The main metabolites represented in the model are glucose (GLU), amino acids (AA), acetate–butyrate (ACB), which combines acetate and the pool of 4-carbon molecules considered to be metabolically similar to acetate (butyrate, β-OH-butyrate, aceto-acetate), triglycerides (TG) and fatty acids (FA). Lactose (LA), lactate (LAC), propionate (PRO) and glycerol (GLY) were also included in the metabolic pathways described in the model. Flows of metabolites within and between modules were either transfer flows of a metabolite (e.g. TG release from liver to blood plasma denoted TGLI→TGBL) or conversion flows of a metabolite (e.g. milk lactose synthesis in the udder from glucose denoted GLUUD→LAMI). A flow was systematically expressed in the units of the starting compartment, a conversion factor being applied to the receiving compartment if necessary.
Table 1 Components of the model: anatomic modules and metabolite pools

†BL = blood and lymph, LI = liver, AT = adipose tissue, PT = protein tissue, UT = uterus, UD = udder, MI = milk.
‡▪: standard compartment, □: ’zero pool’ compartment, : sink compartment.
The blood plasma and lymph, liver, adipose tissue, protein tissue, uterus and udder modules were considered as sub-parts of the model through which metabolic pathways involved in milk production and animal maintenance metabolism occurred. The rumen and intestines are the only modules where nutrients can enter the metabolic pathways, and the milk module is the sink for the lactation process. Inputs to the mechanistic part of the model were rumen volatile fatty acids (VFAs; ACB and PRO) and intestinally absorbed major nutrients (GLU, AA and FA). Since depicting the digestive process was not the main focus of the current model, it was considered in a very simple way using recent empirical equations. Except for the zero pools, the dynamic behavior of each compartment was modeled with differential equations depicting these flows.
Model calibration
Given the evolution in intake and milk yield throughout lactation, model calibration (i.e. assigning values to model parameters) was performed to achieve realistic blood concentrations of AA, GLU, ACB, TG and NEFA together with realistic milk fat and protein content. The aim was not to yield a reliably accurate simulation but to match the standard behavior of the system and to generate compatible results.
Oxidative flows were either a priori fixed or built by fitting procedures in order to equilibrate inflows and outflows of a ‘zero pool’ compartment. In addition, general knowledge of dairy cow physiology was used to define reality constraints, for example concerning the proportion of de novo fatty acid synthesized in adipose tissue or relative contributions of precursors to liver gluconeogenesis. Moreover, empirical functions were introduced in order to stabilise the model’s behavior whatever the level of milk production (assuming a predefined potential ranging from 2000 to 11 000 kg 305-day milk yield). Due to space limitations and its heuristic, cyclic and ‘by trial and error’ nature, the work performed to complete the whole model calibration is not described in the present paper. Thus, several values for parameters are given in equations without giving details on how they were obtained.
Model simulation
The dynamic simulation was performed with Modelmaker 4.0 (Modelkinetix, Oxford). The model diagram, the listing of the model equations, the run options and the table of the parameter values in ModelMaker are available as an appendix at http://www.animal-journal.eu/. Numerical integration of differential equations was completed with Runge–Kutta’s method with a fixed step of integration of 1/360 = 2.778 10−3 day, which corresponds to a 4-min interval. In the model, the independent variable t indicates days in milk ranging from 1 to 300 days after calving. Initial values were given for t = 0, at calving. State variables characterising compartment size were expressed in mol and flows characterizing exchanges between compartments were expressed in mol/day. The model simulated the major metabolic traits of a ‘standard multiparous cow’ weighing 620 to 660 kg after calving (550 kg empty body and 70–110 kg gut fill according to level of feed intake) and producing between 10 and 50 kg/day of raw milk yield (RMY, kg/day) at the peak of production according to its potential. The cow received a mixed diet of forage and concentrate (Table 2). The proportion of concentrate (CO, kg/kg DM (1)) was of 50% of diet dry matter during the first month of lactation; thereafter, it decreased at a constant rate of approximately 0.15% per day finishing at 8% after 300 days of lactation (the proportion of forage was FO = 1 – CO). The following continuous model was used to simulate this classical scheme of concentrate distribution:
Table 2 Characteristics of the diet

†OM = organic matter, NDF = neutral-detergent fibre, ST = starch, CP = crude protein, EE = ether extract, OMD = OM digestibility.
‡Assumed digestibility of crude protein and starch.
Animal characteristics
Standard feed intake curve
The alternative form of the Wood (Reference Wood1967) model proposed by Dhanoa (Reference Dhanoa1981) was used to simulate the curve of dry matter intake (DMI, kg/day (2)) according to the milk potential expressed as POT, which was an index equal to 10−1 times the maximum RMY (1 < POT < 5). The relationship between maximum DMI and POT, and mean values for the time of peak DMI (parameter b) and the decrease in DMI after the peak (parameter c) were derived from the database described by Martin and Sauvant (Reference Martin and Sauvant2002). Finally, the following equation system was used and assumed to provide realistic DMI curve associated with milk potential, which varied between 10 and 50 kg at peak (Figure 1):
with
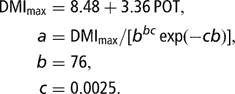

Figure 1 Standard dry matter intake (DMI) curves throughout lactation for increasing values of milk potential (POT = 1, 2, 3, 4, 5).
Standard lactation curve
The Dhanoa (Reference Dhanoa1981) model was also used to simulate the curve of RMY (3) according to POT. The relationship between POT and the time of lactation peak (parameter e), and mean value for the decrease in RMY after the peak (parameter f) were derived from the database described in Martin and Sauvant (Reference Martin and Sauvant2002). Finally, the following equation system was used and assumed to provide realistic RMY curves associated with milk potential, which varied between 10 and 50 kg at peak (Figure 2):
with


Figure 2 Standard milk yield (RMY) curves throughout lactation for increasing values of milk potential (POT = 1, 2, 3, 4, 5).
Equations (2) and (3) allowed the simulation of typical, consistent patterns of DMI and RMY curves for different levels of milk production. These models were found to be in good agreement with classical published kinetics of intake and production, for example by Faverdin et al. (Reference Faverdin, Hoden and Coulon1987). Moreover, the overall scatter plot of simulated values of RMY v. DMI was close to that published by Hristov et al. (Reference Hristov, Price and Shafii2004). The model (3) simulated an increase of 232 kg in 305-day RMY when peak RMY increased by 1 kg. This is consistent with the values cited by Young (2002).
Body system
Auxiliary variables were used to compute the weight of body modules corresponding to tissue components implicated in body weight changes during lactation: adipose tissue and protein tissue, and, to a lesser extent, the uterus. The weight of lipids in adipose tissue (LIPAT, kg (31)) was derived from the quantity of stored TG in adipose tissue (TGAT, mol (32)), assuming a molar weight of 810 g/mol for TG. The weight of protein in protein tissue (PRTPT, kg (48)) and in the uterus (PRTUT, kg (60)) was derived from the quantity of AA stored in protein tissue (AAPPT, mol (49)) and the uterus (AAPUT, mol (61)), assuming a molar weight of 110 g/mol for polymerised AA. It was assumed that the empty body at calving was chemically composed of 113 kg lipid (LIP = LIPAT), 95 kg protein (PRTPT = 93 kg, PRTUT = 2 kg, PRT = PRTPT + PRTUT), 25 kg ash (ASH, kg (4)) and 319 kg water (H2O, L (5)). This composition, which corresponds to a mean body condition score (BCS ~ 3.0 on a 0–5 scale), was determined using the model proposed by Martin and Sauvant (Reference Martin and Sauvant2005). The following formulas, derived from Martin and Sauvant (Reference Martin and Sauvant2005), were used throughout the course of lactation to modify the empty body water and ash weights according to changes in empty body protein. The empty body weight (EBW, kg (6)) was calculated by summing the weights of body components:
The live weight (LW, kg (8)) was then calculated using both EBW and expected changes in gastrointestinal fill related to intake. The digestive tract contents (DTC, kg (7)) were predicted from NDF intake (NDFI, kg/day) using the equation published by Martin and Sauvant (2003) with a mean time post-feeding of 6 h:
From a literature review, blood plasma volume (PLV, L (9)) and lymph volume (LYV, L (10)) were assumed to average 10% H2O and 25% H2O, respectively; the remaining 65% H2O was intracellular water:
The blood plasma concentrations of GLU ([GLUBL], mmol/l (11)), NEFA ([NEFABL], mmol/l (12)), TG ([TGBL], mmol/l (13)) and AA ([AABL], mmol/l (14)) were calculated:
The blood plasma and lymph ACB concentration ([ACBBL], mmol/l (15)) was calculated:
Mammary blood flow (MBF, l/day (16)) was predicted from RMY using the following equation obtained by a re-evaluation of the model proposed by Lescoat et al. (Reference Lescoat, Danfaer and Sauvant1996)
This equation allows the simulation of daily udder nutrient extraction rate associated with specific realistic values of RMY and MBF.
Nutritional inputs
Ruminal production and absorption of volatile fatty acids
There is at the present time no generally accepted method to simply predict the flow of VFA absorption from dietary parameters. We compared five simple methods that could be used (Sauvant, Reference Sauvant1996). There were fairly large differences between the simulated values calculated by the different methods. One of the methods was chosen for the present model because it used the partitioning of OM digestibility, which is well documented. In order to calculate VFA production, a table of estimations proposed by Vermorel (Reference Vermorel1978) and inspired from the data of Murphy et al. (Reference Murphy, Baldwin and Koong1982) was transformed into equations. VFA production was predicted from dietary organic matter content (OM, kg/kg DM, see Table 2), from whole tract diet OM digestibility (OMD = CO·OMDCO + FO·OMDFO, kg/kg DM, see Table 2), and from DMI as estimated above. The equations to predict the flow of absorbed acetate (including butyrate or β-OH-butyrate) from rumen to blood (ACBRU→ACBBL, mol/day (17)) and the flow of absorbed propionate (including LAC produced from PRO) from rumen to blood (PRORU→PROBL, mol/day (18)) were:
Equations (17) and (18) produced realistic values of the ruminal molar ratio ACB/PRO (Sauvant, unpublished). The coefficients 0.7 and 0.8 used, respectively, in (17) and (18) took into account the VFA metabolised by the rumen wall. Values obtained for ACBRU→ACBBL and PRORU→PROBL were well within the range of VFA absorbed per kg of digestible dry matter as proposed by Sutton (Reference Sutton1985) based on a literature review. Minor VFA were not considered in this model and VFA production from starch and fibre in the hindgut was considered to be negligible.
Intestinal absorption of glucose
The flow of absorbed glucose from the intestine to blood (STIN→GLUBL, mol glucose per day (22)) was estimated using four calculation steps based on the starch content of diet (ST = CO STCO + FO STFO, kg/kg DM, see Table 2). Firstly, ruminal starch digestibility (STDR, kg/kg (19)) was calculated from dietary starch in sacco effective degradability (STd = (CO STCO STdCO+FO STFO STdFO)/ST, kg/kg, see Table 2) with STd for both concentrate and forage obtained from in sacco kinetics (Offner and Sauvant, Reference Offner and Sauvant2004b) and from DMI in terms of percentage LW. Secondly, non-ruminally digestible (by-pass) starch flow (STBP, g/day (20)) was then calculated from DMI and small intestinal starch digestibility (STDI, g/g (21)) using the equation published by Offner and Sauvant (Reference Offner and Sauvant2004b) from STBP and DMI. Finally, STIN→GLUBL (mol/day (22)) was predicted assuming a molar weight of 180 g/mol for glucose:
The proportion of GLU flow metabolised by the intestinal wall was assumed to be constant and equal to 25%. However, it probably varies according to the amount of GLU absorbed.
Intestinal absorption of amino acids
The calculation of absorbed AA flow from the intestine to blood (AAIN→AABL, mol/day (26)) was based on the equations of the French PDI system (Vérité et al., Reference Vérité, Michalet-Doreau, Chapoutot, Peyraud and Poncet1987). Thus, the non-ruminally degradable (by-pass) AA flow (AABP, g/day (23)) was predicted from DMI, dietary crude protein content (CP = CO CPCO + FO CPFO, kg/kg DM, see Table 2), and dietary crude protein effective degradability (CPd = (CO CPCO CPdCO + FO CPFO CPdFO)/CP, kg/kg, see Table 2) with CPd for both concentrate and forage obtained from in sacco kinetics:
The duodenal microbial AA flow (AAM, g/day (25)) was predicted from ruminal fermentable OM (RFOM, g/day (24)) calculated as follows :
where EE was the dietary ether extract content (EE = CO·EECO + FO EEFO, kg/kg DM, see Table 2). The influence of silage organic acid content was considered to be negligible. However, as proposed by Tamminga et al. (Reference Tamminga, van Straalen, Subnel, Meijer, Steg, Wever and Blok1994), by-pass starch was taken into account. Thus, using an average of 145 g AA per kg RFOM:
Finally, AAIN→AABL was predicted assuming a molar weight of 110 g/mol for AA, a proportion of 0.80 for AA in microbial crude protein, and intestinal digestibilities of 0.80 and 0.85 for microbial and by-pass dietary proteins, respectively.
The absorbed AA flow was the sum of AA flows from microbial and dietary sources. This implies that N recycling through urea was sufficient to maintain a normal level of microbial activity. It was also assumed that only 70% of intestinal digestible protein was available in the blood circulation, the remaining 30% being lost across the portal-drained viscera (Hanigan et al., Reference Hanigan, Cant, Weakley and Beckett1998).
Intestinal absorption of triglycerides
In the model, TG were not considered as such, but estimated via the GLY moiety and FA. Thus, GLY and FA were either incorporated into TG (GLYTG and FATG) or free (GLY and FA). The notation NEFA was used for the blood-plasma-free fatty acid pool (NEFABL) while the notation FA was used for the liver, adipose tissue and udder zero-pools (FALI, FAAT and FAUD). The absorbed TG flow from the intestine to blood (FATGIN→FATGBL, mol/day (28) and associated GLYTGIN→GLYTGBL, mol/day (79)) was calculated by using the equation published by Sauvant and Bas (Reference Sauvant and Bas2001) from a literature review. The equation predicts duodenal by-pass fatty acid flow (FABP, g/day (27)) from dietary FA content (FA = 0.98COEECO + 0.43FOEEFO, kg/kg DM, see Table 2) and DMI. The value of FA was estimated from the dietary ether extract content using a ratio FA/EE of 0.43 and 0.98 for forage and concentrate feeds, respectively (Sauvant et al., Reference Sauvant, Perez and Tran2002). Finally, FATGIN → FATGBL was predicted assuming a molar weight of 270 g/mol for FA and a mean digestibility of FA of 75% in the small intestine:
Body reserves
Regulatory sub-system
The concept of the regulatory sub-system was based on the hypothesis that there exist two directly connected theoretical hormones for mobilisation (HM (30)) and anabolism (HA). The values for the variables HM and HA were between 0.1 and 1. HM and HA were assumed to be proportional to the biological effects of homeorhetic hormones involved in mobilisation and anabolism, respectively. Moreover, HM and HA were linked by the following relationship:
The hyperbolic nature of this relationship indicates that high levels of mobilisation and anabolism cannot occur simultaneously. This principle is consistent with data of Robelin and Chilliard (Reference Robelin, Chilliard and Rémond1984). Inspired by the approach of Neal and Thornley (Reference Neal and Thornley1983), it was assumed that the hormone HM presented an exponential decay as a function of time throughout lactation:
where
The coefficients f 1 and f 2, were built to be dependent on milk potential (POT), inducing a higher level of HM at t = 0 (HMt = 0) and a slower decrease in HM with increasing values of POT. The function, f 1, which controls the value HMt = 0 linearly, depends on POT assuming that HMt =0 = 1 when POT = 5 (RMY = 50 kg/day at peak). Moreover, this implies that HMt = 0 decreased linearly by 0.1 units when POT decreased by 1 unit. The control of the rate of decay of HM by the function, f 2, was conceived to be consistent with the fact that the length of the mobilisation phase is related to the potential milk yield (Faverdin et al., Reference Faverdin, Hoden and Coulon1987). Hence, the basic assumption was made that the time T HM = HA at which HM = HA = √0.1 (with respect to (29)) was proportional to POT (T HM = HA = 8 POT) and f 2 was defined accordingly (1.426 = −ln((√0.1 – 0.1)/0.9)). The value of 8 was applied to produce realistic patterns of EBW kinetics (Figure 14) reaching a minimum between weeks 4 and 12 of lactation (Martin and Sauvant, Reference Martin and Sauvant2002). Figure 3 indicates the pattern of HM and HA throughout lactation for increasing values of POT (1 to 5).

Figure 3 Pattern of theoretical anabolic (HA) and mobilisation (HM) hormones throughout lactation for increasing values of milk potential (POT = 1, 2, 3, 4, 5).
Adipose tissue metabolism
The sub-model diagram of adipose tissue metabolism is presented in Figure 4. Body lipids were assumed to be stored in adipose tissue as triglycerides (TGAT, mol (32)), their molar weight was fixed at 810 g/mol. Thus, at t = 0, LIPAT(t = 0) = 113 kg corresponding to TGAT(t = 0) = 139.5 mol:

Figure 4 Model diagram of adipose and protein tissue metabolism.
The stored TG pool in adipose tissue varied according to the balance between body lipid catabolism (cTGAT, mol/day (33)) and anabolism (aTGAT, mol/day (34)):
The catabolic flow of TG was proportional to TGAT and assumed to be driven by HM:
This equation allowed the calculation of a fractional turnover of TG (lipolysis) between 0.003 and 0.03 per day. This range of values is consistent with the values published by Riis (Reference Riis1983) and that of 0.02 per day in the model of Baldwin et al. (Reference Baldwin, France and Gill1987a).
The anabolic flow of TG was assumed to be proportional to HA and to the amount of stored TG at time zero (TGAT(t = 0)), which was considered to be a fixed value:
The two flows describing adipose tissue anabolism and catabolism were split up into the corresponding flows of their TG components, i.e. the glycerol skeleton (GLYAT →GLYTGAT (36) and GLYTGAT → GLYBL (47)) and the FA chains (FAAT → FATGAT (35) and FATGAT → NEFABL (46)), with the stoechiometry of 1 mol GLY and 3 mol FA per mol TG. Anabolic flows involved ‘zero pools’ of adipose tissue FA (FAAT) and GLY (GLYAT):
The anabolic process leading to TG storage in adipocytes was assumed to be the driving force of blood metabolite removal by AT. The metabolites removed from blood by adipose tissue were FA (37), ACB (40) and GLU (43).
The FA inflow (FATGBL → FAAT (37)) was due to the hydrolysis of blood TG by lipoprotein lipase:
It was assumed that a proportion (1−K SYN) of FA fixed in stored TG came from blood FA, the remaining proportion (K SYN) was synthesised from ACB chains (ACBAT → FAAT (41)). In addition, it was assumed that 90% of the FA released by hydrolysis of blood TG were actually used by adipocytes for TG storage, while the remainder entered the blood NEFA pool (FAAT → NEFABL (38)):
The glycerol released by the hydrolysis of blood TG entered in its entirety the blood GLY pool (GLYTGBL → GLYBL (80)) without passing through the adipose tissue GLY pool. The flow of FA derived from blood TG hydrolysis was thus built to include FA intended for TG storage and FA not used by adipocytes. The parameter K SYN (39) was a sigmoidal decreasing function of the blood plasma TG concentration ([TGBL], mol/l (13)).
The equation yielded values ranging from 0.05 to 0.75. This enabled our model to regulate blood plasma TG concentrations and to inhibit de novo FA lipogenesis in early lactation. This is consistent with in vitro observations in dairy (McNamara and Hillers, Reference McNamara and Hillers1986; McNamara and Baldwin, Reference McNamara and Baldwin2000) and beef cows (Mills et al., Reference Mills, Lemenager and Horstman1989).
The ACB removed from blood (ACBBL → ACBAT (40)) provided carbon chains for de novo FA synthesis (ACBAT →FAAT (41)) with a conversion factor of 8.5 mol ACB per mol FA synthesised, and was locally oxidised (ACBAT → OX (42)), thus contributing to adipocyte energy expenditure (assuming 0.5 mol ACB oxidised per mol ACB converted to FA):
The GLU removed from blood (GLUBL → GLUAT (43)) provided carbon atoms for glycerol skeletons (GLUAT →GLYAT (44)) and NADPH via glucose oxidation (GLUAT → OX (45)), with 1 mol GLU oxidised per 2 mol GLU converted to GLY:
The glycerol and the FA released by adipose tissue TG catabolism entered NEFA (FATGAT → NEFABL (46)) and GLY (GLYTGAT → GLYBL (47)) blood plasma pools:
The compartments GLUAT, GLYAT, FAAT and ACBAT were ‘zero pool’ compartments, the sum of inputs being equal to the sum of outputs, and were built in order to partition flows correctly.
Protein tissue metabolism
The sub-model diagram of protein tissue metabolism is presented in Figure 4. The mean molar weight of AA stored in protein tissue (AAPPT, mol AA (49)) was fixed at 110 g/mol. Thus, at t = 0, PRTPT(t = 0) = 93 kg corresponding to AAPPT(t =0) = 846.4 mol:
The stored AA pool in protein varied according to the balance between AA flows of protein catabolism (cAAPPT, mol/day (50)) and anabolism (aAAPPT, mol/day (51)):
The catabolic flow of AA was proportional to AAPPT and assumed to be driven by HM:
The anabolic flow of AA was not dependent on the plasma AA pool, but was proportional to HA and to the body protein pool at time zero (AAPPT(t = 0)) and considered to be a set value:
As in the case of AT, the anabolic process leading to AA storage in protein tissue was assumed to be the driving force of blood metabolite removal by protein tissue. The metabolites removed from blood by protein tissue were AA, GLU and ACB.
The uptake of AA from blood was only for protein storage (AABL → AAPPT (52)).
The inflows of GLU and ACB, denoted, respectively, as GLUBL → GLUPT (53) and ACBBL → ACBPT (54), were assumed to be proportional to the protein tissue AA pool and were to cover protein tissue turnover and energy maintenance requirements:
It was assumed that the production of LAC by protein tissue was equal, on a molar basis, to glucose removal. That meant that 50% of GLU was recycled through LAC production (GLUPT → LACPT (55)), the remainder being oxidised (GLUPT → OX (56)):
All the recycled LAC was then used in gluconeogenesis (LACPT → GLUBL (57)):
The AA released by protein catabolism entered the blood AA pool (AAPPT → AABL (58)):
The compartments ACBPT, GLUPT and LACPT were ‘zero pool’ compartments, the sum of inputs being equal to the sum of outputs, and were built in order to partition flows correctly.
Uterine involution
Initial simulations showed that AA mobilization was insufficient to cover udder demand, particularly in early stages of lactation. It was assumed that this could be due to the fact that uterine involution was ignored at the onset of lactation. Therefore, the uterus compartment was modeled (UT, kg (59)) and was considered to be a pool of protein (PRTUT, kg (60)). It was assumed that the uterus weighed 2.2% EBW after parturition with a crude protein content of 16% (Ferrell et al., Reference Ferrell, Garrett and Hinman1976; Andrew et al., Reference Andrew, Waldo and Erdman1994). As in (48), the mean molar weight of AA stored in uterine protein tissue (AAPUT mol (61)) was fixed to 110 g/mol. Thus, at t = 0, PRTUT(t = 0) = 1.9 kg, UT(t = 0) = 12.1 kg and AAPUT(t = 0) = 17.6 mol:
The uterine involution process was modeled using data from Gier and Marion (Reference Gier and Marion1968). Thus, the release of AA from uterus to blood (AAPUT → AABL (60)) was proportional to the size of the AAPUT compartment when AAPUT was greater or equal to its normal non-gravid size.
With this formula, uterine involution was complete after 5 weeks of lactation and the uterus had returned to its basic weight of 1 kg (UT = 1 kg, PRTUT = 0.16 kg, AAPUT = 1.5 mol AA).
Body lipid and protein kinetics
The values of coefficients in equations driving catabolism and anabolism of body lipids and proteins, respectively, (33), (34), (50) and (51) were fixed to obtained a realistic evolution in empty body weight and composition for the standard lactation (POT = 3). Thus, the shape of the evolution in EBW was controlled so that it was close to an average curve as derived from results of a meta-analysis of lactation kinetics (Martin and Sauvant, Reference Martin and Sauvant2002). Moreover, based on data of Komaragiri et al. (Reference Komaragiri, Casper and Erdman1998), Komaragiri and Erdman (Reference Komaragiri and Erdman1997), Gibb et al. (Reference Gibb, Ivings, Dhanoa and Sutton1992), Chilliard et al. (Reference Chilliard, Cissé, Lefaivre and Rémond1991), Butler-Hogg et al. (Reference Butler-Hogg, Wood and Bines1985), Martin and Ehle (Reference Martin and Ehle1984) and Belyea et al. (Reference Belyea, Frost, Martz, Clark and Forkner1978), it was assumed that the LIP and PRT compartments reached a minimum of, respectively, 65% and 90% of their initial pre-calving value during a standard lactation. Additionally, it was assumed that calving EBW was recovered by 300 days of a standard lactation. Given these assumptions for POT = 3, the patterns of the kinetics of LIP and PRT for values of POT smaller or greater than 3 were calculated by the theoretical model proposed for catabolism and anabolism influenced by HM and HA. These patterns were considered to be satisfactory as can be seen in Figures 5 and 6 showing the evolution of lipid and protein masses, respectively, simulated by the model for increasing values of POT together with data from the literature (previously mentioned references plus: Bath et al., Reference Bath, Ronning, Meyer and Lofgreen1965; Chilliard, Reference Chilliard1987; McGuffey et al., Reference McGuffey, Basson and Spike1991; Andrew et al., Reference Andrew, Waldo and Erdman1994). Finally, the model yielded a decrease in EBW ranging from 37 to 134 kg for increasing values of POT. This corresponds to 47% lipids, 11% protein, 38% water and 3% ash.

Figure 5 Evolution of the size of the body lipid compartment (LIP, kg) throughout lactation for increasing values of milk potential (POT = 1, 2, 3, 4, 5) together with data from literature (see text for references).

Figure 6 Evolution of the size of the body protein compartment (PRT, kg) throughout lactation for increasing values of milk potential (POT = 1, 2, 3, 4, 5) together with data from literature (see text for references).
Blood plasma metabolite compartments and flows
Blood plasma propionate
Metabolic pathways of blood plasma PRO are shown in Figure 8. The blood plasma propionate pool (PROBL) was considered as a ‘zero pool’ compartment, assuming that 80% of the propionate inflow from ruminal absorption (PRORU → PROBL (18)) was involved in gluconeogenesis with a conversion factor of 2 mol PRO per 1 mol GLU (PROBL → GLUBL (63)), the remaining 20% being oxidised (PROBL → OX (64)):
Blood plasma glucose
Metabolic pathways of blood plasma GLU are shown in Figure 7.

Figure 7 Model diagram of glucose (GLU) metabolism.
The differential equation of the blood plasma GLU pool (GLUBL (65)) was
The initial size of GLUBL was fixed at 0.074 mol, which corresponds to [GLUBL] = 2.3 mmol/l.
The blood plasma glucose pool was fed by five inflows, one from intestinal absorption of digested dietary starch (STIN → GLUBL (22)) and four derived from metabolites involved in liver gluconeogenesis: PRO (PROBL → GLUBL (63)), deaminated AA (DAABL → GLUBL (88)), GLY (GLYBL → GLUBL (83)) and endogenous LAC produced by protein tissues (LACPT → GLUBL (57)). Four outflows were considered, corresponding to the glucose removed from this pool by the udder (GLUBL → GLUUD (105)), by protein tissues (GLUBL → GLUPT (53)), by adipose tissue (GLUBL→GLUAT (43)) and by oxidation processes (GLUBL → OX (66)). The rate of blood plasma GLU oxidation, summing the overall oxidation processes, was modeled by mass action kinetics, in which the rate factor is described by an increasing sigmoid function of blood plasma concentration ([GLUBL], mmol/l (11)). This equation allowed glucose to be spared during hypoglycemia: the rate factor of oxidation at [GLUBL] = 2.0 mmol/l represented about 30% of its value at [GLUBL] = 2.5 mmol/l:
Blood plasma and lymph acetate + butyrate
Metabolic pathways of blood plasma and lymph ACB are shown in Figure 8.

Figure 8 Model diagram of acetate + butyrate (ACB) and propionate (PRO) metabolism.
The differential equation of blood plasma and lymph ACB pool (ACBBL (67)) was
The initial size of ACBBL was fixed at 0.234 mol, which corresponds to [ACBBL] = 2.1 mmol/l.
The blood and lymph ACB pool originated from three sources. The first one was ruminal (ACBRU → ACBBL (17)). The second inflow came from the partial liver oxidation of NEFA (FALI → ACBBL (68)). It was the NEFA remaining after liver uptake (NEFABL → FALI (73)) for liver TG synthesis (FALI → FATGLI (92)) and which had not been completely oxidized (FALI → OX (94)). A proportion K FALIOX (95) of NEFA not involved in liver TG synthesis was completely oxidized, the remaining proportion 1−K FALIOX being converted to ACB using a factor of 8.5 mol ACB per 1 mol FA:
The third inflow of ACB (DAABL → ACBBL (69)) was derived from hydrolysed ketogenic AA representing the flow of deaminated AA (AABL → DAABL (85)) not involved in gluconeogenesis (DAABL → GLUBL (88)), and assuming that each ketogenic AA provided four carbon units:
Acetate was removed by the udder (ACBBL → ACBUD (1 1 1)) to contribute to milk FA synthesis and to local oxidation (see udder part). It was also removed by peripheral non-mammary tissues: body protein (ACBBL →ACBPT (54)) and adipose tissues (ACBBL → ACBAT (40)). Acetate was also oxidised (ACBBL → OX (70)) in the major tissues according to a daily rate proportional to POT:
Blood plasma non-esterified fatty acids
Metabolic pathways related to NEFA are shown in Figure 9. The NEFA pool was ignored in the models published for the cow (Baldwin et al., Reference Baldwin, France and Gill1987a, Reference Baldwin, France, Beever, Gill and Thornleyb and Reference Baldwin, Thornley and Beeverc) and the sow (Pettigrew et al., Reference Pettigrew, Gill, France and Close1992). Taking into consideration the specific nature and the significant role of these metabolites during the phase of mobilisation, it was included in the current model, as suggested by Danfaer (1990).
The differential equation of the blood plasma NEFA pool (NEFABL (71)) was
The initial size of NEFABL was indexed to POT and was equal to 0.011 + 0.004 POT mol, which corresponds to [NEFABL] ranging from 0.5 to 1.0 mmol/l. This approach was adopted since the increase in blood plasma NEFA is known to start before parturition (see Vazquez-Añon et al., Reference Vazquez-Añon, Bertics, Luck, Grummer and Pinheiro1994) and to reach higher levels when milk production and body weight loss increase (Harrison et al., Reference Harrison, Ford, Young, Conley and Freeman1990).
A major NEFA pool inflow was adipose tissue mobilization (FATGAT → NEFABL (46)) and was proportional to adipose tissue catabolism. Expressed per gram of adipose tissue, the simulated FATGAT → NEFABL flow was within the range of data measured in cow subcutaneous adipose tissue (Yang and Baldwin, Reference Yang and Baldwin1973; Metz and Van Den Bergh, Reference Metz and Van Den Bergh1977). Another inflow was the release of NEFA from blood TG hydrolysis under the influence of lipoprotein lipase (FAAT → NEFABL (38)). The last inflow was mainly due to the release of NEFA from blood TG hydrolysis in udder vessels (FAUD→NEFABL (72)) assuming that 10% of the FA, which could be potentially released from blood TG by mammary lipoprotein lipase (FATGBL → FAUD (116)), were recycled as NEFA:
Three outflows from the NEFA blood pool were considered. The first flow of NEFA removal from blood plasma was due to the udder (NEFABL → FAUD (117)). The second flow was due to liver extraction of NEFA (NEFABL → FALI (73)) built on the mass action law in which the rate factor was expressed as a sigmoid function of NEFA blood plasma concentration ([NEFABL], mmol/l (12)). Moreover, the parameters driving the asymptote and the shape of the function were assumed to be linearly dependent on POT. Through this equation, higher rates of liver extraction were associated with lower values of POT and a higher sensitivity to [NEFABL] was associated with higher values of POT:
The NEFA removed by the liver and which were not involved in TG synthesis (FALI → FATGLI (92)) were completely oxidised (FALI → OX (94)) or partially oxidised into acetate or 4-carbon chains (FALI → ACBBL (68)). Through these pathways, NEFA contributed to oxidative metabolism. The third outflow of NEFA was due to lean tissues (e.g. muscle, gut, heart) and was integrated as an oxidative flow (NEFABL → OX (74)):
As no specific value has been published for this flow, the definition adopted was fixed to achieve a slightly higher outflow for the muscle–gut–heart system than for the liver as suggested by Pethick and Dunshea (Reference Pethick and Dunshea1994) in pregnant ewes. Moreover, simulated data were consistent with NEFA values of utilisation by sheep muscle at maintenance (Pethick et al., Reference Pethick, Lindsay, Barker and Northrop1983).
Blood plasma triglycerides
Metabolic pathways related to FA and GLY components of TG are shown in Figures 9 and 10, respectively.

Figure 9 Model diagram of non-esterified fatty acid (NEFA) and triglyceride fatty acid (FATG) metabolism.

Figure 10 Model diagram of glycerol (GLY) metabolism.
The differential equation of the blood plasma FATG pool (FATGBL (75) was
Analogously, the differential equation of the blood plasma GLYTG pool (GLYTGBL (76)) was
The blood plasma TG pool (TGBL (77)) was then deduced from the FATG or GLYTG blood plasma pool:
The initial size of FATGBL was fixed at 0.0096 mol and the initial size of GLYTGBL was fixed at 0.0032 mol (1/3 of the initial size of FATGBL for stoichiometric consistency), which corresponds to [TGBL] = 0.1 mmol/l.
The blood plasma TG pool, split up into its components GLYTGBL (76) and FATGBL (75), was fed by gut absorption of chylomicrons (FATGIN → FATGBL (28) and GLYTGIN →GLYTGBL (79)) and by liver release of lipoprotein (FATGLI →FATGBL (78) and GLYTGLI → GLYTGBL (96)). This latter flow was proportional to liver fat storage and was therefore increased by mobilisation. Moreover, this flow was assumed to be regulated by POT:
This equation was built to agree with experimental data on liver steatosis (Figure 15). Blood TG were removed by the udder to contribute to milk fat production requirements (FATGBL → FAUD (116) and GLYTGBL → GLYUD (123)). They were also hydrolysed in the blood by the lipoprotein lipase of peripheral tissues. The lipoprotein lipase activity was linked to adipose tissue anabolism and it only treated adipose tissue in the present model (FATGBL → FAAT (37) and GLYTGBL → GLYBL (80)).
Blood plasma glycerol
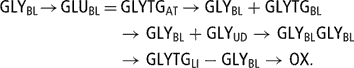
The glycerol blood pool was considered as a ‘zero pool’. The first inflow of GLY came from adipose tissue mobilisation (GLYTGAT → GLYBL (47)). The second from glycerol derived from hydrolysis of blood TG (FATGBL → FAAT (37)) under tissue lipoprotein lipase action (GLYTGBL → GLYBL (80)) and not used by adipocytes and redirected in its totality toward the blood GLY pool.
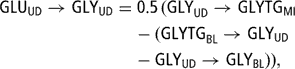
While the third glycerol inflow was derived from the hydrolysis of blood TG under mammary lipoprotein lipase action (GLYTGBL → GLYUD (123)) not used for milk fat and redirected toward the blood GLYBL pool (GLYUD → GLYBL (81)). Analogous to released FA (72), the value of 10% was used:
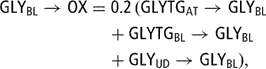
Blood plasma GLY was either removed by the liver to synthesise liver TG (GLYBL → GLYTGLI (93)) or oxidised (GLYBL → OX (82)), the remaining being involved in gluconeogenesis (GLYBL→GLUBL (83)) where 2 mol GLY give 1 mol GLU. A daily oxidation rate of 20% of GLY inflow was assumed.
Blood plasma amino acids
Metabolic pathways related to AA are shown in Figure 11.

Figure 11 Model diagram of amino acid (AA) metabolism.
The differential equation for the blood plasma AA pool (AABL (84)) was
The initial size of AABL was fixed at 0.039 mol, which corresponds to [AABL] = 1.2 mmol/l (Figure 12).

Figure 12 Kinetics of blood plasma glucose (GLU), amino acid (AA), non-esterified fatty acids (NEFA), and triglyceride (TG) concentrations, and blood plasma and lymph acetate + butyrate (ACB) concentrations throughout lactation for increasing values of milk potential (POT = 1, 2, 3, 4, 5).

Figure 13 Model diagram of udder metabolism.

Figure 13 Evolution of empty body weight (EBW) throughout lactation for increasing values of milk potential (POT51, 2, 3, 4, 5).
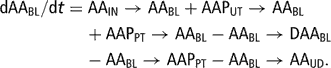
The blood plasma AA pool received three inflows: one from intestinally absorbed AA (AAIN → AABL (26)), one from uterine involution (AAPUT → AABL (62)) and one from lean body catabolic flow (AAPPT → AABL (58)). The four outflows of AA were gluconeogenesis and ketogenesis via deamination (AABL →DAABL (85), DAABL → ACBBL (69) and DAABL → GLUBL (88)), anabolism (AABL → AAPPT (52)) and udder removal (AABL → AAUD (106)). The flow of deaminated AA was proportional to the AA blood pool, expressing a mass action law. In order to achieve a realistic simulation of the AA blood pool and the partitioning of flows between gluconeogenesis/ketogenesis and milk protein yield, the rate of AA deamination was assumed to depend on milk production (POT), the flow of AA resulting from uterine involution (AAPUT → AABL (62)) and the flow of AA from the intestine (AAIN → AABL (26)):
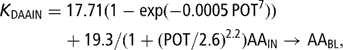
This model split the rate of blood plasma AA deamination into a term related to AA inflow from the intestine (KDAAIN (86)) and a term related to the AA inflow from the uterus (KDAAUT (87)). KDAAIN was a linear function of AAIN → AABL, the intercept was an increasing sigmoid function of POT and the slope was a decreasing sigmoid function of POT. KDAAUT was a first-order exponentially decreasing function of POT.
The fraction of this flow involved in gluconeogenesis (DAABL → GLUBL (88)) was negatively related to plasma glucose concentration according to the following sigmoid model:
The simulated proportion of deaminated AA involved in gluconeogenesis averaged 75% in early lactation and 60–65% in mid and late lactation. The remaining deaminated AA were used in ketogenesis (DAABL → ACBBL (69)). The DAA blood pool was a ‘zero pool’. Liver production of ammonia and urea was not considered in the model.
Liver sub-model
Liver metabolism
Liver metabolism was highly simplified. Indeed, most of its metabolic pathways (e.g. gluconeogenesis) have been described previously without a specific mention to this organ. It was considered that glycogen and labile protein pools were only important for within-day variations; thus only one liver pool was considered, liver TG (TGLI (91)) through its components (FATGLI (89) and GLYTGLI (90)).
The differential equations for the liver FATG and GLYTG pools were thus (Figures 9 and 10):
The liver TG pool (TGLI (91)) was then calculated from the liver FATG or GLYTG pools:
The initial sizes of FATGLI and GLYTGLI were fixed at 0.321 and 0.107 mol (Figure 12).
The FA input into this pool (FALI → FATGLI (92)) was assumed to depend linearly on the liver extraction flow of NEFA (NEFABL → FALI (73)):
The associated flow of glycerol involved in liver TG storage (GLYBL → GLYTGLI (93)) was
As described previously, the remaining NEFA removed by the liver (NEFABL → FALI (73)) and not involved in liver TG synthesis (FALI → FATGLI (92)) were either completely (FALI → OX (94)) or partially (FALI → ACBBL (68)) oxidised. The partitioning between these two oxidative flows, driven by the parameter K FALIOX (95), was assumed to be a sigmoid function of the liver extracted NEFA flow (NEFABL → FALI (73)).
This equation allowed the inflows of blood plasma ACB to be limited in early lactation and hence direct FA, resulting from adipose tissue mobilisation, toward oxidative processes to cover whole-body post-partum energy requirements. Thus, in early lactation 94% of liver FA was completely oxidised while during the remainder of lactation the proportions of FA directed toward TG, ACB and complete oxidation averaged, respectively, 4%, 76% and 20%.
The outflow as lipoprotein entering the blood TG pool (FATGLI → FATGBL (78) and GLYTGLI → GLYTGBL (96)) was
Liver weight and lipid content
At calving, a constant fresh liver weight of 8700 g was assumed (Smith and Baldwin, Reference Smith and Baldwin1974) for non-lactating Holstein cows. It was then split into its lipid (LIPLI, g (97)) and non-lipid (NLIPLI) components. From an unpublished compilation of the literature, the TG content of fresh liver at calving was estimated to be 1% (i.e. 87 g, which is to 0.107 mol TGLI) and a general relationship was established to predict the weight of liver lipids (LIPLI, g) according to TGLI (in mol, assuming a molar weight of 810 g/mol for liver TG):
This equation, applied at calving, gave the following composition for liver: LIPLI = 369 g and NLIPLI = 8331 g. The non-lipid part of the liver was assumed to be constant during lactation while the lipid fraction was calculated according to variations in TGLI with (97). Thus, the evolution in TG liver content characterised the degree of liver steatosis (STE, g/g (98)) and was estimated throughout lactation and compared to published results (Figure 15):

Figure 15 Evolution of liver triglyceride content throughout lactation for increasing values of milk potential (POT = 1, 2, 3, 4, 5) compared to literature data (references available upon request).
Udder metabolism, milk secretion and composition
Milk constituents
Consistent with the global aim of the present model, this part was considered from a pull standpoint, the lactation curve (RMY (3)) being a priori defined using the parameter POT. The milk constituents considered in the model (Figure 13) were lactose (LAMI, kg), water (WMI, kg), minerals (MMI, kg), amino acids (AAPMI, kg) and triglycerides of short- and long-chain fatty acids (STGMI and LTGMI, kg). Thus, the outflows depicted in the model were milk lactose yield (MLY, kg/day (100)), milk mineral yield (MMY, kg/day (101)), milk water yield (MWY, kg/day (102)), milk protein yield (MPY, kg/day (109)) and milk fat yield (MFY, kg/day (121)). Milk lactose, mineral and water yields were calculated from RMY. The kinetics of udder lactose secretion and blood plasma glucose extraction were fixed in the model according to POT and the limits of glucose metabolism. Milk fat and protein yields were outcomes of the metabolic pathways regulated by POT.
Milk lactose, minerals and water
The milk lactose concentration was assumed to be constant (MLC = 48 g/kg). Thus, the milk lactose outflow (GLUUD → LAMI (99)) was the product of RMY and MLC assuming a molar weight of 342 g/mol for lactose and 2 mol GLU for 1 mol LA. This flow, expressed in kg of lactose per day, was the milk lactose yield:
The associated milk water and mineral yields were estimated from RMY, MLY, MFY, MPY and MMY (MMC = 7 g/kg) with the underlying assumption that lactose secretion drove RMY through the action of osmotic pressure.
There was no specific removal rate for glucose, which was extracted by the udder to cover its requirements. Therefore, GLU removed by the udder (GLUBL → GLUUD (105)) was used for lactose synthesis (GLUUD→LAMI (99)), glycerol synthesis (GLUUD → GLYUD (103) and was oxidised (GLUUD → OX (104)):
The proportion of glucose extracted by the udder for oxidation decreased from 48% to 20% when POT increased from 1 to 5.
The udder removal rate of FATG, NEFA and ACB from blood was calculated from mammary blood flow (MBF (16)) irrigating the udder and the specific removal rate of each metabolite. The metabolite flows entering the udder were the product of MBF and blood concentration of each of them.
Milk protein
For AA, a model with an extraction rate lead to unrealistic values of milk protein content. The flow of blood plasma AA to udder was therefore assumed to follow a mass action law with the rate decreasing as lactation progressed. Moreover, the model parameters for this rate factor were assumed to vary with POT: the initial rate of AA removal by the udder was proportional to POT and the decrease in this rate as lactation progressed diminished with increasing values of POT:
In this equation, the term t/(1 + 0.1 POT) was introduced as a coefficient to smooth data. Since udder extraction of AA is not driven by mammary blood flow (contrary to NEFA, FATG and ACB), the coefficient used to smooth data was adopted to avoid abrupt AA removal from blood plasma. By this approach the udder AA extraction reached 90% of its value on day 1 for POT = 1 and on day 5 for POT = 5. Milk protein outflow was responsible for 95% of the AA removed (AAUD → AAPMI (107)), the remaining 5% were oxidised by the udder (AAUD → OX (108)).
Assuming a molar weight for milk protein of 110 g/mol, the milk protein yield (109) and content (MPC, g/kg (110)) were determined.
Milk fat
Milk fat included TG with short- (4–16 carbon atoms) and long-chain (16–18 carbon atoms) fatty acids (STGMI and LTGMI, respectively). Milk TG of short-chain fatty acids (SFATGMI) came from FA synthesised using the ACB removed from blood (ACBBL → ACBUD (111)) with an extraction rate increasing curvilinearly with POT. It was assumed that 60% of the precursors were actually incorporated into TG (ACBUD → SFATGMI (112)), the rest being oxidised (ACBUD → OX (113)). This latter value (K ACBUDOX (114)) was moreover assumed to be higher in early lactation for a POT greater than 1 and to reach 80% at calving for POT = 5. This approach was adopted to avoid excessive milk fat yield in early lactation and was assumed to be consistent with the hypothesis of a specific energy requirement associated with the initiation of lactation.
Assuming a molar weight of 600 g/mol for STGMI and a conversion factor of 6 mol ACB per 1 mol FA (mean carbon number 12), milk short-chain TG yield can be determined (MSTGY, kg/day (115)).
Milk triglycerides of long-chain fatty acids (LFATGMI) came from FA derived from the hydrolysis of blood TG (FATGBL → FAUD (116)) and from blood plasma NEFA. The extraction rate of FA from blood TG increased curvilinearly with POT and a total of 90% were used (see (72)). The extraction rate of NEFA was assumed to increase sigmoidally with blood NEFA concentration, the shape and asymptote of this function were linearly dependent on POT (NEFABL → FAUD (117)). This structure allowed the model to express the increase in mammary NEFA uptake in early lactation and the increase in the proportion of long-chain FA (18-carbon chains) in milk at this time:
It was assumed that 80% of the FA removed were actually incorporated into milk fat (FAUD → LFATGMI (118)), the remaining 20% being oxidised (FAUD → OX (119)):
Assuming a molar weight of 800 g/mol for milk LTGMI, the milk long-chain TG yield (MLTGY, kg/day (120)), the total daily milk fat yield (121) and the milk fat content (MFC, g/kg (122)) were determined:
The parallel flows observed in glycerol required for udder FA secretion were:
Glycerol was derived from blood TG hydrolysis with an utilisation of 10% of the released GLY (81) and from GLU conversion (96).
The compartments AAUD, GLUUD, GLYUD, FAUD and ACBUD were ‘zero pool’ compartments, the sum of inputs being equal to the sum of outputs, and were only built in order to estimate correctly the partitioning of flows.
To obtain a prediction of milk FA composition and production according to the number of carbon atoms (C4−14 (125), C16 (127), and C18 (126)) throughout lactation, it was assumed that C16 represented a constant proportion of 25% in milk fat. The partitioning of its origin between mammary neosynthesis and long FA, from NEFA and TG, was proportional to SFATGUD/(SFATGUD + LFATGUD) and LFATGUD/(SFATGUD + LFATGUD):
Figures 16 and 17 show the evolution during lactation of MFC and MPC, and MFY and MPY, respectively. Figure 18 shows the evolution of short-chain (C4−14) and long-chain (C18) fatty acid secretion throughout lactation. This figure shows similar trends as experimental data (e.g. Decaen and Adda, Reference Decaen and Journet1967).

Figure 16 Evolution of milk fat content (MFC, black line) and milk protein content (MPC, gray line) throughout lactation for increasing values of milk potential (POT = 1, 2, 3, 4, 5).

Figure 17 Evolution of milk fat yield (MFY, black line) and milk protein yield (MPY, gray line) throughout lactation for increasing values of milk potential (POT = 1, 2, 3, 4, 5).

Figure 18 Milk fatty acid composition according to carbon chain size (C18 and C4−14) throughout lactation for increasing values of milk potential (POT = 1, 2, 3, 4, 5).
Figure 12 presents the dynamic pattern of blood plasma GLU, ACB, AA, TG and NEFA concentrations throughout lactation. These patterns are of similar magnitude to those generally observed and remained approximately stable regardless of milk production level.
Discussion
Model aim and structure
Anatomic modules within the operating sub-system
Modules within the model were used to represent organs or tissues having specific physiological functions: digestion for the rumen and intestines, storage of protein for protein tissue and uterus, storage of lipid for adipose tissue and liver, lactation for udder, and overall metabolism for blood plasma and lymph. This simplification was adopted as a minimal structure at the tissue/organ level to achieve realistic simulations at the animal level. Therefore, the current sub-models proposed for liver and udder were much simpler than those proposed by Freetly et al. (Reference Freetly, Knapp, Calvert and Baldwin1993), Waghorn and Baldwin (Reference Waghorn and Baldwin1984), and Hanigan and Baldwin (Reference Hanigan and Baldwin1994) or included in the whole animal models of Danfaer (Reference Danfær, Huhtanen, Udén, Sveinbjörnsson and Volden2005a and Reference Danfær, Huhtanen, Udén, Sveinbjörnsson and Voldenb), Paul (Reference Paul1990) and Baldwin et al. (1995). Body protein pools were considered in the model without a distinction being made between lean body and viscera proteins (Baldwin et al., Reference Baldwin, France and Gill1987).
Metabolite pools
Metabolites considered in the model were limited to major organic molecules involved in metabolism associated with digestion, catabolism and anabolism of body reserves, and lactation (i.e. VFAs, amino acids, triglycerides and glucose). Only two pools of VFAs were considered depending on their metabolism: propionate involved in gluconeogenesis and a pool of acetate + butyrate mainly involved in oxidative processes and de novo fatty acids synthesis in the mammary gland and in the adipose tissue. The amino acid pool was considered without making a distinction between non-essential and essential amino acids. The latter were assumed to be non-limiting. Furthermore, the associated nitrogen pathways through ammonia and urea were not depicted in the model. This metabolic pathway was integrated in the models of Danfaer (Reference Danfær, Huhtanen, Udén, Sveinbjörnsson and Volden2005), Paul (Reference Paul1990) and Baldwin et al. (Reference Baldwin1995) without precise evaluation.
As in Danfaer (1990), it was considered that a minimum realistic feature of lipid metabolism could not be achieved by grouping all the circulating fatty acids into a single pool. Therefore, we propose to split lipids into two pools: triglycerides, reflecting lipoprotein transporters, and non-esterified fatty acids. Since this classification involved the relationship between fatty acids and glycerol, a minimal representation of glycerol metabolism was necessary. Glucose is largely synthesized de novo from sources such as propionate, certain amino acids, lactate and glycerol. In the present model, average contributions to gluconeogenesis over 300 days of lactation and over pooled values of POT ranging from 1 to 5, were 79% for propionate, 14% for amino acids, 4% for glycerol and 3% for lactate. These results stress the major role played by propionate. Maximal contributions from deaminated amino acids and glycerol occurred in early lactation, as the availability of these metabolites is enhanced by mobilization of adipose and protein tissue, and uterine involution. Compared to commonly accepted values (Drackley et al., Reference Drackley, Overton and Douglas2001), the model tended to overestimate the contribution of propionate and underestimated the contribution of lactate for gluconeogenesis. This was probably due to the fact that, in the model, lactate only originated from endogenous sources while propionate included exogenous lactate produced by fermentation. Glucose plays a central role in the model and despite a low level of entry from the digestive tract large quantities of glucose are involved in milk lactose synthesis during lactation. No glycogen compartment was considered, and thus no glucose storage mechanism was represented in the present model. This simple representation of glucose metabolism was chosen because it was considered on a daily output basis. However, despite this simplicity, realistic simulations of glucose metabolism were obtained. This was mainly achieved by the fact that alternative sources of endogenous glucose, from AA and from glycerol moieties, were consistently controlled by the HM–HA regulating system.
Based on the number of active compartments (NC) and differential equations at the tissue (NCt) and metabolic (NCm) levels, the current model (NCt = 4, NCm = 5) was much less sophisticated than the three major mechanistic models of the dairy cow (Danfaer, Reference Danfær, Huhtanen, Udén, Sveinbjörnsson and Volden2005a and Reference Danfær, Huhtanen, Udén, Sveinbjörnsson and Voldenb (NCt = 9 and NCm = 77), Paul, Reference Paul1990 (NCt = 7 and NCm = 60) and Baldwin et al., 1995 (NCt = 18 and NCm > 100)). In this aspect, our model was closer to the former metabolic model of Baldwin et al. (Reference Baldwin, France and Gill1987a), NCt = 3 and NCm = 4).
Differential equations were associated with pools of triglycerides (fatty acids and glycerol) in blood plasma, adipose tissue and liver, and with pools of amino acids in blood plasma, protein tissue and uterus. Differential equations were associated with pools of glucose, fatty acids and acetate + butyrate but only in the blood plasma and lymph. Other compartments in the different modules of the model were considered as ‘zero pools’ of metabolites and were only used to partition flows correctly. Moreover, the choice of depicting ‘zero pools’ was done to facilitate future additions to the model.
Flows
The overall framework of the model integrated numerous ‘passive flows’ of nutrients essentially considered to have a structural function rather than a key dynamic role as have ‘active flows’. Flows of metabolites cover either digestive inputs of nutrients, anabolism and catabolism of lipid and protein, metabolic transactions, oxidative processes and milk component yields. Metabolic pathways depicted in the model, although simplified, were aimed at summarising elementary knowledge of dairy cow metabolism.
Contrasting with the cow models of Baldwin (Reference Baldwin1995) and Danfaer (Reference Danfær, Huhtanen, Udén, Sveinbjörnsson and Volden2005a and Reference Danfær, Huhtanen, Udén, Sveinbjörnsson and Voldenb), the current choice was to create the simplest digestive sub-part. Published mechanistic models of rumen digestion were not used because it has been demonstrated that they suffer from serious limits in accuracy (Offner and Sauvant, Reference Offner and Sauvant2004), which could lead to large biases in estimations of metabolism (McNamara, Reference McNamara2004). For this reason, empirical models of nutrient flows were used. Since they were fitted on extensive data sets, these equations are more robust than previous equations for predicting absorbed nutrients. Inflows of amino acids from the gut were calculated according to the PDI system (Vérité et al., Reference Vérité, Michalet-Doreau, Chapoutot, Peyraud and Poncet1987). The recent equations proposed by Sauvant and Bas (Reference Sauvant and Bas2001) for the input of dietary fatty acids appear to be the most valid since they were based on a larger data set than previous proposals. Similarly, for starch digestion, the recent proposals of Offner and Sauvant (Reference Offner and Sauvant2004a and Reference Offner and Sauvantb) based on a large set of diets from feed tables (Sauvant et al., Reference Sauvant, Perez and Tran2002) were applied. This ‘starch part’ of the model allowed the correction of fermentable OM in the rumen from by-pass starch. This principle has been proposed in the Dutch version of the PDI system (Tamminga et al., Reference Tamminga, van Straalen, Subnel, Meijer, Steg, Wever and Blok1994). Finally, the mechanistic models of rumen digestive flows of VFA production and absorption were the least reliable aspect of the present model, even if the variations obtained for the ratio acetate + butyrate/propionate as a function of diet OM digestibility appeared to be fairly realistic.
In the present model, the balance between anabolism and catabolism of adipose tissue simulated mobilisation in early lactation and reconstitution of body fat reserves in late lactation. This is consistent with observations on body fat changes during lactation. Nevertheless, the present model expresses a net balance and does not describe the intracellular re-esterification of FA (Emery, Reference Emery1979), and thus probably underestimates the total lipolytic activity of adipose tissue. Since glycerol released from adipose tissue covered not only apparent catabolism but also whole catabolism of triglycerides, the model may also underestimate glycerol release from adipose tissue.
In the model, oxidative flows were mainly conceived to equilibrate pathways according to the carbon conservation principle. The major contributor to oxidative processes in the model was acetate + butyrate: 77% of its carbon units were involved in oxidation over the 300 days lactation, compared to 9.2%, 5.3%, 4.7%, 3.6% and 0.1% for glucose, amino acids, propionate, fatty acids and glycerol, respectively. The value for fatty acids reached more than 20% in the first week of lactation. Over 300 days of lactation, 41.4% of carbon units involved in oxidative flows took place in the blood plasma and lymph module, compared to 30.8% through the rumen wall, 14.5% in udder, 6.9% through intestine wall, and 4.0% and 2.4%, respectively, in protein and adipose tissues. Metabolic models of lactation have rarely included ATP metabolism (Pettigrew et al., Reference Pettigrew, Gill, France and Close1992). Presently, this aspect was also not included for simplicity of the model and to avoid some methodological problems due to the high turnover rate of the ATP and ADP compartments. Thus, it was assumed that ATP availability was neither a limiting factor nor a regulatory element. Another reason for this choice was the current lack of experimental data on the origin of ATP sources from different substrates and the contribution of different organs in energy expenditure.
Although the milk lactose yield was conceived as a ‘pull’ mechanism, the milk protein and fat yields were outputs of the udder sub-model. The simulated milk fat and protein contents decreased, respectively, from 4.2% to 3.7% and from 3.3% to 3.1% with increasing peak milk production level from 10 kg to 50 kg. Long-chain fatty acids represented about 60% and 30% of milk fatty acids in early and late lactation, respectively. These features were considered to provide a realistic simulation of milk composition.
Homeorhetic and homeostatic regulating sub-system
The first attempt to model homeorhesis in the lactating ruminant has been the modeling approach of the mammary gland of Neal and Thornley (Reference Neal and Thornley1983). These authors assumed the existence of a theoretical hormone controlling the division rate of basic udder cells to provide active secretory cells. This hormone followed an exponential decay after an initial pulse at parturition. This first simple model was further developed by Dijkstra et al. (Reference Dijkstra, France, Dhanoa, Maas, Hanigan, Rook and Beever1997) and recently by Vetharaniam et al. (Reference Vetharaniam, Davis, Soboleva, Shorten and Wake2003a and Reference Vetharaniam, Davis, Upsdell, Kolver and Pleasantsb) and Pollot (Reference Pollot2004). These models constituted a trend in which a central role was played by the evolution of the mammary tissue. The present model did not follow this trend. In contrast, it described the organs and major metabolisms more accurately. Its main originality was the definition of the homeorhetic sub-system, which already existed in the first version (Sauvant and Phocas, Reference Sauvant and Phocas1992) and was based on three basic principles.
The first principle of expression of a homeorhetic drive for lactation is the consistent link between the kinetics of intake and milk production. This results in a pushing role of absorbed nutrients and a pulling one of the udder. This link was established through an empirical dynamic model derived from the database of lactation kinetics described by Martin and Sauvant (Reference Martin and Sauvant2002) and defining realistic and consistent patterns of DMI and RMY relevant with milk potential varying from 10 to 50 kg at peak production.
The second principle was the definition of a theoretical regulatory sub-system that adapted the nutrient flows to the level of intake and milk yield. It was mainly achieved by the key role of the parameter POT representing the milk production potential. Parameter values were estimated for milk potential varying from 10 to 50 kg at peak production and relationships between the most sensitive parameters and the parameter POT were modeled. Thus, the model produced realistic simulations of blood metabolite concentrations, regardless of the production level. In the present paper, the multiple influences of POT were not described in detail although introduced in several equations. Further studies will explore more systematically the sensitivity of the model to POT and some other major basic parameters.
The third principle was the hyperbolic relationship between HM and HA, which was also one of the major aspects of driving forces of the current model. This principle did not explicitly exist in other mechanistic model of lactating cows or sows. The shape of this relationship described the alternative influence between the activities of catabolism and anabolism and was consistent with the data of MacNamara (Reference McNamara1989) and Chilliard and Robelin (Reference Chilliard and Robelin1985). The theoretical and relevant approach of this aspect was chosen because of the lack of mechanistic information related to the complex hormonal systems driving lactation. Firstly, the hormones and neurotransmitters (including interrelationships), which are more or less directly involved in the lactation process, have not been sufficiently identified to be mechanistically described. Secondly, for each acting hormone, the mechanisms involved in synthesis and excretion, tissue sensitivity, receptor affinity, cellular metabolism after the internalisation of the hormone-receptor complex are poorly understood. Therefore, we tried to build the minimal mechanism to interpret the majority of the homeorhetic drives. The exponential decay of HM throughout lactation was adopted from observations on the evolution of plasma NEFA and milk long-chain fatty acids during lactation in the cow (Chilliard, Reference Chilliard1987) and goat (Donshea and Bells, 1990). An advantage of the exponential expression was its flexibility and the possibility to express its two basic parameters as functions of POT. In the model of Baldwin et al. (Reference Baldwin, France and Gill1987), actual glycemia was considered as the major index of energy status and drove catabolic and anabolic flows. In the recent versions of this model, there was a lactation hormone (Lhor) that presented a first-order decrease in time as does the current HM. However, it did not seem to have any relationship with the potential of production. In the lactating sow model (Pettigrew et al., Reference Pettigrew, Gill, France and Close1992), a theoretical homeorhetic system has also been proposed. In this model, the hormone of lactation partly drove the potential value of the body protein and lipid catabolism, and also regulated milk secretion. In the model of Danfaer (1990), an empirical equation was fitted to data of Herbein et al. (Reference Herbein, Biello, Eckler, Pearson and Ackers1985) to provide kinetics of plasma growth hormone and insulin, which drove the major metabolic exchanges between the tissues and the udder. Theoretical principles of homeorhetic regulation and body mass turnover were also included in the model of pig growth proposed by Lovatto and Sauvant (Reference Lovatto and Sauvant2003). However, in their model, some basic principles of homeostasis were also explicitly taken into consideration to maintain the concentrations of the major blood metabolites within physiological ranges.
Some homeostatic controls concerned de novo fatty acid synthesis in adipose tissue controlled by blood plasma triglyceride ((37), (39)), gluconeogenesis from deaminated amino acids (88) and glucose oxidation (66) controlled by blood plasma glucose, liver extraction of fatty acids controlled by blood plasma non-esterified fatty acids (73) and the partition of liver extracted fatty acids between partial and complete oxidation ((68), (94), (95)). These homeostatic controls were necessary to ensure that model predictions were within physiological limits.
Present model and further developments
As underlined for previous models of the lactating cow (Baldwin et al., Reference Baldwin, France and Gill1987a, Reference Baldwin, France, Beever, Gill and Thornleyb and Reference Baldwin, Thornley and Beeverc; Danfaer, 1990) and lactating sow (Pettigrew et al., Reference Pettigrew, Gill, France and Close1992), only few experimental data were used to provide values for the basic parameters of the models (e.g. rate, affinity and inhibition constants). Therefore, the model calibration was not completed globally but by successive partial optimisation processes focusing on a particular flow. This was generally performed by forcing selected flows through a model so that they simulated an expected trend in metabolism in order to estimate an unknown flow. For example, the flow of blood amino acids extracted by the udder was forced repeatedly through a model at different milk protein levels in order to build the blood amino acid deamination flow. Moreover, several experimental data sets have been developed to specifically determine values for model parameters. This was especially the case for uterine involution in early lactation and the evolution in body composition pattern.
Except for the simulation data, which was mainly focused on the influence of milk yield potential, no specific sensitivity study of the model was presented. This important phase will be described in future studies. Some external validations of the present model have been performed and they remained as simple as possible. The target was to check if the pattern of a given flow or compartment exhibited previously observed classical trends. This approach was applied to blood metabolites, body tissue components and udder flows of major fatty acids. In all these cases the results were globally satisfactory. Further external validations will have to be performed. In particular, since the data of measurements of flows of metabolites through organs have been published mainly in sheep or growing cattle, it will be necessary to build a database of blood flows measured in lactating cows and to validate the current model, taking into account major elements of animal husbandry (e.g. RMY, DMI). Another important aspect will be to compare, under similar dietary situations, the current model with the other whole-animal models already published. This will include not only the mechanistic dairy cow models Molly (Baldwin et al., 1995) and Karoline (the latest version of Danfaer’s model) but also the French dairy cow empirical model of INRAtion (2004) and the dairy cow module of the Cornell Net Carbohydrate and Protein System (CNCPS, 2000). Such a comparative evaluation of models is necessary to determine the modules where more work is needed in order to progress in the development of a minimal mechanistic structure able to aggregate the main features of dairy cow metabolism.
The initial purpose of applied animal nutrition has been to produce animal products as efficiently as possible. Therefore, the prediction of nutrient requirements at a given production potential has been a basic aspect of diet formulation. Today this sole objective is insufficient to answer current issues concerning product quality, environmental impact of animal production, animal welfare and food safety. For these reasons, the concept of multiple responses to diets and feeding practices was published over 10 years ago (Sauvant, Reference Sauvant1992 and Reference Sauvant1994) and is now largely accepted. This means that models should help our understanding and predict responses to diets rather than just estimate nutritional requirements. For example, the kinetics of lactation can be modified significantly by exogenous factors such as dietary strategy (Martin and Sauvant, Reference Martin and Sauvant2002). The current model was not conceived to explore and predict the responses of dairy cows to variations in dietary strategies because it does not take into account the major dynamic principles of energy homeostasis around set values. This will be the next stage in development and a major challenge for the present model. Several other major aspects will have to be altered in view of this new perspective. The kinetics of milk protein, fat and major fatty acid levels were satisfactory. However, they will have to be challenged with diets varying in energy density and in fat content. Encouraging results were obtained with the major milk fatty acids and this model could be a good basis to integrate more information concerning fatty acid flows at the digestive, metabolic and udder levels.
Obviously, the next challenge will be to include the ability of the cow to respond to limited supplies of lysine and methionine (Rulquin et al. Reference Rulquin, Pisulewski, Vérité and Guinard1993). In order to do this, the rumen model of Lescoat and Sauvant (Reference Lescoat and Sauvant1995) will form a convenient first step as it includes lysine and methionine digestion. Several attempts to specifically model the metabolism of NH3 and urea have already been performed (Sauvant, Reference Sauvant1993; Faverdin and Verité, 2003) and the realistic simulated data, which were obtained with these models, suggest that they could be included fairly easily in the present model.
A further development of the sub-model of lipid digestion would be to separate the major groups of fatty acids (e.g. saturated, unsaturated), and hopefully some strategic minor fatty acids as trans-fatty acids and CLA (Chilliard et al., Reference Chilliard, Ferlay and Doreau2001). One of the difficulties will probably be the estimation of ruminal hydrogenation and isomerisation processes.
In order to simulate hourly or minute-based processes concerning glucose metabolism it will be necessary to take into account the compartments of liver glycogen, and circulating insulin and glucagon (Lemosquet and Faverdin, Reference Lemosquet and Faverdin2001). All these homeostatic aspects will have to be taken into account when the target of the model is to simulate metabolic disorders such as ketosis.
Conclusion
The objective of this model was to integrate the mean kinetics of intake, milk production and its composition as well as body weight changes. The present model is an effective means to integrate experimental data of various origins. The results from simulations were satisfactory in the sense that the simulated values of all the parameters were globally realistic. One of the major advantages of such a model concerns its ability to behave reliably when milk yield potential varies. As such the current model could evolve in two major directions, firstly through its use in larger models of herd or even farm management, and secondly it could become more accurate and be completed by including the major underlying mechanisms, which allow the prediction of responses to different dietary patterns during lactation.
Acknowledgments
The authors thank Pr. P. Schmidely for his suggestions and assistance.


