


Introduction
Chromium (Cr) is an active component of the glucose tolerance factor and is important in carbohydrate, protein and fat metabolism, presumably by potentiating the action of insulin (Anderson, Reference Anderson and Mertz1987; Mertz, Reference Mertz1993). Dietary recommendation for Cr is not listed for most livestock species including goats. Nevertheless, supplementation of Cr in livestock diets may improve animal metabolism and enhance production performance and the quality of animal products (Spears, Reference Spears1999). Stress and diseases induce Cr deficiency by increasing glucose metabolism and causing release of corticosteroids. The result is mobilisation of tissue Cr and its irreversible loss through urine (Borel et al., Reference Borel, Majeres, Polansky, Moser and Anderson1984; Anderson, Reference Anderson and Smith1988) and an exacerbation of a marginal Cr deficiency (Sahin and Sahin, Reference Sahin and Sahin2002) caused by insufficient Cr intake through dietary sources (Spears, Reference Spears1999). Dietary Cr supplementation may be useful in alleviating such stress-induced losses of Cr. However, choice of the source of supplemental Cr seems to be a crucial question and the organic Cr compounds like Cr picolinate or Cr in an organically complexed form like Cr yeast may have greater absorbability from the gut (Underwood and Suttle, Reference Underwood and Suttle1999). It is uncertain if supplemental Cr would yield any appreciable beneficial effects in adult ruminants not exposed to any stressful condition. The present investigation was conducted using adult castrated male goats as a ruminant prototype reared under a semi-intensive management system with minimum possible stress per se. The objectives were to ascertain (i) if Cr supplementation influences circulatory cortisol and insulin in adult goats, and (ii) whether Cr yeast complex yields better results than Cr chloride, an inorganic reference source of Cr, with respect to the aforementioned parameters and glucose tolerance.
Material and methods
Feeding and management of experimental animals
The experimental protocol used in this study was approved by the Institutional Animal Ethics Committee. The investigation employed adult castrated male black Bengal goats (Capra hircus) as the animal model (no. = 18). The goats (average age 13 months, mean body weight = 14.3 ± 0.75 kg) were obtained from the flock maintained at the experimental farm of the University. The goats were treated for internal and external parasites (0.2 mg Ivomec®, administered parenterally) and vaccinated against peste des petits ruminants (the freeze-dried vaccine was supplied by the Indian Veterinary Research Institute, Mukteswar, India). Rectal temperatures were checked and any exceeding 40°C were treated with paracetamol and re-examined after 2 days. The animals were weighed again and distributed randomly into 3 treatment groups (no. = 6 per treatment group) in such way that the variation between the treatment groups with regards to body weight was minimal (P = 0.99) at the start of the experiment (day 0). The goats were reared under a semi-intensive farming system and accordingly, they were allowed to graze daily on a natural pasture of Cynodon dactylon from 0900 h to 1600 h and were placed in individual pens measuring 1.3 × 2 m in an adjoining animal house for the remainder of the day. The pens were separated with plastic painted metal rails. The goats were tied in the morning and were offered individually 200 g of a concentrate mixture (Table 1) at 0700 h. Refusals were negligible and hence were not collected for sampling. To minimise mineral contamination from inevitable sources plastic pans were used for offering feed and drinking water and de-mineralised water was supplied to the animals throughout the experiment. The trial lasted 120 days.
Table 1 Ingredients and chemical composition (g/kg dry matter unless stated otherwise) of the unsupplemented concentrate diet and pasture grass (Cynodon dactylon) fed to the experimental goats
† Vitamin pre-mix provided the following per 100 kg of diet: vitamin A (82 500 IU), B2 (50 mg), D3 (12 000 IU), K (10 mg), 10 g; vitamin B complex (B1, B6 and B12, pantothenate and niacin) and vitamin E, 20 g. Mineral pre-mix provided per 100 kg of diet: NaCl, 400 g; NaHCO3, 100 g; CuSO45H2O, 6 g; CoCl26H2O, 0.44 g; ZnSO47 H2O, 32 g; FeSO47H2O, 21 g; MnSO4H2O, 33 g; mixed in a dibasic calcium phosphate base (400 g).
Chromium supplementation of the experimental goats
Cr was supplemented to the experimental goats through the concentrate diet either as chromic chloride hexahydrate (CrCl3, 6H2O, molecular weight 266.45, minimum assay 97%, Hi-Media Laboratories, Mumbai, India) or in the form of Cr yeast complex (Chromesac®, containing 400 mg Cr per kg, supplied by the Zeus Biotech, Mysore India). The concentrate diet contained 0.5 mg added Cr per kg (as-fed basis) from either of these sources. The experimental groups were, therefore, control (receiving no Cr supplementation), Cr chloride (containing 0.5 mg added Cr per kg as Cr chloride) and Cr yeast (containing 0.5 mg added Cr per kg as Chromesac®). Therefore, the goats consumed 0.1 mg/day added Cr when consuming 200 g/day of concentrate. For fortification of the concentrate mixture with Cr chloride 128.1 mg of CrCl3, 6H2O was mixed thoroughly with 50 g of ground maize in a small capacity mixer which was subsequently mixed with 50 kg of the concentrate diet in a mechanical blender. To fortify the concentrate diet with Cr yeast, 62.5 g of Chromesac® was mixed thoroughly with 50 kg of the concentrate mixture to arrive at the desired concentration of 0.5 mg/kg. The mean concentration of Cr in the unsupplemented concentrate diet was 0.76 mg/kg dry matter (DM) while that in the pasture grass was 0.93 mg/kg DM (Table 1).
Performance study and sample collection
Individual body weights were recorded at weekly intervals. Average daily gain (ADG) in body weight was calculated by subtracting the initial body weight from that on day 120. The samples of the unsupplemented concentrate diet were collected from each of the lots prepared while those of the pasture grass were collected at monthly intervals. These samples were dried at 80oC for 16 h in a forced air oven for estimation of DM, organic matter (OM) and crude protein (CP) contents (methods 942.05 and 984.13 of Association of Official Analytical Chemists (1995)) and neutral- and acid-detergent fibres (sulphate and amylase method of Van Soest et al. (Reference Van Soest, Robertson and Lewis1991)).
Blood samples (approx. 10 ml) were collected in sterilised glass tubes on day 0 and then on days 60, 90 and 120 of Cr supplementation from all the experimental animals at 0700 h after an overnight fast. Immediately after collection the tubes were placed in ice for 60 min to clot the blood, then centrifuged at 3000 r.p.m. for 15 min. Glucose was estimated in serum within 2 h of serum separation and the remaining serum was transferred to polystyrene tubes, capped and stored ( − 20°C) for later analyses of cholesterol, triacylglycerol, total protein and cortisol.
An intravenous glucose tolerance test (IVGTT) was performed on day 60 of Cr supplementation following the method standardised by Kaneko et al. (Reference Kaneko, Harvey, Bruss and Kaneko1997) and approved by the Institutional Animal Ethics Committee. The test was done on two consecutive days with three goats from each treatment group being tested on the 1st day and the remaining three on the other. The goats were fitted with sterile indwelling jugular catheters the day prior to the IVGTT. A 14-gauge thin wall needle was introduced into the jugular vein and a 30-cm piece of 18-gauge thin wall Teflon tubing was introduced through the needle into the jugular vein. The needle was removed and the catheter was sutured to the skin. Catheter patency was maintained by a single flushing with heparin (100 IU/ml) in normal saline. After an overnight fast the pre-challenge blood samples (0 min) were collected following which an intravenous bolus dose of glucose (0.5 g/kg body weight as 50% sterile solution) was administered at ambient temperature within a period of 30 s and this was immediately followed by a 10 ml normal saline flush. Blood samples were collected 5, 15, 30, 45 and 60 min after glucose infusion in sterile glass vials which were placed in ice and serum was separated for glucose and insulin assay. The clearance rate (k) for serum glucose was calculated between 5 (t 1) and 60 (t 2) min and that of insulin was calculated between 0 (t 1) and 45 (t 2) min post infusion respectively in accordance to the standardised procedure outlined by Kaneko et al. (Reference Kaneko, Harvey, Bruss and Kaneko1997) using the following equation:
in which k (percentage per min) is the fractional turn over rate (or clearance rate) of serum glucose or insulin as calculated from the natural log (ln) of their circulating concentrations between t 1 and t 2. The serum half-life (T 1/2) was calculated as follows:
where T 1/2 is the half-life (min) of serum glucose or insulin and k is the calculated fractional turn-over rate determined during t 1 and t 2.
A feeding challenge test was performed on day 75 employing all the goats of an experimental group. The pre-feeding blood samples were collected at 0700 h after an overnight fast following the methodology described above. The goats were fed and bled again 2 h after feeding. The serum samples obtained were analysed for glucose, cholesterol, triacylglycerol and total protein. The change (%) in the concentration of the serum metabolites over the basal value at 2 h post prandial was determined as well.
An epinephrine challenge test (Kaneko et al., Reference Kaneko, Harvey, Bruss and Kaneko1997) was performed on all the goats on day 110 of Cr supplementation. A fasting (pre challenge) blood sample was collected at 0700 h (0 h) on the day of the test following the procedure described above which was immediately followed by an intramuscular administration of epinephrine hydrochloride (1000 international units). Subsequent samples of blood were collected after 30, 60 and 120 min of epinephrine administration. The serum was separated and analysed for glucose, triacylglycerol, cortisol and insulin.
Analyses of samples
The concentration of Cr in the unsupplemented concentrate diet and pasture grass was estimated according to the methodology suggested by Perkin Elmer Inc. (Wellesley, MA, USA) with some modifications. Oven dried (at 80°C for 16 h) samples were ground using a 1-mm sieve and 5 g subsamples were de-carbonised in glazed ceramic crucibles at 180°C. These samples were then ignited in a muffle furnace at 400°C for 4 h. The ash was treated with concentrated nitric acid under mild heat to oxidise the trivalent Cr to the hexavalent (Cr6+) form, which could be detected more accurately. After complete digestion, the acid extracted samples were cooled at room temperature and filtered through ash-less Whatman filter paper (no.1). The crucibles were washed several times with triply distilled water and the final volume was made up to 10 ml. Cr was then estimated in an atomic absorption spectrophotometer (Perkin Elmer A Analyst 100). A 2% solution of ammonium chloride was added in the standard and the samples to reduce interference caused by iron present in the samples. Cr in serum, on the other hand, was detected by aspirating the undiluted samples directly into the atomic absorption spectrophotometer.
Concentration of glucose, total protein, cholesterol and triacylglycerol was estimated photometrically in an automatic blood analyser (Microlab 200, E-Merck, Germany) using specific analytical kits (in vitro diagnostic kits manufactured by Erba Diagnostics, Manheim, Germany). An enzyme immuno-assay (Ranskan Sprint ELISA plate reader, Ranbaxy Diagnostics, New Delhi, India) was employed using commercial kits for estimation of insulin (Monobind Inc., Costa Mesa, USA) and cortisol (Equipar Diagnostica, Saronno Va, Italy). The sensitivity of the respective assays was determined by measuring the concentration of serially diluted known standards and averaged 0.16 μU and 0.17 ng for insulin and cortisol respectively. The sample size in each assay was 200 μl. The intra-assay and inter-assay coefficients of variations were 5 and 9% and, 8 and 13% respectively for insulin and cortisol.
Statistical analyses
All the data were analyzed in the general linear model (GLM) of the Statistical Packages for the Social Sciences (1999) and the results were expressed in terms of mean and pooled standard error of mean. The data related to body weight and ADG and those obtained during the feeding challenge, IVGTT and the epinephrine challenge test were repeated measures within animals and hence repeated measure analysis of GLM was employed for analysis of these data. A single animal was considered as an experimental unit and the time interval for each of the measurements (body weight, serum metabolite and hormone concentrations during the feeding challenge, epinephrine challenge test and the kinetic parameters of glucose and insulin during the IVGTT) were considered as the within subject variables for assessing time effects. The diets (control, Cr chloride and Cr yeast) were considered as the between subject factors and diet effects were assessed. A diet × time interaction was added in the model. The data related to serum half-life and clearance rates of glucose and insulin were analysed using multivariate analysis of variance to assess the effects of dietary sources of Cr supplementation. Multiple comparisons of means under each dietary treatment group was done employing Tukey's test. A probability of P < 0.05 was considered to be statistically significant and that of P < 0.10 was described as a trend.
Results
Body weight and live-weight gain
The initial body weight of the goats was similar across the treatment groups (P = 0.99). The goats gained body weight during the experiment (P < 0.001) but neither the ADG nor the final body weight was affected by dietary treatments (Table 2).
Table 2 Body weight and average daily live-weight gain (ADG) in goats (no. =6 per treatment groups) fed diets supplemented with inorganic or organic trivalent chromium (Cr3+)†
† Supplementation lasted for 120 days. The goats were fed with a concentrate diet (200 g per animal per day) and grazed on a natural pasture (Cynodon dactylon).
‡ Chromium was supplemented through the concentrate diet containing 0.5 mg elemental Cr3+ per kg either from chromic chloride hexahydrate (Cr chloride) or chromium yeast complex (Cr yeast). The control group of goats was fed with an unsupplemented concentrate diet. There were no significant treatment effects (P>0.1).
Metabolites and hormones in blood
Serum concentration of total protein, glucose and triacylglycerol measured on day 0 and that of cortisol and insulin measured on day 60 was similar (P>0.1) across the treatment groups (Table 3). However, the initial (day 0) serum cholesterol was lower in the control group of the goats compared with groups given supplemental Cr (P < 0.05). On the other hand, serum cholesterol on day 120 was lower in the goats fed added dietary Cr from Cr chloride and Cr yeast relative to the control group of goats (P < 0.05) and the overall mean serum cholesterol concentration also tended to be lower in the Cr supplemented goats (overall diet effect P = 0.075).
Table 3 Metabolites and hormones in pre-feeding serum samples of goats supplemented with inorganic (Cr chloride) or organic (Cr yeast) trivalent chromium (Cr3+) for 120 days (no. =6 per treatment group)
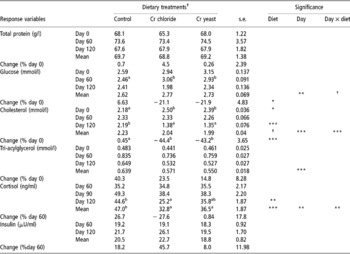
a,b Means bearing dissimilar superscripts within a row vary significantly.
† Approaching significance (P < 0.1).
Added dietary Cr failed to affect the serum concentration of total protein, glucose and triacylglycerol. The change (%) in serum concentration of the metabolites and hormones between the initial and the final measurements was calculated and a significant difference between the dietary treatment groups was detected with regards to the change in serum glucose (diet effect P = 0.049) and cholesterol (diet effect P = 0.0001) concentration. Serum glucose in the control group of goats increased while that in both the Cr supplemented groups decreased (day effect P = 0.002, day × diet P = 0.059). Serum cholesterol changed little in the control group of the goats between days 0 and 120. However, in the goats receiving added dietary Cr from Cr chloride and Cr yeast serum cholesterol declined by 44.4% and 43.2% respectively (day effect P = 0.0001, day × diet P = 0.0001). However, unlike serum cholesterol, serum triacylglycerol increased on day 120 (day effect P = 0.0001) relative to the initial concentration on day 0 irrespective of dietary treatments (diet effect P>0.1, day × diet P = 0.22).
Dietary treatment had no significant effect (P>0.1) on serum insulin concentration (Table 3). Serum cortisol on day 120 was lower in the goats receiving added dietary Cr, especially in those supplemented with Cr chloride, compared with the control group of goats (P = 0.008). The change in serum cortisol with time was significant (time effect P = 0.002). Compared with the concentration on day 60, serum cortisol increased in the control group and declined in the Cr chloride group while in the Cr yeast group of goats it changed little during the said time period (day × diet interaction P = 0.003).
Intravenous glucose tolerance test
Serum glucose and insulin concentrations and the k and T1/2 responses following the intravenous glucose infusion are presented in Table 4. The basal (0 min) concentrations of serum glucose and insulin were similar across treatment groups (P>0.1). Both of these serum parameters changed with time (P = 0.0001) and there was a significant time × diet effect (P = 0.044 for glucose and P = 0.0001 for insulin).
Table 4 Effect of supplemental chromium (Cr3+) on intravenous glucose tolerance test measurements for serum glucose and serum insulin in adult goats (no. =6 per treatment group)
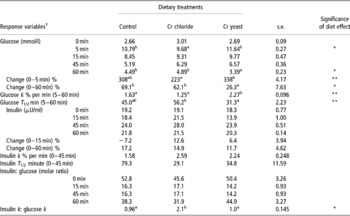
a,b Means bearing dissimilar superscripts within a row differ significantly.
† Response variables were measured during an IVGTT performed on day 60 of supplemental Cr feeding. For glucose: significant time effect P = 0.0001, time × diet effect P = 0.044. For insulin: significant time effect P = 0.0001, time × diet effect P = 0.0001.
Serum glucose increased sharply and then gradually decreased following glucose infusion. The peak serum glucose concentration, which was reached at 5 min post infusion, was lower in the goats receiving added dietary Cr from Cr chloride (P = 0.039). At 60 min post infusion serum glucose was lower in the goats fed added dietary Cr through Cr yeast (P = 0.049), indicating a quicker return to basal concentration than in the other two groups.
Serum insulin also increased following the intravenous glucose infusion reaching a peak at 45 min post infusion. Dietary Cr supplementation failed to elicit any effect on serum insulin concentration during the IVGTT (P>0.1). Interestingly, unlike the Cr chloride and Cr yeast dietary groups, in the control group of the goats serum insulin at 15 min post infusion was lower than the baseline (0 min) concentration (resulting a significant time × diet interaction P = 0.0001). However, the change in serum insulin (% basal value) between 0 and 60 min post infusion was similar across the dietary treatments (P>0.1).
Both the k and the T 1/2 responses for insulin during the IVGTT were not affected by dietary Cr supplementation (P>0.1). However, the glucose k between 5 and 60 min post infusion was higher (P < 0.05) in goats receiving added dietary Cr from Cr yeast and this was accompanied by a lower glucose T 1/2 in this dietary group. Added dietary Cr had little effect (P>0.1) on the molar ratio of insulin and glucose calculated during the IVGTT. However, the ratio between the insulin k and glucose k was higher in the Cr chloride supplemented group (P < 0.05) (Tables 5 and 6).
Table 5 Serum metabolite concentrations at 0 and 2 h post prandial in adult goats (no. =6 per treatment group) supplemented with inorganic (Cr chloride) or organic (Cr yeast) trivalent chromium (Cr)†
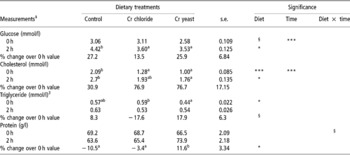
† The test was performed after 75 days of Cr supplementation.
‡ For glucose: over all diet effect P = 0.032. For cholesterol: over all diet effect P = 0.0001. For triglyceride: over all diet effect P = 0.082.
§ Approaching significance (P < 0.1).
Table 6 Effects of feeding trivalent chromium (Cr3+) on serum metabolite and hormone concentrations in adult goats during an epinephrine challenge test (no. =6 per treatment group)†
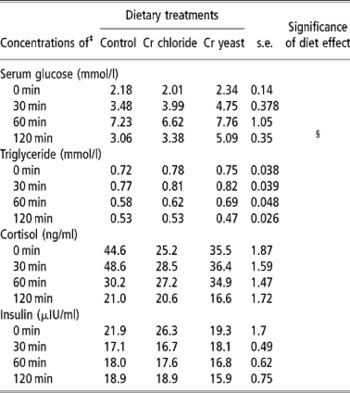
† The test was performed on day 110 of Cr supplementation.
‡ For serum glucose: time effect P = 0.0001, time –diet P = 0.43. For triglyceride: time effect P = 0.0001, time –diet P = 0.829. For cortisol: time effect P = 0.002, time –diet P = 0.182. For insulin: time effect P = 0.004, time –diet P = 0.053.
§ Approaching significance (P < 0.1).
Post-prandial changes in serum metabolite concentrations
Dietary Cr supplementation improved post-prandial utilisation of glucose (P = 0.038) and that of cholesterol (P = 0.033) with lower serum levels of these metabolites being detected in the Cr chloride and Cr yeast dietary groups than in the control group. Dietary treatment had no effect (P>0.1) on the post-prandial changes in serum levels of triacylglycerol and total protein.
Epinephrine challenge test
Serum glucose and triacylglycerol during the epinephrine challenge test were not affected by dietary Cr supplementation (P>0.1). Serum glucose increased 30 min after epinephrine infusion regardless of dietary treatments confirming that the animals were responding to the epinephrine challenge. In the Cr yeast supplemented goats serum glucose at 2 h post infusion tended to by higher than in control and Cr chloride groups (P < 0.1).
Regardless of dietary treatments serum triacylglycerol started declining after 30 min of epinephrine infusion to reach a level lower than that detected at 0 min. The trend with regards to changes in serum cortisol levels during the epinephrine challenge test was rather inconspicuous and not affected by dietary treatment (P>0.1).
Serum insulin declined with time after epinephrine challenge and the extent of this decline tended to be more pronounced in the Cr chloride group of goats (time × diet interaction P = 0.059).
Discussion
Potentiation of insulin action is presumed to be the mechanism that explains the action of Cr. Cr is considered to be an integral part of the glucose tolerance factor, which facilitates the cellular binding and action of insulin (DePew et al., Reference DePew, Bunting, Fernandez, Thompson and Adkinson1998). It has been reported that supplemental Cr feeding may improve body weight and feed efficiency in pigs (Page et al., Reference Page, Southern, Ward and Thomson1993), broiler chickens (Ahmed et al., Reference Ahmed, Haldar and Ghosh2005), goats (Paul et al., Reference Paul, Haldar and Ghosh2005) and dairy heifers (Biswas et al., Reference Biswas, Haldar, Pakhira, Ghosh and Biswas2006). On the other hand Cr supplementation has been found to have no relationship with body weight and associated performance traits in ruminating feeder calves (Bunting et al., Reference Bunting, Fernandez, Thompson and Southern1994; Kegley and Spears, Reference Kegley and Spears1995), steers (Besong et al., Reference Besong, Jackson, Trammell and Akay2001), dairy cows (Hayirli et al., Reference Hayirli, Bremmer, Bertics, Socha and Grummer2001) and sheep (Kitchalong et al., Reference Kitchalong, Fernandez, Bunting, Southern and Bidner1995; Sano et al., Reference Sano, Konno and Shiga2000). Achieving discernible effects of supplemental Cr on the production and metabolic indices of adult ruminants is still a debatable issue owing to the fact that functional ruminants derive little glucose from intestinal absorption, and the role of insulin in ruminants is perhaps less well defined than that in non-ruminants (Brockman, Reference Brockman, Milligan, Grovum and Dobson1986). Evaluation of growth responses to Cr was not the main objective of this experiment, which used relatively mature goats. Conspicuous effects of supplemental Cr on growth of the animals were lacking in this experiment.
The cholesterol lowering effect of added dietary Cr observed in this study was consistent with our earlier work with pre-pubertal dairy heifers (Biswas et al., Reference Biswas, Haldar, Pakhira, Ghosh and Biswas2006). The hypocholesterolemic effect of supplemental Cr may be related to an augmented insulin action which might have increased lipogenesis and reduced lipolysis, the result being lowered circulatory lipid concentration (Mertz, Reference Mertz1993; Spears, Reference Spears1999). Interestingly, neither the serum level of glucose nor that of insulin was affected significantly by Cr supplementation in the present study and the average molar ratio between insulin and glucose during the trial period, which was similar across the treatment groups (P>0.1), did not indicate an improved insulin action per se. Nevertheless, when subjected to the intravenous glucose loading during the IVGTT, the Cr supplemented goats exhibited improvement in glucose utilisation which is consistent with an enhancement in insulin action. As occurs in human subjects (Mertz, Reference Mertz1993) these subtle changes in insulin action might have influenced lipid metabolism to elicit a hypocholesterolemic effect. Increment in serum insulin level due to Cr supplementation in goats has been reported earlier (Haldar et al., Reference Haldar, Ghosh, Pakhira and De2006). Besong et al. (Reference Besong, Jackson, Trammell and Amaral-Phillips1996) also reported increased serum insulin and decreased plasma non-esterified fatty acids (NEFA) concentrations in pre partum cows receiving 0.8 mg Cr picolinate per kg DM. The present findings, however, tallied partially with those of Hayirli et al. (Reference Hayirli, Bremmer, Bertics, Socha and Grummer2001) who reported that supplementation of Cr as Cr methionine in pre-partum cows caused an increased serum insulin concentration associated with decreased basal plasma NEFA without affecting plasma glucose and molar ratio of insulin to glucose. Contrarily, the same workers reported that in post-partum cows plasma glucose and NEFA concentrations were not altered due to Cr supplementation despite an improvement in action of insulin (revealed by a lower molar ratio of insulin to glucose in the supplemented cows vis-à-vis the control ones). Thus, from the results presented herein and the ones reported earlier, it seems that the response to added dietary Cr is more discernible for cholesterol metabolism than it is for carbohydrate metabolism.
Potentiation of insulin action due to Cr supplementation should have enhanced retention of protein at tissue level and consequently changes in circulatory blood protein levels are expected (Chang and Mowat, Reference Chang and Mowat1992; Moonsie- Shageer and Mowat, Reference Moonsie-Shageer and Mowat1993). Cr has a known involvement in the utilisation of amino acids and synthesis of nuclear protein and RNA and might result in increased nitrogen (N) retention (Britton et al., Reference Britton, McLaren and Jett1968; Bunting et al., Reference Bunting, Fernandez, Thompson and Southern1994). Chang and Mowat (Reference Chang and Mowat1992) reported increased serum protein levels in growing steers fed with a high Cr yeast complex. In contrast no difference in the concentrations of total protein and other N metabolites were reported in heifers and steer calves (Bunting et al., Reference Bunting, Fernandez, Thompson and Southern1994) and sheep (Kitchalong et al., Reference Kitchalong, Fernandez, Bunting, Southern and Bidner1995) which corroborated the present findings. Perhaps it would be inappropriate to correlate the concentration of the N metabolites in serum with the status of protein metabolism in the experimental goats since the former may lack adequate sensitivity required to predict subtle changes in protein metabolism that may arise as a result of Cr supplementation.
The role of supplemental Cr in reducing circulatory cortisol level in ruminants is well established (Chang and Mowat, Reference Chang and Mowat1992; Moonsie-Shageer and Mowat, Reference Moonsie-Shageer and Mowat1993; Mowat et al., Reference Mowat, Chang and Yang1993; Haldar et al., Reference Haldar, Ghosh, Pakhira and De2006). Most of the findings depicting a reduction in the circulatory cortisol level due to Cr supplementation involved one or more stress factors like transportation or vaccination. The present investigation corroborated these earlier findings though in this case Cr yeast complex caused a reduction in cortisol concentration despite absence of any stress per se. Considering the generally known immuno-suppressive and anti-inflammatory role of cortisol (Borgs and Mallard, Reference Borgs and Mallard1998), the reduction in circulatory cortisol concentration due to Cr supplementation might have implications in developing newer tools for performance enhancement of ruminant livestock.
The IVGTT is a practical and simple test to measure the efficiency of insulin mediated glucose utilisation in ruminants. In an earlier study with the same animal model Haldar et al. (Reference Haldar, Ghosh, Pakhira and De2006) reported that the clearance rate (k) of both glucose and insulin increased and their T 1/2 decreased due to Cr (as Cr chloride) supplementation. However, in the present investigation, the k and T 1/2 of insulin remained unaffected though those of glucose improved indicating an enhancement in glucose tolerance (ability of a subject to maintain blood glucose level closer to the basal value after an oral or intravenous loading of glucose (Kaneko et al., Reference Kaneko, Harvey, Bruss and Kaneko1997)). It may be argued that development of an age dependent insulin resistance (inability of a subject to show a normal insulin response after an oral or intravenous glucose loading) might have precluded a conspicuous treatment effect as it was reported by Kitchalong et al. (Reference Kitchalong, Fernandez, Bunting, Southern and Bidner1995). Insulin resistance can be evaluated by insulin responsiveness, insulin sensitivity, or both (Kahn, Reference Kahn1978). Following glucose infusion the peak concentration of serum glucose reflects insulin responsiveness and the clearance rate of glucose from the serum indicates towards the insulin sensitivity (Kahn, Reference Kahn1978; Sano et al., Reference Sano, Nakai, Kondo and Terashima1991). As long as serum insulin concentrations are similar during the IVGTT, as they were during the present investigation, a higher glucose peak with a slower k and a longer T 1/2 would be suggestive of glucose intolerance. So, in the present investigation significantly lower peak serum glucose following the intravenous infusion of glucose was one of the indications towards improved insulin responsiveness in the goats receiving added dietary Cr as Cr chloride. Moreover, it was this particular dietary group in which the ratio between the insulin k to glucose k was significantly higher suggesting improved tissue sensitivity to insulin as well. However, the longer T 1/2 in the Cr chloride group of goats was rather unexpected and could not be explained. The shorter glucose T 1/2 in the Cr yeast group was due to the sharp decline in serum glucose level between 5 min (peak concentration) and 60 min (70.8%) in that group relative to the control (58.3%) and the Cr chloride (49.5%) groups. Consequently the clearance rate of glucose increased which was in agreement with the earlier findings in this regard (Kitchalong et al., Reference Kitchalong, Fernandez, Bunting, Southern and Bidner1995; Subiyatno et al., Reference Subiyatno, Mowat and Yang1996; Hayirli et al., Reference Hayirli, Bremmer, Bertics, Socha and Grummer2001). When summed up, the results of the IVGTT indicated that intake of as little as 0.1 mg added dietary Cr may improve the insulin mediated glucose metabolism in goats which ought to augment the overall production criteria of this small ruminant species.
The 0 and 2 h, post-prandial serum metabolite concentrations did not reveal any effect of Cr supplementation and this was in partial agreement with the earlier findings (Kitchalong et al., Reference Kitchalong, Fernandez, Bunting, Southern and Bidner1995; Gentry et al., Reference Gentry, Fernandez, Ward, White, Southern, Bidner, Thompson, Horohov, Chapa and Sahlu1999). The 2 h post-prandial serum glucose indicated a better utilisation of glucose after feeding which corroborated the results obtained during the IVGTT. Serum cholesterol at 0 and 2 h post prandial and the basal triacylglycerol levels revealed significant effect of Cr on lipid metabolism as did earlier workers (Bunting et al., Reference Bunting, Fernandez, Thompson and Southern1994; Kitchalong et al., Reference Kitchalong, Fernandez, Bunting, Southern and Bidner1995; DePew et al., Reference DePew, Bunting, Fernandez, Thompson and Gantt1996; Subyatno et al., Reference Subiyatno, Mowat and Yang1996). Results from this study, therefore, support the suggestion that Cr supplementation has the potential to alter lipid metabolism (Riales and Albrink, Reference Riales and Albrink1981). The lower serum triacylglycerol at 0 h, however, was contrary to several earlier works reporting little or no effect of supplemental Cr on serum triacylglycerol level (Page et al., Reference Page, Southern, Ward and Thomson1993; DePew et al., Reference DePew, Bunting, Fernandez, Thompson and Gantt1996; Besong et al., Reference Besong, Jackson, Trammell and Akay2001). No idea as regards to the effects of supplemental Cr on post-prandial utilisation of protein could be developed from the serum protein levels at 0 and 2 h post prandial.
The epinephrine challenge test was performed to ascertain if supplemental Cr could alleviate the stress induced on the animals by infusion of epinephrine. However, the metabolite and hormone concentrations in the serum of the goats during the epinephrine challenge test did not reveal any definite effect of Cr supplementation. Unlike the response obtained during the IVGTT serum glucose in the Cr yeast supplemented goats stayed more elevated than the basal value even after 2 h of epinephrine infusion which might be related to the lower level of insulin activity in that particular group. Though the goats in the Cr yeast group were able to maintain the glucose homeostasis despite such a lower basal level of insulin they perhaps became intolerant to the glucose flux produced by epinephrine which is a strong glycogenolytic catecholamine. The decline in serum insulin following the epinephrine challenge was rather difficult to explain and contradicted the earlier findings in this regard (Kitchalong et al., Reference Kitchalong, Fernandez, Bunting, Southern and Bidner1995; Gentry et al., Reference Gentry, Fernandez, Ward, White, Southern, Bidner, Thompson, Horohov, Chapa and Sahlu1999). However, in the present investigation epinephrine was introduced intra muscularly while most of the other workers employed the intravenous route. This variation in the route of epinephrine administration might have had blunted the responses during the present study.
During the present investigation the goats consumed as little as 0.1 mg added dietary Cr per day while in our earlier investigation comparatively younger goats were supplemented with 0.5 mg to 1.5 mg Cr per day (Haldar et al., Reference Haldar, Ghosh, Pakhira and De2006). In fact, the dose level of supplemental Cr employed in this study was lower than that used in earlier studies involving large ruminants (0.2 to 0.8 mg/kg diet DM). Therefore, it may be argued that the present inclusion level of Cr in diet might not be sufficient. However, the reduction in circulatory cortisol and cholesterol in conjunction with an improved glucose tolerance during the IVGTT indicated that intake of the added dietary Cr at the level employed in the present investigation may also significantly manoeuvre the metabolic criteria of adult goats.
Conclusion
The present investigation revealed changes in glucose tolerance and selected blood metabolites and hormone measurements when Cr was added as a supplement in the diet of goats. Contrary to the generally accepted hypothesis, supplemental Cr may influence the metabolism of animals even in a non-stressed management regime. However, the comparison between Cr chloride and Cr yeast as the source of supplemental Cr remained inconclusive.
Acknowledgement
The authors gratefully acknowledge the grant received from the Agricultural Produce Cess Fund of the Indian Council of Agricultural Research, New Delhi, India for conducting the investigation.


