


INTRODUCTION
Yosida (1959) designed a calorimeter for measuring the free water content of wet snow. Later Akitaya (1978) made an experimental apparatus of another type of calorimeter. This paper reports on further improvements made in the apparatus and measuring procedures. The free water content of wet snow is obtainable using this calorimeter, based on a melting calorimetrìe method using the following procedure:
Hot water (T1 °C, M1 grams) and a sample of wet snow (M2 grams) are well mixed in a thermal insulating box so that the mixture attains T2 °C, the equilibrium temperature. If heat loss is neglected in this procedure, it follows that
where c is the specific heat of water (4.18 J/gK.) and L is the latent heat of melting of ice (333.6 J/g). W (%), the free water content of the snow, is expressed by

APPARATUS AND OPERATIONAL TECHNIQUE
The new calorimeter has two spaces W and S in which a polythene tube 0.02 mm thick is embedded. The part of the tube in W contains hot water, and the other

Fig. 1. Schema of the calorimeter. Thermal insulator is made from hard plastic foam (density: 0.037g/cm3).part contains the snow sample. The two parts are divided by a movable parting strip P (Figure 1).
Temperatures T and T2 are measured by a thermister with small heat capacity and high response, accurate to 0.1 °C. Mass measurements (M1 and M1 + M2 ) are conducted indoors using a balance accurate to 0.1 gram; in the field it is difficult to avoid wind influences on the sample, and especially to prevent it from being heated and cooled from outside. In using the apparatus:
-
(1) Two plastic bottles A (110 cm3, filled with hot water) and B (250 cm3, empty) are weighed indoors and brought to the observation site in the field.
-
(2) Hot water is put into one half of the tube, which is inserted into space W with the thermister in it.
-
(3) A sample of wet snow (30 to 50 g) is put into the other half of the tube and inserted into S. The tube is covered with C and the temperature of hot water T1 is read on the thermometer while shaking the apparatus.
-
(4) After reading of T2 , the parting strip P is removed: the snow sample and not water mix , resulting in a rapid drop in temperature of the water. Equilibrium temperature T of the mixture is read while shaking the apparatus for about one minute.
-
(5) The mixture (M1 + M1) is put in bottle B with the tube after the measurement of its temperature T2 Two bottles A (empty) and B are carried back indoors to weigh them so that masses M1 and M2 are measured accurately.
CALIBRATION OF THE APPARATUS
Calibration of free water content was examined by this apparatus in a cold room at 0°C ± 1 °C, as follows. An adequate amount of the dry snow at 0*C was put into the tube, and immediately a suitable amount of water at 0°C was added. The snow sample in the tube thus had acquired a known value of free water content Wa. Measured value of free water content W, calculated by Equation (2), was compared with the known value Wa. The standard deviation of the error (W - Wa) was found to be 0.82% for 121 samples with range of free water content from 0% to 45%.
DISCUSSION OF ERROR
In equations (1) and (2) heat loss from the calorimeter and heat capacity of the tube are neglected. When the two quantities are to be considered, the following equation holds:
where c1 is the specific heat of the tube (about 2J/gK), m is the mass of it contacting with the hot water or the snow sample directly (about 0.4 g), and Q is the heat loss in Jules. From Equation (3) the corrected value of free water content W % is given by
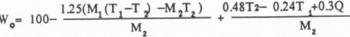

Fig. 2. Schematic diagram of the heat loss, Q. Q is a function of  since Q1 (Q2) is obtained empirically as a function of T1 (T2).
 since Q1 (Q2) is obtained empirically as a function of T1 (T2).
Figure 2 shows a schematic diagram representing heat loss through the calorimeter, where t1 and t2 are the measuring times of temperatures T and T,, respectively: Q1 and Q2 are resultant heat losses during time t, obtained from the temperature drops. Values of Q1 and Q2 were measured against the several ranges of ‘water temperature T at the air temperature 0°C and the following empirical equation was obtained approximately:
The heat loss Q during mixing time t = t2 - t1 (one minute) in Figure 2 can be given by substituting the mean temperature, (T1 + T1)/2 into T of Equation (5):
Substituting Equation (6) into (4), we obtain
where W0 is the corrected value, W is the uncorrected value and°

The equation shows that △W is inversely proportional to M2 and increases with T1 The error △W can be calculated against T1 and M because the almost constant mass of hot water M is prepared (about 110 g) and T2 is the function of T1 M1 and M2 . When the free water content is 0 %, equilibrium temperature T is given by substituting Γ = M2 in Equation (I) and Equation (8) becomes

Figure 3 shows the error of free water content △W due to Equation (2) in which the heat loss and heat capacity of the tube are neglected, and also the guideline of M2 against T1 Allowing for 1% of the error, the appropriate value of M2 is given against T1 from this figure. For instance, if M1, = 110 g, then M2 = 40 gram at T1= 50°C and M2 =35 gram at T1 = 40°C.


