Introduction
The Little Ice Age (LIA) of the 14th–20th centuries was the most recent global episode of glacier advance (Reference GroveGrove, 1988, Reference Grove2001). Glacier termini fluctuated around advanced positions for several centuries, although the timing and magnitude of fluctuations were not necessarily synchronous worldwide. Reconstruction of LIA glacier chronologies, and, by implication, enhanced understanding of climatic variability in the recent past, is therefore essential to better predict glacier response from Arctic regions in the future.
Iceland is ideally located to study the timing of LIA glacier fluctuations due to its position astride the atmospheric convergence zone and its proximity to the oceanic polar front. Consequently, Icelandic glacier mass balance is sensitive to boundary shifts, and these changes are reflected as fluctuations at the ice margins. Accurate age dating of moraine fragments associated with the former extent of these ice margins should therefore provide a means to establish the timing of maximum terminus positions and help elucidate glacier response to LIA climate change.
Previous Dating of the Lia Maximum At Vatnajökull Outlets
Different lichenometric methods using either lichen size or another index, such as lichen size-frequency distributions, as an indicator of surface age have been applied to dating Icelandic LIA moraines, especially at Vatnajökull in southeast Iceland (Fig. 1). Consequently, different methods have yielded different conclusions regarding the timing of the Icelandic LIA maximum.

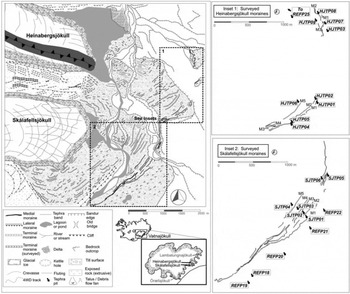
Fig. 1. (a) Location map of Vatnajökull outlets and generalized geomorphology of Skálafellsjökull (64˚16’ N, 15˚40’ W) and Heinabergsjökull (64˚17’ N, 15˚40’ W). The locations of tephra pits in the glacier forelands are shown (see also Table 1). After Reference McKinzey, Orwin and BradwellMcKinzey and others (2004).

Fig. 1. (b) Generalized geomorphology of Sultartungnajökull (64˚14’ N, 15˚48’ W). The locations of tephra pits in the glacier forelands are shown (see also Table 1). After Reference McKinzey, Orwin and BradwellMcKinzey and others (2004).
The largest or average of the five largest lichen thalli growing on a surface has conventionally been used to estimate age based on locally calibrated, usually linear, growth curves and has led to the often cited late 19th-century LIA maximum (e.g. Reference Evans, Archer and WilsonEvans and others, 1999). However, when tested against a well-established tephrochronology from southern Iceland, this method misleadingly clusters moraine formation to ∼AD 1890, whereas they actually date from the late 18th century (cf. Reference Kirkbride and DugmoreKirkbride and Dugmore, 2001). Reference Caseldine, Maizels and CaseldineCaseldine (1991) and Reference BradwellBradwell (2001b, Reference Bradwell2004) have advocated an alternative approach using statistically more reliable lichen size-frequency distributions to calculate population gradients at each site as an indicator of age. This parameter has been used to calibrate a new curvilinear dating curve, the use of which supports a late 18th-century LIA maximum (Reference BradwellBradwell, 2001b, Reference Bradwell2004). The size-frequency method ensures that reliable moraine dates are determined only from sites containing single, undisturbed lichen populations, which the conventional lichenometric method does not address.
Reference McKinzey, Orwin and BradwellMcKinzey and others (2004) tested both lichenometric approaches at previously dated non-surging outlets, Skálafellsjökull (including the Sultartungnajökull lobe) and Heinabergsjökull, flowing from the southeast margin of Vatnajökull. Depending on the chosen method of analysis, Skálafellsjökull reached its LIA maximum in the late to early 19th century (population gradient) or the late 19th century (average of five largest lichens), whereas the LIA maximum of Heinabergsjökull occurred by the mid-19th (population gradient) or late 19th century (average of five largest lichens). Discrepancies of at least ∼80years for Skálafellsjökull and ∼40years for Heinabergsjökull suggest that the previously cited AD 1887 LIA maxima for both glaciers should be reassessed (cf. Reference Evans, Archer and WilsonEvans and others, 1999), and that, most crucially, different lichen dates must be constrained by an independent dating method to deduce the precise timing and extent of the LIA maximum in southeast Iceland.
Study Aim
Most volcanic eruptions in Iceland occur in areas covered by ice, and explosivity is enhanced due to interaction between water and magma. Phreatic eruptions produce large amounts of tephra. As a result, tephrochronology (the technique of using tephra layers for correlation and dating) is a valuable tool in Iceland due to widespread fallout from frequent, well-documented volcanic eruptions and the numerous tephra layers visible in the soil separated by layers of aeolian sediment (Reference Thórarinsson, Self and SparksThórarinsson, 1981). The basal tephra layer provides a minimum date for the timing of deposition of the underlying surface.
We utilize the tephrochronological record in southeast Iceland to constrain different lichenometric dates for moraines at Skálafellsjökull (including the Sultartungnajökull lobe) and Heinabergsjökull. Specifically, we aim to:
-
1. update Reference ThórarinssonThόrarinsson’s (1958) southeast Iceland tephrochronology with additional tephra layers found throughout the region and geochemically fingerprinted for the first time;
-
2. resolve the debate surrounding the timing of the LIA maximum at Skálafellsjökull and Heinabergsjökull, which, in turn, has important implications regarding fluctuations of Vatnajökull during the LIA;
-
3. place the revised glacier chronologies in the wider context of changes throughout Iceland and across the North Atlantic during the LIA.
The Tephrochronological Record In Southeast Iceland
In this study, 25 reference soil profiles were dug between Breiðamerkurjökull to just north of Höfn to determine which tephra layers were present in the area (Table 1). Eighteen of the 25 profiles contained the white Ö 1362 layer corresponding to a devastating eruption of the Öræfajökull volcano in AD1362 (Reference ThórarinssonThórarinsson, 1958). This layer forms a distinctive couplet in conjunction with a thin layer of black ash directly below and can be traced throughout southeast Iceland. It has primarily been used for separating glacier fluctuations of the last millennium from those earlier in the Holocene (e.g. Reference GuðmundssonGuðmundsson, 1998; Reference BradwellBradwell, 2001a). The number of layers above this couplet identifies whether a profile contains a relatively complete record of volcanic eruptions in the region (Table 1). Tephra dispersal is affected by wind direction and topography, and frequent post-depositional removal or reworking of tephra due to water, wind, slope failure, solifluction and farming necessitates careful correlation between profiles. Those containing the most clearly distinguishable tephra layers (e.g. REFP25) were added to the regional tephrochronology originally established by Thόrarinsson (Reference Thórarinsson1958, Reference Thόrarinsson1980; Fig. 2).
Table 1. Details of reference tephra profiles throughout southeast Iceland from this study


Fig. 2. Stratigraphic sections of the most complete reference tephra profiles in the study area outside LIA glacier limits. G: Grimsvötn; K: Katla; Ö: Öræfajökull; and V: Veiðivötn. REFP25 is indicative of the updated tephrochronology for southeast Iceland (post-AD 1362). See Table 2 for chemical composition of tephra layers.
All layers were logged and selected samples were geochemically correlated to their volcanic source according to Reference Larsen, Thόrarinsdόttir, Óskarsson, Steinthorsson and EinarssonLarsen (1982) using a Cameca SX 100 electron microprobe. The chemical signatures of black or grey basaltic tephras can be used to differentiate between Katla (K) and Grímsvötn (G) sources, particularly using the relative abundance of iron and titanium elements, while the white Öræfajökull (Ö) layer is distinguishable by its silicic content (Table 2). Depth in the stratigraphic profile and comparison to previous investigations in southeast Iceland established the age of key layers (Reference ThórarinssonThόrarinsson, 1958, Reference Thόrarinsson1980; Reference Larsen, Thόrarinsdόttir, Óskarsson, Steinthorsson and EinarssonLarsen, 1982, Reference Larsen2000; Reference Larsen, Gudmundsson and BjörnssonLarsen and others, 1998; Reference BradwellBradwell, 2001a). These layers include those from the AD 1619 eruption of Grímsvötn, which deposited tephra as far away as Denmark, and the AD 1873 Grímsvötn eruption, which produced ∼0.3 km3 of tephra (Reference ThórarinssonThόrarinsson, 1958). However, because multiple Grímsvötn eruptions occurred during the 18th and 19th centuries (see Reference Larsen, Gudmundsson and BjörnssonLarsen and others, 1998), soil accumulation rates were extrapolated to identify the presence of G1873 in REFP25. Soil accumulation rates between conclusively dated layers K1755 and G1934 (excluding tephra layer thickness) totalled 3.1 mm a-1 , producing age estimates of AD 1920 and 1878 for the second and third Grímsvötn layers respectively, which indicates the existence of G1922 and G1873 in the area.
Table 2. Chemical composition expressed as weight% of individual glass shards within tephra layers determined using a Cameca SX 100 electron microprobe and beam current of 10 nA on basaltic shards (Grímsvötn (G) and Katla (K)) and 15 nA on silicic shards (Öræfajökull (Ö)). See also Figure 2. Distinguishing elements used to identify the source volcano are highlighted in bold. The standard deviation (SD) for these elements has also been calculated

Revising the Lia Glacier Chronologies
A total of 15 profiles were dug within LIA glacier limits at both Skálafellsjökull (including Sultartungnajökull) and Heinabergsjökull to search for tephras that would provide a constraint on lichenometric dates (Fig. 1). Profiles containing the most tephra layers were correlated with the updated regional tephrochronology by geochemical correlation (Table 2).
Overall, the presence of the Ö1362 and G1354 couplet in soils immediately beyond the outermost moraines at Skálafellsjökull (REFP22) and Heinabergsjökull (REFP25), and the absence of layers older than AD 1873 within these moraines, indicates that the glaciers extended ∼2-3km beyond their present limits during the LIA maximum. It also suggests that these limits were not exceeded anytime at least during the last ∼650years (Figs 2 and 3).

Fig. 3. Tephra profiles within LIA moraine sequences at Skálafellsjökull (including Sultartungnajökull) and Heinabergsjökull. Tephra layer notation as in Figure 2. See Table 2 for chemical composition of tephra layers. Moraine dates (year AD) derived by various lichenometric methods are assigned to corresponding moraines (see Reference McKinzey, Orwin and BradwellMcKinzey and others, 2004).
Skálafellsjökull
Tephrochronology reveals that the outermost nested LIA moraines in the forelands of Skálafellsjökull and the Sultartungnajökull lobe were deposited after AD 1755 but prior to AD 1873 (Fig. 3). This date suggests an earlier LIA maximum than the widely cited timing of AD 1887 (cf. Reference Evans, Archer and WilsonEvans and others, 1999). The K1755 layer in REFP22 and its reworked, and subsequently redeposited, counterpart provide a maximum date for moraine M1. However, all three basaltic tephra layers found within SJTP01, the first profile inside M 1 , display the chemical characteristics of Grímsvötn, and can be matched to the regional tephrochronology. The basal layer, G1873, is draped directly over glacial till and produces a minimum date for M 1 . This sequence is repeated over a distance of ∼290 m between moraines M2 and M5. A distinct boundary occurs at M5, where only G1934 is draped directly on top of glaciofluvial material. The Skálafellsjökull terminus had already retreated ∼30 m inside M5 before the first map was drawn in AD 1904. The absence of G1922 in profile SJTP04 implies that glacier meltwater had ceased to inundate the area sometime between the Grímsvötn eruptions of AD 1922 and 1934.
Although it is not possible to confirm precisely when during the 118year time-span AD 1755-1873 Skálafellsjökull moraines M1-M5 formed using the tephrochronological record, it is clear that the glacier retreated ∼300m from its maximum LIA extent before AD 1873. Lichenometric dates derived using the population gradient approach for moraines M1 and M5, ∼AD1820 and 1890 respectively (Fig. 3), are generally supported by tephrochronology. These dates suggest long-term retreat interspersed with short-term readvances or stillstands during the waning stages of the LIA in the late 19th century (cf. Reference ThórarinssonThόrarinsson, 1943). In contrast, dates for the deposition of moraines M1 and M5 derived using the lichenometric technique of Reference Evans, Archer and WilsonEvans and others (1999), AD 1897 and 1923 respectively (Fig. 3), are inconsistent with both the minimum bracketing date derived from tephrochronology (<AD1873) and the terminus position in AD 1904 according to the first map of the area produced by the Danish General Survey. At higher altitudes (>300m.a.s.l.), the dearth of soil between moraines M2 and M5 at the Sultartungnajökull lobe precludes tephrochronological constraint of lichenometrically derived dates younger than the LIA maximum, although the lobe appears to have behaved sympathetically with fluctuations of the Skálafellsjökull terminus (i.e. <AD 1 8 7 3 ; Fig. 3).
Heinabergsjökull
The tephrochronological record from Heinabergsjökull also shows that the maximum LIA moraine was deposited after AD 1755 (REFP25) but prior to AD 1873 (HJTP02; Fig. 3). Moraines M1-M5 delimiting a coalesced ice front with Skálafellsjökull are adjacent to part of the sandur that was still active at the beginning of the 20th century as depicted in the AD 1904 map. However, this area must have stabilized before the Grímsvötn eruptions of AD 1922 and 1934 to allow deposition of these tephra layers (profile HJTP01). G1873 appears draped directly above a glacial till layer within profile HJTP02, which suggests that this tephra was removed by meltwater outside of M1, and thus implies that the landform record along this ice margin has been prone to censoring. The presence of G1873 provides a minimum date for M1 and supports an earlier LIA maximum at the Heinabergsjökull margin than the previously published AD 1887 (cf. Reference Evans, Archer and WilsonEvans and others, 1999). The presence of G1934 within profile HJTP06 also closely corresponds to the timing of innermost LIA moraine formation at Skalafellsjokull.
Occurrence of bimodal lichen populations on the outermost Heinabergsjökull moraine (see Reference McKinzey, Orwin and BradwellMcKinzey and others, 2004), in addition to poor preservation potential suggested by the tephrochronological record, implies (1) disturbance to the lichen population at this site (i.e. older lichens have been inherited into a younger population); and (2) that the oldest outermost LIA moraine has probably been censored by more recent glaciofluvial activity. Lichenometrically derived dates based on the population gradient approach place deposition of M 1 , the extant outermost LIA moraine, at ∼AD 1850 (Fig. 3) and deposition of M5 at ∼AD 1880 . These dates are broadly consistent with the revised Skálafellsjökull chronology (Reference McKinzey, Orwin and BradwellMcKinzey and others, 2004). The Reference Evans, Archer and WilsonEvans and others (1999) lichenometric method (Fig. 3) again produces an inconsistent date (AD 1898) for the timing of deposition of M1 when compared with the minimum bracketing date derived from the tephrochronological record (<AD 1873). Overall, tephrochronology suggests that the moraine record at Heinabergsjökull is incomplete and that both glaciers may have reached their LIA maxima at a similar time.
The northern extension of LIA moraines at Heinabergsjökull has been lost due to emptying of a former ice-dammed lake, Dalvatn, which significantly modified the sandur surface during the 1920s (Reference Evans, Archer and WilsonEvans and others, 1999). Soil profiles between remnant moraines M1 and M3 deposited on top of a bedrock outcrop in the middle of the sandur plain suggest deposition before AD1922 (Fig. 3). However, lichenometrically derived dates using either method are inconsistent with the tephrochronological record and appear to be anomalous. Extrapolation of the southern Heinabergsjökull ice margin at the LIA maximum across the sandur plain would intuitively place the extent of its eastern counterpart across the bedrock outcrop (Fig. 1), although this currently remains unsubstantiated.
Implications of An Earlier Lia Maximum
Tephrochronological evidence presented in this paper indicates that both the Skálafellsjökull (including Sultartungnajökull) and Heinabergsjökull lobes of the former piedmont glacier attained their LIA maxima before AD 1873. Integration with lichenometric dates using the more reliable size-frequency approach strongly suggests that this event occurred during the early 19th century (Fig. 4). Along the northeast margin of Vatnajökull, Reference BradwellBradwell (2001b) determined with the lichen size-frequency technique that the previously undated LIA maximum of Lambatungnajökull occurred during the late 18th century. More widely, Reference Kirkbride and DugmoreKirkbride and Dugmore (2001), Reference BradwellBradwell (2004) and Reference Casely and DugmoreCasely and Dugmore (2004) report 18th- and early 19th-century LIA maxima at outlet glaciers draining Eyjafjallajökull and Mýrdalsjökull (southern Iceland) and Öræfajökull respectively, using the lichen size-frequency approach constrained by tephrochronology. Thus, emerging field evidence strengthens the view that Icelandic glaciers reached their LIA maxima earlier than formerly cited.

Fig. 4. Approximate reconstruction of former glacier limits since the LIA maximum at Skálafellsjökull (including Sultartungnajökull) and Heinabergsjökull based on evidence in this study, and maps by the Danish General Survey in 1904 and Landmaælingar Íslands in 1946 and 1989. Bracketing dates are provided by tephrochronology. Italicized dates are lichenometrically derived using the size-frequency approach (see Fig. 3).
A late 18th- to early 19th-century Icelandic LIA maximum also agrees well with climatic evidence. The coldest period of the LIA occurred ∼AD 1780-1800 as indicated by sea-ice and meteorological records (Ogilvie, 1992; Reference Jonsson and GarðarssonJόnsson and Garðarsson, 2001). Reconstruction of glacier equilibrium-line altitudes at Sόlheimajökull (a Mýrdalsjökull outlet) indicates that this cold peak corresponded to a temperature depression of -1.6˚C compared to the 1960-90 mean (Reference Mackintosh, Dugmore and HubbardMackintosh and others, 2002). According to the 19th-century Icelandic instrumental record, episodic glacier expansion (∼AD1850, late 1860s, mid-1870s and ∼1880-90) occurred following cold years with shortened summers and cold, dry winters, a scenario characteristic of the negative mode of the North Atlantic Oscillation (NAO; Reference BradwellBradwell, 2001a; Reference McKinzey, Orwin and BradwellMcKinzey and others, 2004). Dendrochronological reconstructions of the winter NAO index and correlation with ice-core data from Greenland indicate persistent negative phases of the NAO during the 1780s (most negative index), 1810s, 1840s and the second half of the 19th century (Reference Appenzeller, Stocker and AnklinAppenzeller and others, 1998; Reference Cook, d’Arrigo and BriffaCook and others, 1998). These proxy data suggest that the subpolar storm track was displaced southward due to a blocking high-pressure system over Greenland and Iceland during the waning stages of the LIA. Although a direct relationship between Icelandic glacier fluctuations and the NAO index has yet to be demonstrated (see Reference KirkbrideKirkbride, 2002; Reference Hanna, Jόnsson and BoxHanna and others, 2004), a negative NAO phase may produce climatic conditions favourable for glacier growth, particularly cool summers with a subsequent impact on ablation and accumulation (Reference Jόhannesson and SigurðssonJόhannesson and Sigurðsson, 1998; Reference BradwellBradwell, 2001a). Thus, eventual widespread glacier advance may have occurred across southeast Iceland during the late 18th to early 19th centuries in response to secular changes of the NAO index.
LIA glacier response to climatic change differed across the North Atlantic. Similar to the Icelandic record, both the outlet lobes of the Greenland ice sheet and local glaciers in the south and southeast reached their LIA maxima ∼AD 1750-1800, although, as in Iceland, they underwent subsequent but slightly smaller-magnitude readvances between AD 1880 and 1890 (Reference Nesje and DahlNesje and Dahl, 2000; Reference Kaplan, Wolfe and MillerKaplan and others, 2002). However, the Norwegian LIA glacial maximum is strongly centred around ∼AD 1750 (Reference BallantyneBallantyne, 1990; Reference Bickerton and MatthewsBickerton and Matthews, 1993; Reference WinklerWinkler, 2003; Reference Lie, Dahl, Nesje, Matthews and SandvoldLie and others, 2006). This has been attributed to a prevailing positive NAO index, which in turn yielded positive glacier mass balance primarily due to increased precipitation (Reference Nesje and DahlNesje and Dahl, 2003). Overall, the complicated pattern of glacier fluctuations across the North Atlantic, and the data derived from historical and instrumental records and climatic reconstructions indicate that additional work is necessary to advance our understanding of glacier-climate interactions during the LIA.
Conclusions
The tephrochronological record in southeast Iceland has been used to constrain different lichenometric dates for LIA moraines at Skálafellsjökull (including the Sultartungnajökull lobe) and Heinabergsjökull. Our findings are summarized as follows:
-
1. Updating Reference ThórarinssonThórarinsson’s (1958) southeast Iceland tephrochronology (both the number of tephra layers present and determining their geochemical signature) provides a more complete record of volcanic eruptions that have affected the region. Most significantly, it can now be used as an enhanced dating tool.
-
2. Tephrochronological evidence indicates that both the Skálafellsjökull and Heinabergsjökull lobes of the former piedmont glacier attained their LIA maxima between AD 1755 and 1873. The population gradient lichenometric method narrows this window to the early 19th century (∼AD 1820), thus clarifying the timing of the LIA maximum at Skálafellsjökull and Heinabergsjökull.
-
3. The revised glacier chronologies are compatible with evidence of earlier LIA maxima elsewhere in Iceland, including other Vatnajökull margins. Proxy sources, including sea-ice, historical and instrumental records, in addition to reconstructions of the NAO, strongly support a late 18th- to early 19th-century LIA maximum in southeast Iceland. This is in contrast to the situation in Norway, where many glaciers had already reached their LIA maxima by AD 1750. Thus, LIA glacier-climate interactions across the North Atlantic were complex, and various climatic conditions related to the NAO influenced glacier fluctuations throughout the region differently.
Acknowledgements
This research was funded by the Institute of Geography at The University of Edinburgh, The Mackay Fund, The Royal Scottish Geographical Society and The Leverhulme Trust. We thank J. Mitchell, A. Newton and the Electron Microprobe Unit at the University of Edinburgh, and R. Ólafsdóttir and the residents of southeast Iceland for their interest in this research. K.M. was grateful for field assistance from J. Orwin, K. Elsmore, P. Tims and E. Wallington. We thank R. Schütt, A. Dugmore, D. Sugden and an anonymous reviewer for helpful comments on the manuscript. T.B. publishes with permission of the Director, British Geological Survey (Natural Environment Research Council).