


Introduction
The Thwaites Glacier/iceberg tongue complex, located at about 74°30’S, 108°W in the Walgreen Coast area, has been a significant feature of the Antarctic coastline for at least the last 50 years. In recent time, it has projected farther out to sea than any other single glacier on Earth (Reference SwithinbankSwithinbank, 1988), over 250 km from the grounding line on Thwaites Glacier to the northern tip of the iceberg tongue.
In 1986, the same year that large calving events occurred in the Filchner and Larsen Ice Shelves (Reference Ferrigno and GouldFerrigno and Gould, 1987), and during the period of time that the Wordie Ice Shelf was undergoing rapid disintegration (Reference Doake and VaughanDoake and Vaughan, 1991), an analysis of National Oceanic and Atmospheric Administration Advanced Very High Resolution Radiometer (NOAA/AVHRR) images indicated that major change was beginning to occur in the shape and position of the Thwaites Glacier/ iceberg tongue. The melting of fast ice and calving of several icebergs from the area between the southern end of the iceberg tongue and the terminus of the glacier tongue left more than 30 km of open water where the iceberg and glacier tongues had been connected by fast ice and icebergs the previous year. Landsat imagery in 1988, 1989 and 1990 revealed that the iceberg tongue had rotated from a primarily north-south orientation to an east-west orientation and drifted more than 80 km westward to a position north of Martin and Bear peninsulas. AVHRR images acquired in October 1991 and January 1992 showed further westward movement of the iceberg tongue of about 60 km. In all, approximately 140 km of westward movement occurred between 1986 and January 1992.
History of Observation and Mapping
Thwaites Glacier and Thwaites Glacier tongue were first sighted by members of the 1946–47 U.S. Navy Antarctic Expedition. Aerial photographs were taken during this period as part of Operation Highjump, the largest concerted single effort to photograph Antarctica — a project that yielded more than 65 000 aerial photographs (Reference ByrdByrd, 1947). At that time, the glacier tongue was at least 95 km long and averaged 60 km in width. The aerial photographic coverage did not define the terminus of the glacier precisely, and reconnaissance maps compiled from these photographs show a generalized glacier outline with an indefinite terminus (U.S. Navy, 1962). As no additional aerial photographs were acquired of this area for several years, the American Geographical Society’s 1965 1 : 5 M map of Antarctica contained the same glacier outline. The next aerial photographic flights over the Thwaites Glacier occurred during Operation Deepfreeze, 1967. Many missions were flown over the Walgreen and Eights coasts and the resultant aerial photographs were used to map the area much more accurately. The 1967 aerial photographs showed that Thwaites Glacier had advanced northward into the Amundsen Sea and calved to produce Thwaites iceberg tongue, which remained adjacent to Thwaites Glacier, but inclined slightly northwest. The U.S. Geological Survey used the new data to produce the 500 Κ 1968 Bakutis Coast-Marie Byrd Land Sketch Map. The American Geographical Society published an updated version of their 1:5 M Antarctica map in 1970 incorporating this and other mapping improvements. The glacier and iceberg tongue were mapped to extend 75 km further north than previously mapped, but it is not clear how much of this extension is due to forward motion and how much is due to the earlier mapping being incomplete.
In 1972 the launch of Landsat 1, then known as ERTS-1, and the acquisition of several thousand satellite images, made it possible greatly to improve the accuracy of mapping in Antarctica (Reference Southard and MacDonaldSouthard and MacDonald, 1974). As pointed out by Southard and MacDonald, “a single Landsat scene covered the same area as 1320 1 :40 000-scale aerial photographs and improved the absolute and relative positions of shorelines, ice tongues, and other features because, with the limited amount of control in most Antarctic regions and the large number of aerial photographs, it was not possible to maintain scale and position throughout map compilation”. The U.S. Geological Survey used the Landsat image data to produce a 1 :1 M scale 1975 experimental image map entitled “Thurston Island-Thwaites area, Antarctica”. The Landsat images significantly improved the accuracy of the mapped size and position of the Thwaites Glacier/iceberg tongue. The dimensions shown for Thwaites Glacier are 100 km long from the grounding line to the ice front with the main area of flow being between 30 and 50 km wide. The iceberg tongue was 150 km long and ranged in width from 35 to 65 km. Figure 1 shows the changes in position of Thwaites Glacier/iceberg tongue as shown on maps and satellite data.
Landsat imagery continued to be acquired of Antarctica in an ad hoc manner through the 1970s and into the 1980s, and it was recognized that Landsat data was valuable for many glaciological and geological applications as well as for mapping (Reference Ferrigno, Williams, Southworth and MeunierFerrigno and others, 1983). In 1987, an international consortium of SCAR nations initiated a project to acquire cooperatively Landsat 4 and 5 data of coastal Antarctica. Several thousand images were acquired between 1986 and 1991. Although less than 20% of these images were considered useful because of cloud cover or sun angle, the number of useful images was sufficient to cover approximately 90% of the coastal regions of Antarctica (Reference Ferrigno, Molnia, Lucchitta and WilliamsFerrigno and others, 1991).

Fig. 1. Sketch map of the changes in position of Thwaites Glacier and iceberg tongue as shown on maps and satellite data.
A new set of 24 1 M scale coastal maps of Antarctica is currently being produced by the U.S. Geological Survey. These maps are being compiled comparing the archive of early Landsat data with the more recently acquired Landsat imagery, and are intended to delineate glaciological features and show coastal change. The first map in the series will be of Thwaites Glacier area.
Importance of Thwaites Glacier Area
It is important to map and understand the Thwaites Glacier area as thoroughly as possible not only to understand the glacier itself, but also because of the major contribution of this large glacier to the mass balance of the West Antarctica ice sheet. According to McIntyre (Reference SwithinbankSwithinbank, 1988), Thwaites Glacier drains an area of approximately 121000 km2, about 7% of the West Antarctica ice sheet. With a reported velocity of as much as 3.6 km a−1, Thwaites was thought to be one of the fastest glaciers on the continent. The estimated balance discharge of 47 km3 a−1 was also thought to be one of the largest in Antarctica. However, up to now, precise information about the area has been very sparse. By determining the velocity of the Thwaites Glacier more precisely, the issue of the mass balance of the West Antarctica ice sheet could be discussed. In addition, the question of a possible relationship between the changes in velocity and changes in position of the iceberg tongue could be examined.
Earlier Velocity Estimates
The first velocity estimates for Thwaites Glacier were made by R.J. Allen in 1977. He compared features on Thwaites Glacier and iceberg tongue on aerial photography from 1947 and 1967 with 1972 Landsat images and measured average annual displacements of 3.7 and 2.3 km a−1. Using his photogrammetric experience and taking into consideration the lack of definable features and the poor control in the area, he estimated an average velocity of 2.0 to 2.9 km a−1 to be more accurate.
Reference Lindstrom and TylerLindstrom and Tyler (1985) also made velocity estimates for Thwaites Glacier. They estimate the velocities of 33 points on Thwaites Glacier and iceberg tongue using Landsat imagery from 1972 and 1983. Their results ranged from 2.99 to 4.02 km a−1 with an average of 3.6 km a−1, but the accuracy of their figures is uncertain.
Their velocity estimates are based on the assumption that the velocities of all icebergs in the fast ice, which they are using as control in the absence of stable ground points common to the two images, are equal. Our results, discussed later in this paper, demonstrate that velocities are not homogeneous in the glacier tongue area.
Current Velocity Measurements
For this paper we used velocity measurement techniques developed by the U.S. Geological Survey in Flagstaff, Arizona. For a thorough discussion of the method, see the paper by Lucchitta and others in this volume. In brief, multiple Landsat images in digital form are coregistered using reliable ground control points. The scenes are then simultaneously examined on image display equipment and common features such as crevasses are identified on the scenes. A computer program uses the identified points to calculate the distance between the two points on the individual images. Knowing the distance travelled and the time interval between the image acquisitions, it is possible to determine an average velocity per year for each point. With precisely identifiable ground-control points on the images, the accuracy of registration is one pixel or less. The accuracy of identifying common features is about 3 pixels, giving total accuracy of about ±4 pixels. This translates to an error of ±0.8% on the total distance travelled and the average annual velocity computed for the Thwaites area.

Fig. 2. A portion of Landsat image 50276–14524 of the Thwaites Glacier area, Antarctica, acquired 2 December 1984. This image was compared with Landsat image 1157–14383 acquired 27 December 1972. The vectors show the displacement of features, such as crevasses, that are common to both images and were used to calculate the average annual surface velocity of the glacier during the time between the two images. The unmarked end of the vector lies on the feature that was used. The x lies on the position of the feature on the 1972 image. The glacier tongue was divided into three paths that appeared to have different flow regimes. The average velocities for the paths are in the text. The overall average annual velocity for the glacier between 1972 and 1984 was 2.62 km a−1.
The velocity measurements on Thwaites Glacier were made using five Landsat images from three different days — a Landsat 1 multispectral (MSS) scene from 27 December 1972, two consecutive Landsat 5 MSS scenes from 2 December 1984, and two consecutive thematic mapper (TM) scenes from 9 January 1990. The 1972 and 1984 MSS data were purchased as computer compatible tapes (CCTs); the TM data were purchased as photographic prints, photocopied to produce a film negative, then scanned by an optical scanner to produce a digital version of the image. It would have been preferable to use TM CCTs, but cost considerations made that alternative unfeasible. The consecutive scenes were mosaiced together; then all scenes were coregistered to the 1984 image, which was considered to have the most stable internal geometry and scale, using four fixed and easily identifiable ground control points. Consecutive scenes were used in 1984 and 1990 to provide adequate control over the entire area and to prevent distortion in the registration process.

Fig. 3. A portion of Landsat image 50276–14524 of the Thwaites Glacier area, Antarctica, acquired 2 December 1984. This image was compared with Landsat image 42734–14552, acquired 9 January 1990. The vectors show the displacement of features, such as crevasses, that are common to both images and were used to calculate the average annual surface velocity of the glacier during the time between the two images. The unmarked end of the vector lies on the feature that was used. The x lies on the position of the feature on the 1990 image. The glacier tongue was divided into three paths that appeared to have different flow regimes. The average velocities for the paths are in the text. The overall average annual velocity for the glacier between 1984 and 1990 was 2.84 km a−1.
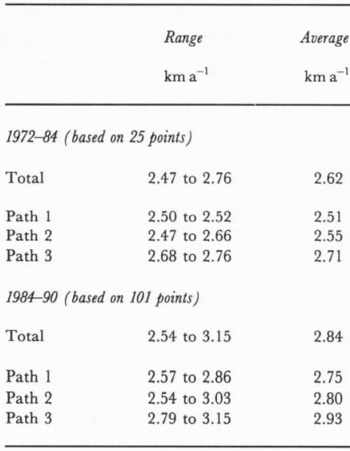
The images were displayed, and as many identical features as possible were identified on the main flow area of the Thwaites Glacier. Areas at the lateral margin of the glacier were avoided because the flow in these areas was thought to be non-representative. The highly crevassed surface of the glacier tongue made it possible to select many points where there was sufficient area of overlap. When the 1972 and 1984 images were compared, 25 points were selected as the area of overlap was limited, and when the 1984 and 1990 images were compared, 101 points were selected. The identified points were then analyzed to determine the distance travelled for each and the average annual velocity. The values for the annual surface velocity for the 25 points during the 1972 to 1984 time interval ranged from 2.47 to 2.76 and averaged 2.62 ± 0.02 km a−1. The glacier tongue was then visually inspected on the Landsat imagery to see if different flow regimes could be identified. Three different paths or areas were tentatively outlined and the average velocities compared for each path. Vectors were plotted to represent the distance travelled for each point (Fig. 2). The average velocities for the two points in path 1 ranged from 2.50 to 2.52 and averaged 2.51 kma−1. The eleven points for path 2 ranged from 2.47 to 2.66 and averaged 2.55 km a−1. Path 3 was slightly faster with twelve velocity figures that ranges from 2.68 to 2.76 and averaged 2.71 km a−1.
The same procedure was carried out using the Landsat images from 1984 to 1990. The average velocity for the 101 points was 2.84 km a−1 with a range from 2.54 to 3.15 km a−1. The glacier tongue was divided into the same three flow paths as above. The three paths showed the same relationship as before with paths 1 and 2 having average velocities of 2.75 and 2.80 kma−1 and path 3 equalling 2.93 km a−1 (see Fig. 3 and Table 1).
Table 1. Average annual surface velocities of Thwaites Glacier
Conclusions
The velocity calculations made for this paper indicate that Thwaites Glacier has a lower velocity and therefore a smaller mass balance discharge than previously thought. However, the most important facet of the velocity measurements is that they show an increase of greater than 8% in the average annual velocity during the 1984 to 1990 time frame (2.84km a−1) compared to the 1972 to 1984 time period (2.62 km a−1). Earlier velocity estimates have enough uncertainty that it is impossible to drawn conclusions about the trend of the velocity over a longer period of time. This much increase in the average annual velocity of Thwaites Glacier leads to questions about what is happening to other outlet glaciers of the West Antarctica ice sheet in order to determine if this is a local or regional phenomenon. This study provides direct evidence about the possible thinning of the West Antarctica ice sheet. Reference HughesHughes (1973, 1975) has referred to West Antarctica as the “weak underbelly of Antarctica” and raised the hypothesis of a surging ice sheet. The increase in velocity of this major outlet of the West Antarctica ice sheet raises concerns about the reality of Hughes’ theories.
At this stage, we only have a small amount of data to help examine the questions that are raised but it becomes immediately obvious that it would be worthwhile to design a comprehensive monitoring program of the major outlet glaciers of the West Antarctica ice sheet using digital processing of Landsat data acquired at regular intervals of between three and five years to measure surface velocity accurately.
It is possible to draw two additional conclusions about Thwaites Glacier based on this study. It has been suggested that Thwaites Glacier is now surging or has surged in the recent past. Our evidence does not support such an hypothesis. The glacier may be in a state of continuous rapid flow, but examination of the regular crevasse pattern on Thwaites Glacier and Thwaites iceberg tongue, which at the current velocity represents a history of over 100 years, does not suggest that the glacier has been affected by changing stresses, such as a surge would generate.
The second conclusion concerns the suggestion by Reference Kellogg and KelloggKellogg and Kellogg (1987) that Thwaites iceberg tongue may have been calved from Pine Island Glacier. Comparison of the appearance of the two glaciers, especially downstream from the grounding lines, leads to the conclusion that this is unlikely. Thwaites Glacier has a regular pattern of crevasses beginning just downstream of the grounding line and continuing for about 100 km similar to the pattern of the iceberg tongue. Pine Island Glacier has only a few major crevasses in the more than 80 km from the grounding line to the glacier terminus.


