Introduction
Special studies and issues (Reference Dahl-Jensen and JohnsenDahl-Jensen and Johnsen, 1986; Reference MacAyeal, Firestonc and WaddingtonMacAyeal and others, 1991: Palaeogeography, Palaeoclimatology, Palaeoecology, 1992) have been devoted to the inverse problems and methods aimed at reconstruction of past climatic changes from temperature measurements in deep boreholes. As a rule, this approach is extremely limited in application if no additional information about the form of an inferred paleotemperature time curve is taken into account. On the other hand, there is abundant evidence that Milankovich astronomic cycles probably were dominant in the Pleistocene climate oscillations (e.g. Reference JouzelJouzel and others, 1987; Reference Martinson, Pisias, Hays, Imbri, Moore and ShackletonMartinson and others, 1987).
Estimations based on theoretical approaches (Reference BuddBudd, 1969; Reference Muravyev and SalamatinMuravyev and Salamatin, 1990) and numerical predictions (Reference RitzRitz, 1987) have shown that in the central parts of Antarctica the last 20-100 kyear periods of the Milankovich harmonic components of surface-temperature variations penetrate through the ice sheet down to its bottom, fading in amplitude not more than 5 times while passing 1--3 km, respectively. Short-term temperature variations with periods less than 3-5 kyear with comparatively small amplitudes (<1-2°C) are almost completely filtered out in the upper part of the ice sheet (above a depth of 200-300 m) and cannot be observed in the deeper strata, while long-term variations with periods exceeding 300 kyear do not induce a detectable wave-shape signal in the vertical temperature profile because of insufficient thickness of the ice. The expected perturbations of the temperature field in the ice sheet, induced by the 20 100 kyear long paleoclimate oscillations (Reference LoriusLorius and others, 1985; Reference JouzelJouzel and others, 1987), appear to be not less than 0.2-1.0°C. Since the temperature measurements made in the 2000 m deep borehole at Vostok Station have an absolute error of 0.05°C, they provide a certain registration of such a record.
From the above discussion, it seems reasonable for our purpose to imagine the surface temperature oscillations as a sum of harmonics with the fixed Milankovich periods of 100, 41, 23 and 19 kyear. Hence, only their amplitudes and phase lags are to be found by minimizing a standard deviation between the theoretical temperature distribution and the experimental temperature profile measured in the Vostok borehole. Then a comparison of the inferred paleotemperature-time curve with the ice-core isotope record would provide a possibility of verifying the age of the main climatic events independently of the ice-sheet dynamics dating. For the implementation of this plan, a sufficient mathematical model providing simulation of non-stationary temperature fields in the central part of the Antarctic ice sheet taking account of inhomogeneity and compressibility of the near-surface strata (Reference SalamatinSalamatin, 1991) has been developed by Reference Salamatin, Lipenkov and BlinovSalamatin and others (in press).
Thus, the dating approach introduced in this paper combines the inverse procedure with an orbital tuning concept: a “metronomic record” destined for adjusting the isotope record time-scale is derived here from the borehole-temperature profile using the common assumption for orbital tuning about the linear climate response to variations in the Earth's orbital parameters. Although there is evidence of non-linear effects associated with ice-sheet waxing and waning (Reference Imbrie and ImbrieImbrie and Imbrie, 1980) as well as with the amplifying role of greenhouse gases (Reference GenthonGenthon and others, 1987), it has already been shown that they mainly result in the shape of climatic events, while their timing does not change more than 3 kyear (Reference Martinson, Pisias, Hays, Imbri, Moore and ShackletonMartinson and others, 1987). This is the basic belief of the authors which ensures the validity of further considerations. Indeed, the detailed temperature history older than 50-100 kyear does not noticeably affect the measured temperature depth profile and the borehole thermometry alone could not resolve the surface-temperature variations at greater times.
Experimental data
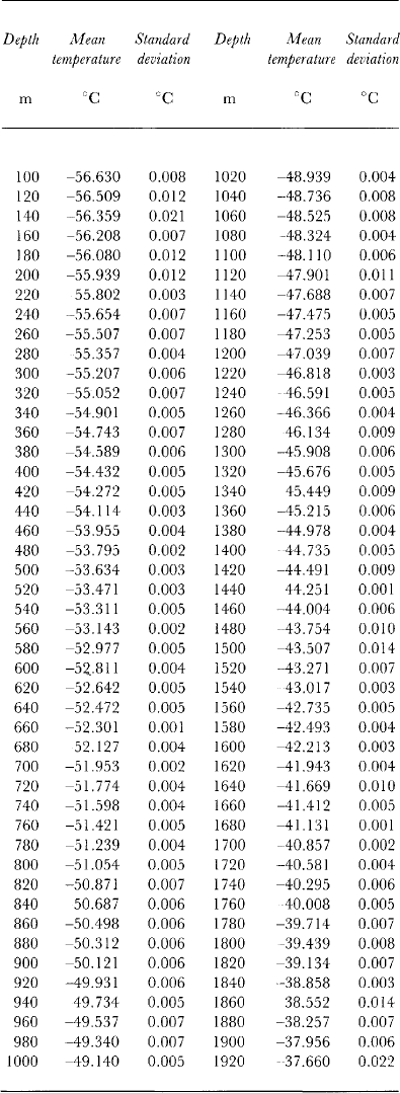
Systematic temperature measurements in the deep boreholes drilled at Vostok Station were started in 1972 in the dry hole which reached a depth of 950 m. The results of geophysical studies that were carried out at the station in different boreholes before 1983, including temperature measurements made down to 2040 m in deep borehole 3G, were summarized by Reference Vostretsov, Dmitriyev, Putikov, Blinov and MitinVostretsov and others (1984). The accuracy of these data below 900 m does not exceed 0.1°C because they were obtained soon after the drilling was completed. Then temperature logging of borehole 3G was repeated several times during 1983-88. The last and most precise set of data was obtained in 1988 when the temperature profile was measured three times during the year: in April, July and September, with four-five readings each time at each depth. This has allowed us to estimate the experimental reproducibility of the measurements which has been found to be 0.005-0.01°C, while absolute accuracy of the data is considered to be about 0.05°C. The average values of the temperature together with its standard deviations at each examined depth level are presented in Table I. The accuracy achieved in this set of measurements is about one order greater than that of the joint results from 1972-82 (Reference Vostretsov, Dmitriyev, Putikov, Blinov and MitinVostretsov and others, 1984), which were used earlier by Reference RitzRitz (1989) for verification of their agreement with the ice-core isotope analysis. Let us assume hereafter the temperature T h 0 =-57.4°C to be a reference origin point close to the mean contemporary temperature observed on the ice-sheet surface at Vostok Station. The present-day accumulation rate w h 0 expressed in ice equivalent is supposed to be within the range of 2.0-2.7 cm year-1 (Reference LoriusLorius and others, 1985; Reference JouzelJouzel and others, 1993) and the glacier thickness h 0 is estimated as 3725 m, according to direct measurements by Reference Kapitsa and SorokhtinKapitsa and Sorohtin (1965) and temperature simulations by Reference Barkov, Blinov, Petrov and SalamatinBarkov and others (1989). The ice-sediment density (ρ) variation versus depth (h) caused by the firn and ice densification (Reference Salamatin, Lipenkov, Smirnov and ZhilovaSalamatin and others, 1985) can be approximated by the following relation:
where ρ0 is the density of pure ice (0.92 Mg m-3), γ= 0.021 m-1, c h =0.69.
Table 1. Borehole temperature (experimental data)
The corresponding ice-sheet thickness in ice equivalent h ' 0 is 3692 m and the fusion temperature T f at the bottom (pressure-melting point) is about -2.4°C. Additionally, the researches by Reference ShumskiiShumskii (1969) and Reference Vostretsov, Dmitriyev, Putikov, Blinov and MitinVostretsov and others (1984) have shown that the thermal conductivity coefficient of firn and ice with air inclusions differs from the thermal conductivity λ of pure ice. Their ratio Λ depends on the relative density ρ* = ρ/ρ0 following Maxwell's formula (Reference ShumskiiShumskii, 1969; Reference Muravyev and SalamatinMuravyev and Salamatin, 1990):
Model description
The following studies preceded the final formulation of the mathematical model for temperature simulation in the ice sheet at Vostok. First, the general equations describing the glacier flow along a fixed flowline and taking account of the inhomogeneity and compressibility of near-surface ice strata were derived by Reference SalamatinSalamatin (1991). Then, the latter were investigated to estimate the possible influence of their different terms and factors on the temperature predictions (Reference Salamatin, Lipenkov and BlinovSalamatin and others, in press). In particular, the analysis of these equations shows that the convective-heat transfer in the vertical direction (provided that the profile of the density ρ is invariant in time) is governed by the effective rate of the ice-mass transfer, which can be expressed in the dimensionless form:
Here, W h and W 0 are the relative rates of the surface accumulation and the basal ice melting normalized by w h 0; Z and Δ are the distance from the bed and the ice-sheet thickness in ice equivalent related to h ' 0, respectively; σ is the imitation switch parameter, i.e. the ratio between the ice-flow rate which corresponds to the glacier body plastic deformation and the total flow rate which includes ice sliding at the bottom: 0 ≤ σ ≤1 (σ = 0), when ice sliding takes place in the basal layer and the shear strains in the glacier body are zero; σ = 1, when there is no ice sliding at the bed); α is the creep index in Glen's rheological law modified for non-isothermal conditions in accordance with the theory of Reference LliboutryLliboutry (1979); t = τwh 0/h’ 0 is the dimensionless form of the time τ.
To make it clear, it must be mentioned that Equation(3) was deduced on the basis of conventional assumptions of the thin-layer approximation theory. However, W* is not exactly the vertical velocity of the ice. Actually, this value describes the ice movement in the normalized Z*- coordinate system and, thus, takes into account temporal and longitudinal variations of ice-sheet thickness.
The following assumptions were also discussed and justified for the Vostok region by Reference Salamatin, Lipenkov and BlinovSalamatin and others (in press):
The strain heating in the near-bottom ice layer in the vicinity of Vostok Station remains practically invariant in time. Its influence on the temperature distribution in the upper 2000 m of ice strata can be taken into account by appropriate correction of the geothermal flux q0 at the ice-rock interface.
The longitudinal convective-heat transfer does not render noticeable influence on the formation of temperature perturbations in the ice sheet linked with changes in climatic conditions, and the corresponding effect on the stationary component of the temperature field is negligibly small in comparison with the existent uncertainty of the model parameters.
The simplified model (Reference RitzRitz, 1989)
where (.)denotes long-history time averaging, can be accepted to estimate possible maximal ice-thickness oscillations in the vicinity of Vostok Station and their effect on the temperature profile in the ice sheet.
If the ice sheet is assumed to be composed of pure ice throughout its thickness, one must write the special boundary conditions on its surface not to violate the heat balance and temperature distribution below the upper heterogeneous layer:
Where θ and θ h are the dimensionless temperatures in the ice sheet and on its surface, respectively, θ = (T-Th 0) / (Tf-Th 0); T is the temperature in °C.
The computational experiments performed by Reference Barkov, Blinov, Petrov and SalamatinBarkov and others (1989) and by Reference RitzRitz (1989) have made it evident that the basal ice in the vicinity of Vostok Station is at its melting point. Hence, using Equations (1) and (2) to evaluate the integral in relation (5), we finally arrived at the following quasi-one-dimensional heat-transfer model (Reference Salamatin, Lipenkov and BlinovSalamatin and others, in press):
Here, t 0 is the whole time interval in the past taking into consideration (t 0 > 0): c * and λ* are the relative specific heat and thermal conductivity coefficients of ice normalized by their corresponding values c 0 and λ 0 at a temperature of -30°C; Pe = c0ρ0wh 0h’ 0/λ0 is the Peelet number;
In accordance with Reference BuddBudd (1969) and Vostretsov and others (1984):
The relative ice-melting rate at the bed in Equation (3) is determined by equation:
Criteria K q (dimensionless geothermal flux) and K f (phase-change number) are given by formulas:
where L = 333 kJ kg-1 is the latent heat of ice fusion.
An appropriate relation between the climatic characteristics W h and θh is to be formulated to complete the mathematical model for the simulation of non-stationary temperature processes in the ice sheet. The findings of Reference Robin and deRobin (1977) give us the basis for expressing the accumulation rate via the water-vapor pressure in the air. Using the empirical Magnus's formula and following Reference JouzelJouzel and others (1987) and Reference RitzRitz (1989), for relatively small surface-temperature variations θ h, one can obtain:
With β*w≈4.12×10³/(Tf-Th 0)/(273.15+0.67T h 0)2≈4.1 at Vostok.
Finally, substitution of the latter expression into Equation (4) yields the model for the ice-thickness calculation (Reference Salamatin, Lipenkov and BlinovSalamatin and others, in press):
Inverse procedure
As has already been mentioned, the high-frequency paleotemperature records (of periods less than 3-5 kyear) are filtered out and do not penetrate into the Antarctic ice sheet deeper than 200 m, because of the low thermal conductivity of the upper firn-ice sediments. On the other hand, long-period temperature oscillations on the ice-sheet surface (with periods larger than 300 kyear) do not induce noticeable temperature fluctuations in the ice because of its limited thickness. At the same time, the temperature profile from the deep borehole drilled at Vostok can contain information about temperature variations with Milankovich astronomic periods (τ1 = 100, τ2 = 41, τ3 = 23, τ4 = 19 kyear) over the last climatic cycle. These oscillations prevail in the known paleo-climatic records (e.g. Reference JouzelJouzel and others, 1987; Reference Martinson, Pisias, Hays, Imbri, Moore and ShackletonMartinson and others, 1987). Hence, the interred component of climate changes on the Antarctic ice-sheet surface in the vicinity of Vostok Station can be written as a sum of harmonics:
where Ω i = 2πh ’ 0 / (τ i w h 0). Obviously, this sum does not take into account individual secondary details and, therefore, may differ from the real temperature variations in the magnitude of amplitudes and in the relative height of peaks. The values Ω i are fixed and there are eight unknown parameters: Ai and Bi (i = 1, ..., 4) in Equation (11).
Let us denote a sufficiently large interval of time in the past: t0 » t1 = τ1wh 0/h' 0 and introduce an initial condition in the boundary value in problem (6) in the following form:
where θ0 is the steady-state temperature distribution in the ice sheet with the surface temperature![]()
Then, let θ ex be the dimensionless temperature profile measured in the deep borehole at Vostok Station at points Z = Zk, k = 1, ..., N. The mean square-deviation function can be defined on the basis of the mathematical model (3), (6) (12) and the experimental temperature profile:

Thus, the inverse procedure of inferring the climatic parameters, Ai, Bi(i = 1 ..., 4) comes to the problem of minimizing the S-function at fixed plausible values of ![]()
The solution of the boundary-value problem (3), (6) (12) is computed, using the finite-difference method in accordance with the implicit time-scheme algorithm. The space step for the Z* -coordinate is 1/40. The time-interval length t0 is taken equal to 3t 1 and the time step is t 0/150. The choice is based on the preliminary test runs of the model. This ensures that the accuracy of the calculations is not worse than the reproducibility of the field measurements.
The minimization of target function (13) is performed on the basis of the Newton method and the gradient method of steepest descent. A special interactive computer system for IBM-PC has been developed to perform the inverse procedure and the comparison of the reconstructed paleotemperature-time curve with clim-atic records from the Vostok ice core.
Paleoclimatic reconstruction
All computations on paleotemperature reconstructions considered in this section have been performed using the data obtained in 1988 (see Table 1). The total number of various sets of numerical experiments at different plausible values of the model parameters:![]() has exceeded 100.
has exceeded 100.
The starting tests have revealed the fact that the possible small variations of the mean surface temperature within the range -0.09 < (θ h) < -0.05 (i.e. -62.35 < (T h) <-60.15°C) do not influence the accessible minimal level of deviation (13) and the inferred clima tic signal. Therefore, this parameter should be fixed. According to the Vostok isotope record (Reference JouzelJouzel and others, 1987), the (θ h) value is taken hereafter equal to -0.07 (i.e. (T h) = -61.25°C).
Following Reference LliboutryLliboutry (1979) and Reference RitzRitz (1989), the non-isothermal conditions of the Antarctic ice-sheet shear deformation in the basal layer can be modeled assuming ∝ ≈ 10. With this assumption, the two limiting situations are considered: (1) σ = 1, when the ice-sliding velocity on the bedrock is zero, and (2) σ =0 (i.e. ∝ → ∞) with no shear strain in the bottom ice. The minimum of the standard deviation S between the computed and observed temperature profiles is determined for different values of the geothermal flux (including strain heating) and the present-day accumulation rate within the intervals: 2.0 < wh 0 < 2.7 cm year-1 and 0.05 < q 0< 0.06 W m 2. In both cases, the best fits are found at q 0 ≈ 0.053 W m 2 and at definite values of wh 0:
-
for σ = 1 wh 0 = 2.6 cm year-1 (Pe = 2.06, Kq= 1.4, Kf = 6.6) A1 = 0.0835, A2 = -0.0505, A3 = -0.0677, A4 = 0.0082; B1 = 0.0358, B2 = 0.0546, B3 = -0.0239, B4 = 0.0241; S = 1.67 × 10⁻⁴ (~0.0092°C);
-
for σ = 0 wh 0 = 2.2 cm year-1 (Pe = 1.7, Kq = 1.4, Kf = 5.6) A1 = 0.0880, A2 = -0.0566, A3 = -0.0638, A4 = 0.0142: B1 = 0.0614, B2 = 0.0577, B3 = -0.0345, B4 = 0.0366; S = 1.71 X 10⁻⁴ (~0.0094°C).
The corresponding temperature-time curves are presented in Figure 1a and will be referred to hereafter as I and II, respectively. The discrepancies between the computed and observed temperature profiles are of the same order as a reproducibility of the experimental data (see Fig. 1b).
The minimization procedure is tested at various initial values of amplitudes Ai, Bi, i = 1, .., 4. In a single case, for the condition with σ = 1 another minimum with standard deviation close to the best fit I has been found at wh 0 = 2.4 cm year-1. The corresponding paleotemperature reconstruction (see curve III in Figure 1a) is very different in shape from the two main variants I and II among all tested, while no significant change in climatic event timing is observed. The shift of age for reconstructed temperature oscillations always remains less than 3 kyear.
Additional computational experiments have been performed to estimate the sensitivity of the deduced paleotemperature curve to the different boundary conditions and properties of ice. For instance, if the water produced by melting at the bottom of the ice sheet does not penetrate into the underlying rock and a subglacial lake is formed, the bottom melting rate W 0 tends to zero which can formally be taken into account by assuming the dimensionless number K f in Equation (8) equal to infinitv. In this case, the best fit has been determined at wh 0 = 2.3 cm year-1 (σ= 0). The different thermophysical properties of ice: c 0 = 1.9 kJ kg-1°C-1, λ0= 2.66 W m 1°C l; α*c = 0.193; a*λ= 0.308 used by Reference RitzRitz (1989) have also been considered. The optimal value of accumulation rate w h 0 is 2.25 cm year -1 at σ = 1 In the two above cases q 0 is found to be equal to 0.053 W m 2 and S ≈ 1.7 × 10⁻⁴ (~0.0094°C). It is also remarkable that the predicted best-fit accumulation rate falls within the above- mentioned range of experimental data for the recent precipitation at Vostok.
All the computational tests, as well as numerical experiments with various values of β * w in Equations (9) and (10), fully confirm the conclusion that in spite of the fact that computed paleotemperature oscillations can significantly differ from one variant to another by the amplitudes of their harmonic components, nevertheless, the principal events (peaks and troughs) in the simulated curve are always reproducible, easily recognizable and their ages are definitely predictable. The paleotemperature signal deduced from Equation (11) should be regarded only as a dominant "metronomic" part of the past surface-temperature variations. It cannot quantit-atively give the real ~(detailed) surface-temperature oscil-lations.
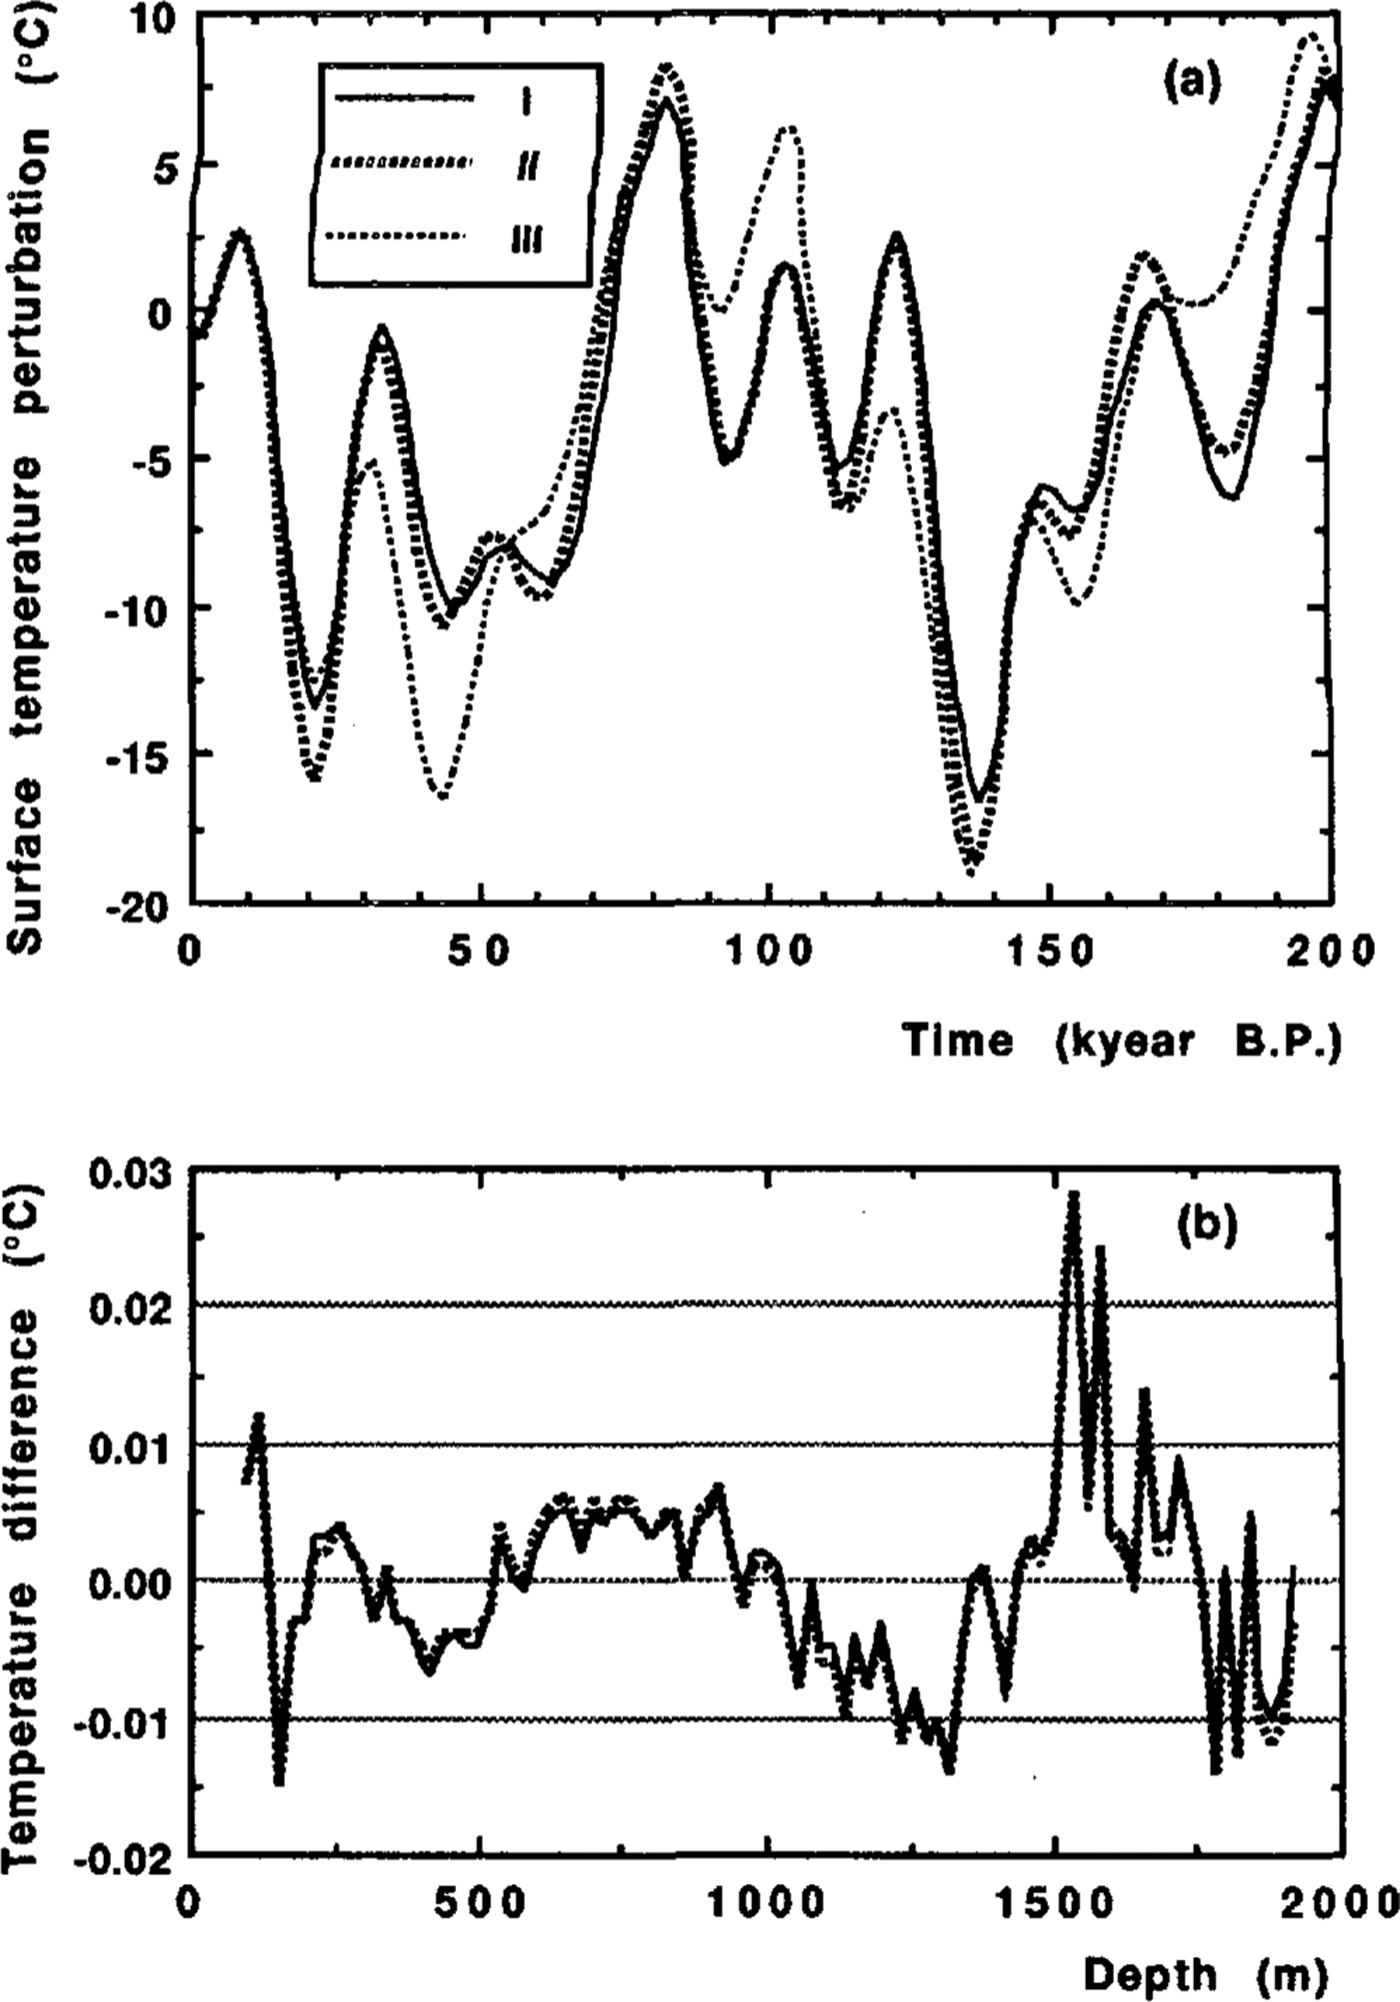
Fig. 1. a. Surface-temperature variations versus time inferred by inverse procedure from a borehole-temperature profile under the different assumptions: (1) when there is no sliding at the ice rock interface (σ = 1); (II) basal-sliding condition (σ = 0); (III) particular variant for a non-sliding condition (σ = 1). b. Mismatch between the computed and observed borehole-temperature profiles referred to variants I, II and III.
Vostok climate-record dating
Isotope, atmospheric gas and aerosol analysis of the Vostok ice core (Reference LoriusLorius and others, 1985; Reference JouzelJouzel and others, 1987; Reference Petit, Mounier, Jouzel, Korotkevich, Kotlyakov and LoriusPetit and others, 1990; Reference JouzelJouzel and others, 1993) has provided information of fundamental importance, since the obtained time series quantitatively characterize the past climate changes at high resolution. One of the principal problems of interpretation of these data is the determination of the ice-core chronostrat-igraphy. Traditionally, the age of ice is computed on the basis of the ice-flow modeling (Reference LoriusLorius and others, 1985; Reference RitzRitz, 1992), although this approach lacks the necessary information about the upstream surface conditions: accumulation rate, ice thickness, temperature gradient, etc. On the other hand, the paleotemperature reconstruction inferred from the deep borehole temperature measurements immediately refers climatic events to a certain place on the time-scale. As has been emphasized above, the age of the peaks in such a computed temperature-time curve depends only slightly on the model parameters. In this section, we consider these peaks as fixed points with known age (similar to stratigraphic markers) for correcting the isotope temperature- record preliminary time-scale.
First, we applied a mean square spline approximation to the original isotope temperature record from Reference JouzelJouzel and others (1987) which is shown in Figure 2a by dots. The smoothing aimed to conserve in the experimental record only the main temperature oscillations also reflected in the computed curve (see thick line in Figure 2b), thus all major climatic events (temperature maxima and minima) could be easily identified in both of them. Our smoothed curve is shown in figure 2a together with a more detailed one obtained by Reference JouzelJouzel and others (1987) by spline smoothing of the 100 year equally spaced isotope values: thick and thin lines, respectively.
Secondly, we forced (stretched linearly between adjacent peaks and troughs) the smoothed isotope record versus depth to correlate with the temperature-time curve deduced from the borehole-temperature profile. The normalized surface-temperature oscillations (refer to variant I in Figure 1a) and the smoothed isotope-temperature record are plotted against time in Figure 2b by thick and thin lines, respectively. The correlation coefficient r between the two curves is 0.72, although amplitudes of some of their oscillations are significantly different. A similar value r = 0.70 is obtained for the best-fit curve II and r = 0.54 for solution III. It is relevant to emphasize here in the discussion that we did not expect better coincidence in amplitude size, because the in-formation about surface-temperature variations in the distant past (more than 70 100 kyear ago) had already been lost in the temperature profile in the Antarctic ice sheet. Thus, the Milankovich astronomic metronome is tuned in accordance with the comparatively recent climate history.
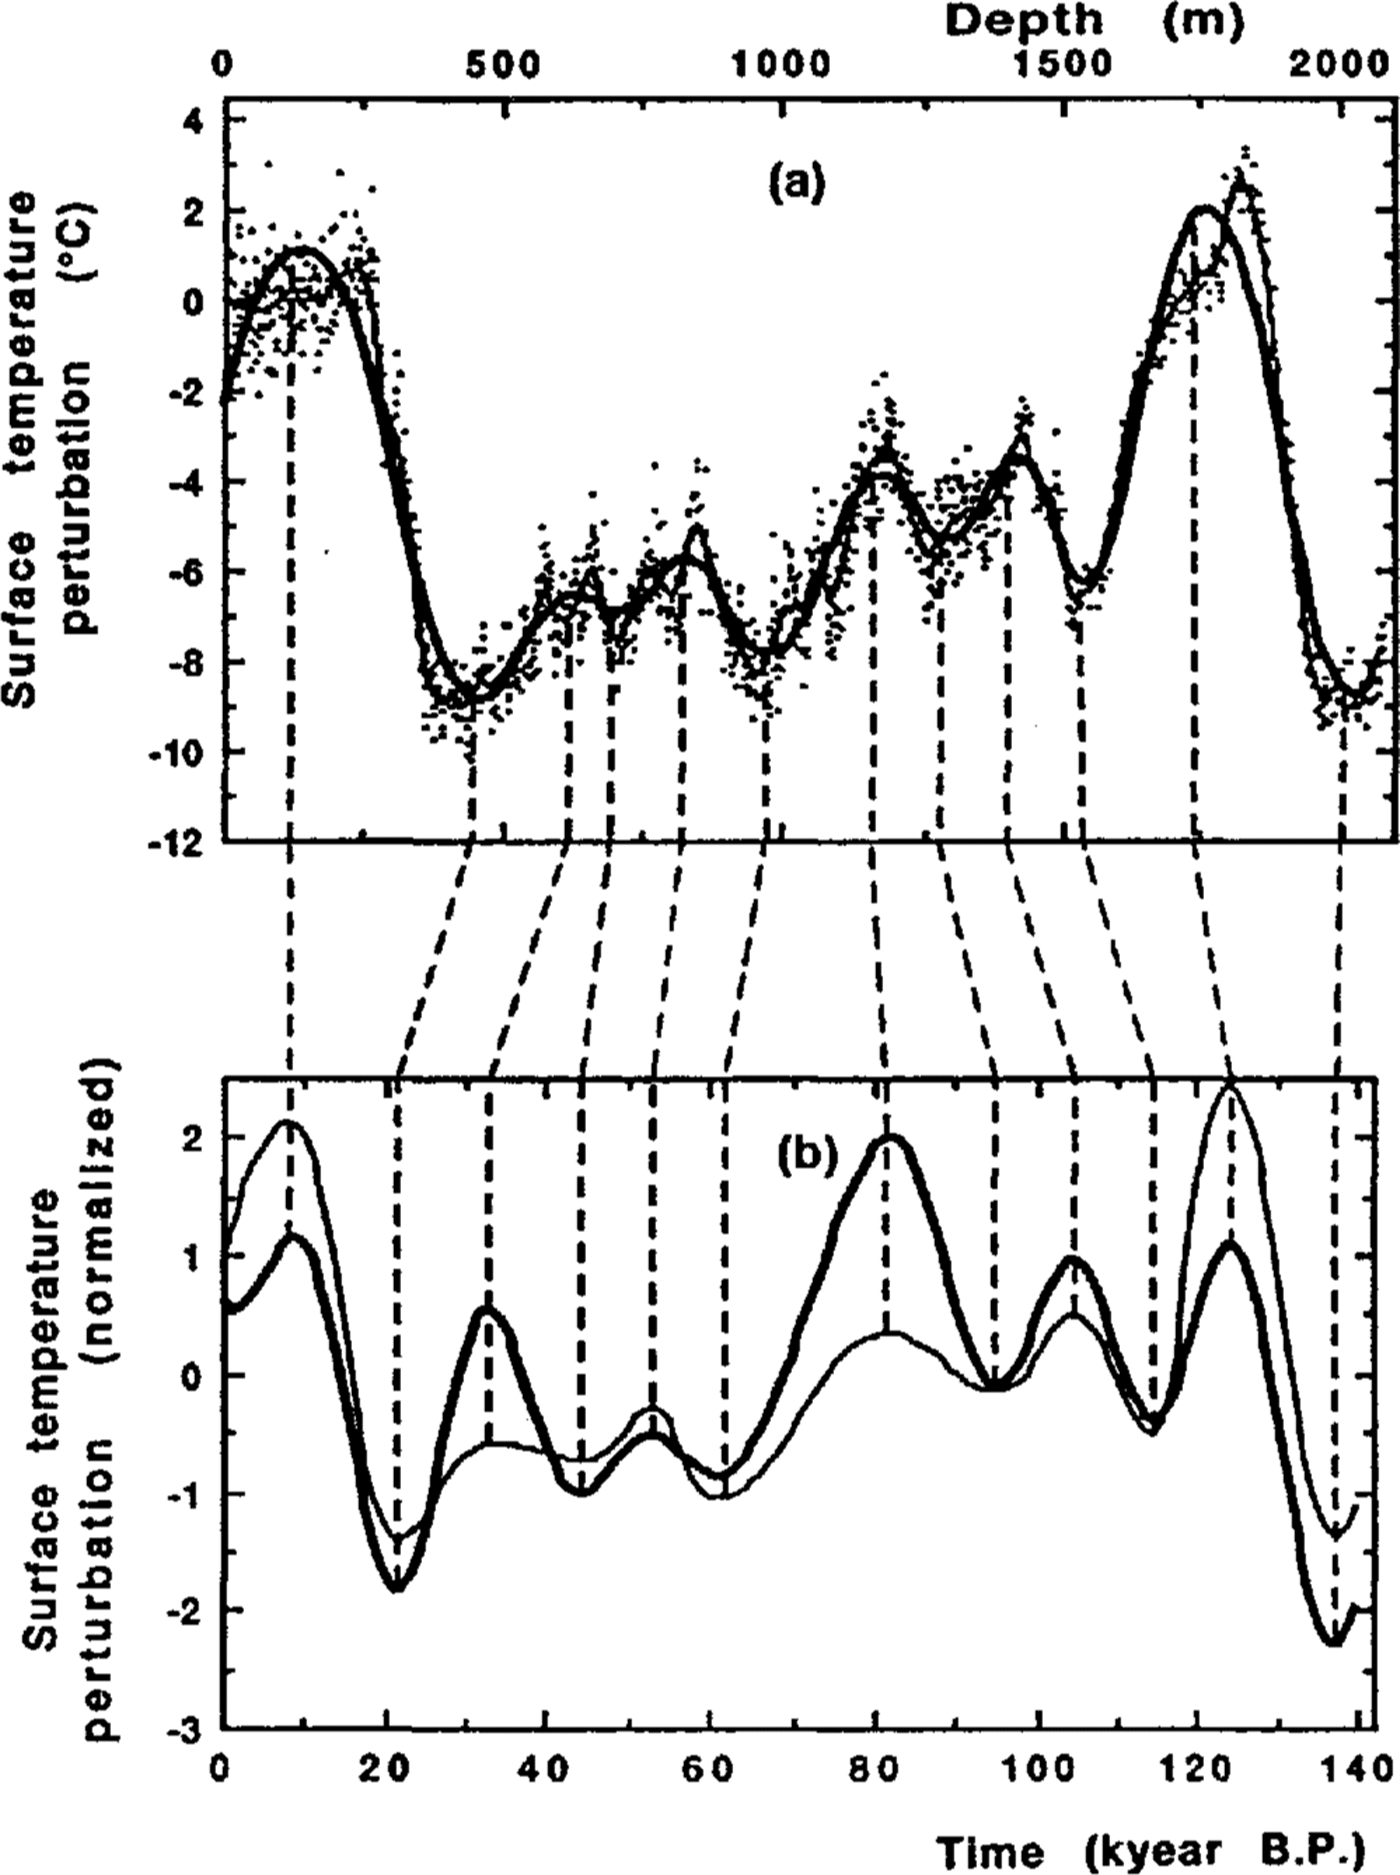
Fig. 2. The dating of the Vostok climate record on the basis of its fitting to the temperature- time curve derived from the analysis of the borehole-temperature profile. a. Isotope-temperature variations against depth in the Vostok ice core. The dots correspond to individual values; the thin line is a smoothed curve (from Reference JouzelJouzel and others, 1987). The thick (bold) line is a cubic-spline approximation of the isotope data adjusted to facilitate the comparison between the experimental and computed paleotemperature curves. The dashed vertical lines connect the identical peaks and troughs in the experimental and computed curves. b. Vostok normalized surface temperature-time curves. The thin line corresponds to the spline approximation of the Vostok isotope record which was correlated to the computed paleotemperature curve shown by the thick line (refers to variant I in Figure 1a)
Obviously, the corresponding time-scales deduced for Vostok through the identified peak events are the compounds of straight lines. It should be emphasized here that irrespective of the degree of correlation between the inferred temperature time variations and the isotope-temperature record, all the chronologies co-incide with each other within a range of 2-3 kyear.
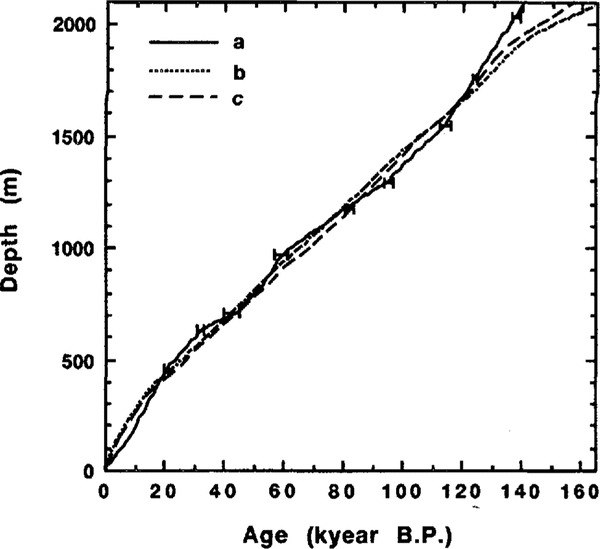
The resulting Vostok climate record time-scale derived from the best-fit paleoreconstruction 1 is presented in Figure 3a. The peak age discrepancies in the different computational experiments are shown by error bars. The two other Vostok ice-core chronologies based on the ice-flow modeling: (b) “old dating” (Reference LoriusLorius and others, 1985) and (c) “extended glaciological time-scale” (EGT) from Reference JouzelJouzel and others (1993) are also shown in Figure 3.
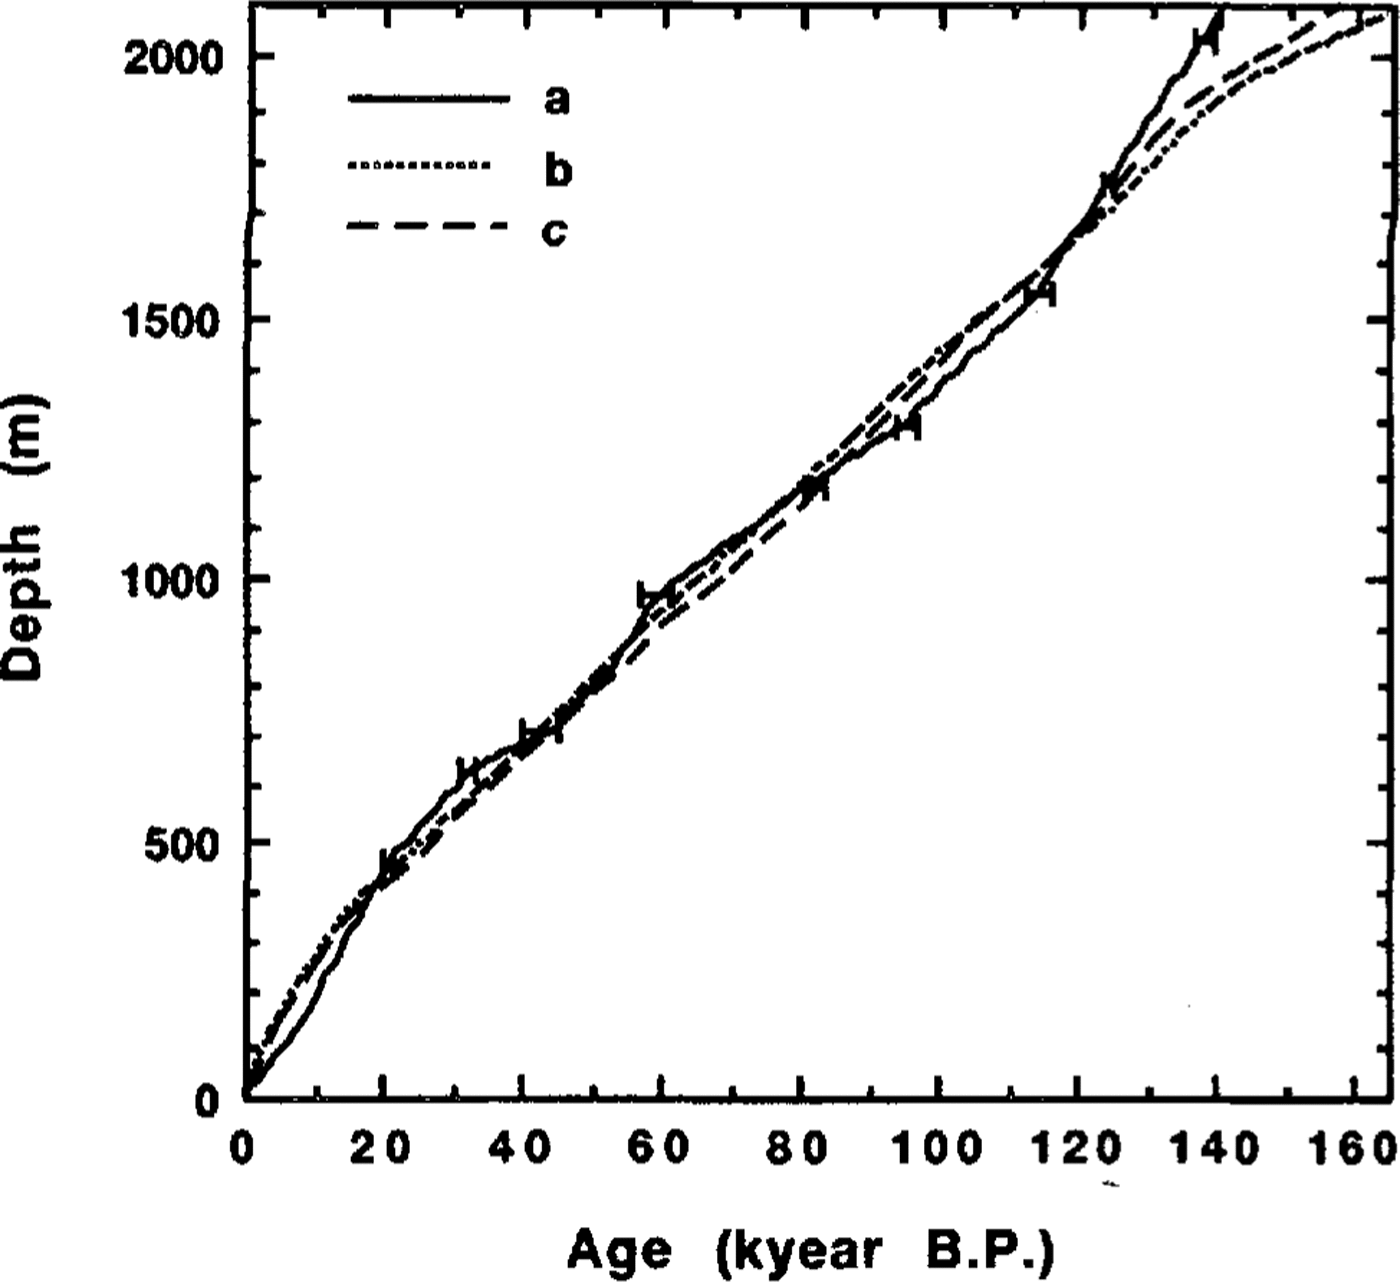
Fig. 3. Comparison of three Vostok ice-cure chronologies: a. Time-scale deduced from the analysis if the borehole-temperature profile (the error bars show the age ranges in different computational variants); b. Depth-age relationship derived by Reference LoriusLorius and others (1985) on the basis of ice-flow modeling; c. Vostok ice core "extended glaciological time-scale" from Reference JouzelJouzel and others (1993).
Apart from the quality of the assumptions taken as a basis for our dating and uncertainties linked with model parameters (2 3 kyear), there is another source of error associated with success of positioning in the isotope-temperature record the temperature maxima and minima accepted as fixed points in the spline-smoothing procedure. To estimate the limits of this error, we examine the discrepancy between different time-scales in the upper part of the Vostok ice core, where the Holocene mid-peak positioning in the isotope record is quite uncertain and the datings derived from ice-flow modeling are most reliable. The difference between our time-scale and EGT for this part of the ice core does not exceed 3.5 kyear and can be considered hereafter as a limit of the peak positioning error. The deviation of the depth--age relationship developed in this work from the EGT curve remains within the range of ± 5 kyear (i.e. within the general accuracy limit of dating) for most parts of the Vostok ice core (see Fig. 3). For example, our approach gives an age of 113.9 kyear for a depth of 1534m instead of 110 ± 3 kyear which was accepted by most investigators (Reference JouzelJouzel and others, 1993) and was used as a tuning point for the EGT chronology. The noticeable discrepancy can be observed for the large depths only, where the accumulation rate upstream of Vostok is determinant. This disagreement can be eliminated if one assumes an increase in the current precipitation rate in the ice-divide direction (Reference RitzRitz, 1992). The latter seems to be realistic and has been partially confirmed by the information extracted from the 10Be data obtained for the Vostok ice core (Reference JouzelJouzel and others, 1993). A preliminary comparison of the reconstructed metronomic paleotemperature signal (see Fig. 1a) with the extended isotope temperature record from Vostok down to a depth of 2546 m (Reference JouzelJouzel and others, 1993) also shows a good agreement between the two chronologies. According to our dating, the 2500 m depth ice is about 11 kyear younger than what is predicted by the EGT.
The new dating of the ice core puts the Vostok temperature record (see Fig. 2b, thin line) practically in phase (with an accuracy ±2 kyear) with the global ice-volume changes represented by the marine δl8O SPECMAP (Reference Martinson, Pisias, Hays, Imbri, Moore and ShackletonMartinson and others, 1987). Reference Petit, Mounier, Jouzel, Korotkevich, Kotlyakov and LoriusPetit and others (1990) reached the same conclusion, using atmospheric dust as a stratigraphic marker to compare Vostok timing with other paleoclimate records.
Conclusion
The inverse procedure has been developed to reconstruct paleotemperature oscillations on the Antarctic ice-sheet surface from the temperature profile measured in the deep borehole at Vostok Station. The timing of the main events of the inferred climate changes appears to be insensitive to the possible variations of the model parameters within the range of their uncertainty. Thus, the correlation between the reconstructed temperature-time curve and the smoothed temperature record derived from the ice-core isotope analysis yields the age-depth relationship for Vostok paleorecords. Although our approach cannot present the detailed picture of paleotemperature variations, it provides another way of dating climate records, Actually, the results suggest that the Milankovich cycles have acted as a strong linear driver tor the surface temperature at Vostok for a much longer time period than the time period over which we can detect their presence by borehole-temperature measurements. The dating technique developed here can be used in the future in combination with other methods (glaciological modeling, stratigraphic correlations, etc.) to ascertain the chronology of the deeper ice core.
Acknowledgments
The authors thank Yu. Rydvan for providing the field data and appreciate very much the useful and stimulating discussions with C. Ritz, P. Duval, T. Hondoh, J. R. Petit, N.I. Barkov, J. Jouzel, C. Lorius, D. Raynaud and E. Waddington. We should also like to express our special gratitude to the reviewers of this paper for their deep understanding and extremely helpful comments which were readily taken into account during the preparation of the final version of our manuscript. This work was supported by the Russian Ministries of Science and of Higher Education.