


Cognitive development, a continuous process whereby different interlinked developmental domains mature over the course of life, usually occurs as a result of genetic (nature) and environmental (nurture) influence where the nature–nurture interaction matters most( Reference Tucker-Drob, Briley and Harden 1 ). Hence, developmental achievement during early childhood is known to be sensitive to prenatal and postnatal environmental conditions, with long-term implications for academic performance and later productivity in adulthood( Reference Walker, Wachs and Grantham-McGregor 2 ). In a number of observational studies, early nutrition and growth have been found to be important early exposures for later health and developmental outcomes( Reference Eriksen, Kesmodel and Underbjerg 3 – Reference Barker 5 ).
Crude growth in terms of weight and length/height, however, does not unfold how body composition (BC) might mediate associations between nutrition and later development. In most studies, growth and nutritional status during early life are measured using simple anthropometric indices (e.g. weight and length/height), which do not allow interpretation of differential effects of fat mass (FM) and fat-free mass (FFM) on child cognitive development. FM and FFM could have different and specific functions important for survival, growth and maturation( Reference Tam and Ravussin 6 ). The growth and development of fetal organs, including the brain, begins soon after conception( Reference Levitt 7 – Reference Vasung, Lepage and Radoš 9 ) when there is only FFM tissue, as accumulation of FM occurs mainly during the third trimester( Reference Ziegler, O’Donnell and Nelson 10 ). Fat accumulated during the fetal and postnatal period contributes to survival of the offspring after interrupted maternal supply of resources at birth and weaning( Reference Kuzawa 11 ). Furthermore, FM is hypothesised to support rapid brain growth and myelination during the period of nutritional disruptions( Reference Kuzawa 11 ). On the other hand, there is an established evidence base that FM during early infancy increases the risk of various non-communicable diseases such as cardio-metabolic diseases, hypertension and obesity( Reference Drozdz, Kwinta and Korohoda 12 , Reference Wells and Fewtrell 13 ). However, we are not aware of any study that has attempted to investigate the relationship between FM or FFM and cognitive development. In the Infant Anthropometry and Body Composition cohort from Ethiopia, FFM at birth was positively associated with growth and developmental achievement at 2 years of age independent of length, socio-economic status and other potential confounders, whereas FM at birth showed no such association( Reference Admassu, Wells and Girma 14 , Reference Abera, Tesfaye and Girma 15 ). However, BC changes during early infancy might also predict cognitive development in early childhood. Therefore, this study aimed to examine the relationship between FM or FFM at birth and accretion during early infancy, and developmental progression from 1 to 5 years of age among Ethiopian children. We hypothesised that FM and FFM at birth and during early infancy may relate differently with developmental progression during early childhood.
Methods
A birth cohort of 644 mother–newborn pairs was established over a 3-year period beginning in December 2008 and examined at a central research unit situated in Jimma University Specialized Hospital (JUSH), Jimma, in the southwest of Ethiopia. According to the 2012 central statistical agency report, Jimma town has an estimated number of 38 874 women in the reproductive age group (15–44 years) with a female unemployment rate of 24·5 %. Although the area has been known for its surplus crop production and export for over many years, there is a recent phenomenon of high food insecurity since 2008 owing to multifaceted reasons( Reference Hadley, Lindstrom and Tessema 16 – Reference Endalew, Muche and Tadesse 18 ). The study sample was restricted to mothers living in Jimma town who gave birth to a term baby with a birth weight of ≥1500 g and no congenital anomalies. To determine the gestational age at birth, the New Ballard Score method was used. Consenting mothers, together with their newborns, were examined at the hospital within 48 hours of delivery and followed up until the children were 5 years of age, with the last assessment conducted in June 2017. The details of this cohort have been published elsewhere( Reference Andersen, Girma and Wells 19 , Reference Andersen, Girma and Wells 20 ).
Ethical clearance
The research ethical review board of the College of Public Health and Medical Sciences, Jimma University, approved the ethical aspects of the study (reference RPO/56/2001). Written informed consent was sought from the mothers. Transport costs were reimbursed for mothers who attended the follow-up assessment. Children who were found to have any illness requiring medical attention were referred to the paediatric clinic of JUSH.
Measurements
At birth
Neonatal weight, FM and FFM were measured to the nearest 0·1 g using PEA POD® (COSMED), an air displacement plethysmograph, as described previously in detail( Reference Andersen, Girma and Wells 19 ). In short, ADP is a non-invasive and comfortable procedure with a whole‐body air‐displacement plethysmograph specifically designed for newborns and infants. It measures the volume of the baby, whereby the density can be calculated, and BC estimated by applying age- and sex-specific densities of FFM. It is a two-component method of BC assessment where the total body weight is divided into two parts: the fat and fat-free components. The fat component includes subcutaneous and essential fat, whereas the fat-free component includes muscle, skeletal tissue, water and minerals.
Length (cm), using a SECA 416 Infantometer (SECA), and head circumference (cm), using a non-stretchable tape, were both measured at birth in duplicate to the nearest 0·1 cm and the average was used. Sex and birth order of the newborn were also recorded.
Information on maternal age and parental education was collected. A family wealth index score was constructed( Reference Abera, Tesfaye and Girma 15 ) from self-report of household assets, quality of drinking water and toilet facility, using principal component analysis and categorised in wealth quintiles( Reference Vyas and Kumaranayake 21 ). The first quintile represents the poorest group, whereas the fifth quintile represents the highest wealth status.
Follow-ups
Weight, FM, FFM and length of the infant were measured at 1·5, 2·5, 3·5, 4·5 and 6 months of age, as described elsewhere( Reference Andersen, Girma and Wells 20 ). The developmental performance of every child was assessed at 1, 1·5, 2, 3, 4 and 5 years of age using the Denver Developmental Screening Test (DDST-II)( Reference Frankenburg, Dodds and Archer 22 ). This test is applicable to children from birth to 6 years of age and has been adapted to, and applied in, a similar setting in Ethiopia( Reference Abessa, Worku and Kibebew 23 , Reference Hadley, Tegegn and Tessema 24 ). It comprises 125 age-relevant test items related to global development (GD), and has four developmental domains: personal social, fine motor/adaptive, gross motor and language. The test items are distributed across the four domains as follows: twenty-five personal social, twenty-nine fine motor, thirty-two gross motor and thirty-nine language.
The administration of the Denver test and scoring of the result were similar for all children in the longitudinal follow-up. The test procedure starts by determining the chronological age of the child and drawing a vertical age line on the Denver assessment chart. Testing starts with items arranged completely to the left of the age line and continues to the left until the child passes three consecutive items. All items to the left of the three consecutively passed items are considered to have been passed, because they are items achieved at a lower age (implied passes). Thereafter, testing will continue along the age line and then to the right of the age line until the child fails three consecutive items in each of the four domains. All items arranged to the right of the three consecutively failed test items are considered to have been failed (implied failures). Items actually tested and passed are considered ‘tested passes’. Each child was assessed in the presence of parents or a primary caregiver, and every possible effort was made to make both the child and caregiver comfortable to elicit the most natural response of the child. Parents were allowed to come and sit together with the child in the examination room to give the child a sense of comfort and security. The test was administered by a nurse. Parents were not allowed to help the child and thereby influence the performance of the child. However, the mothers were allowed to report the child’s performance and interaction with other children when the child was at home. Training of the data collectors on the administration and scoring of the test result was carried out based on DDST-II training guidelines.
All passes (implied and test passes) on the screening test were coded as 1, whereas failures (including implied failures) were coded as 0. For the DDST-II conducted at 1, 1·5, 2, 3, 4 and 5 years of age, the total test score at each time point was computed by summing up the test items performed successfully (test passes) and implied passes. Thus, a total raw developmental score out of 125 items was obtained at 1, 1·5, 2, 3, 4 and 5 years of age. The scores across the time points indicate developmental progression over time. The total scores out of 25 for personal social, 29 for fine motor, 32 for gross motor and 39 for language domain were also computed.
Statistical analysis
Data were double-entered in Epidata version 3.1 and exported to STATA 12 (StataCorp) for cleaning and analysis. Baseline characteristics for children who were followed up were summarised in terms of frequencies and percentages for categorical variables and as mean values and standard deviations for continuous variables. Next, a comparison test for those who were followed up v. those who were not followed up was made.
The estimated best linear unbiased predictions of the slopes for age in months provided a predicted value (non-standardised estimate) for FM and FFM accretion rates in absolute value (g/month) for all children at all time points between birth and 6 months of age. These absolute predicted values were used to calculate the rate of BC growth as a difference of predicted value between two time points divided by age of the infant in months. Thus, the absolute (unstandardised) rate of growth between birth and 6 months was computed as predicted value at 6 months minus predicted value at birth for FFM. Similarly, the absolute rate of growth between birth and 4 months was computed as predicted values at 4 months minus predicted value at birth, and rate of growth between 4 and 6 months was computed as predicted value at 6 months minus predicted value at 4 months for FM. These absolute rates of growth between two time points are expressed in g/months. Then, to identify correlates of these rates of absolute growth for FM or FFM between two time points, we conducted two-sample t-tests and one-way ANOVA test using different correlates such as sex, birth order, maternal schooling, paternal schooling and family household wealth index.
For the final analysis, the main exposure variables were FM or FFM at birth, and standardised rates of FM or FFM accretion during early infancy. As BC was measured repeatedly from birth to 6 months of age, it was desirable to generate a single summary measure of BC for every child that could rank them according to their FM and FFM accretion rate during early infancy. Using all available BC measurements between birth and 6 months, we generated standardised rates of FM and FFM during early infancy for males and females separately using linear-mixed models with a restricted maximum likelihood estimation. The linear mixed model included age in months as a linear fixed-effect term and child-specific random intercepts and slopes for age in months. To improve the prediction for the rate of FM and FFM accretion, the model was further adjusted for birth order, head circumference and parental schooling, all as fixed-effect terms. This standardised rate of BC growth was generated for all children who have more than one measurement of BC during early infancy. To standardise or normalise the predicted summary of BC growth rate during early infancy, the generated rate was centred around zero by divided the rate to its (sd) to allow for comparison of estimates of FM and FFM. These standardised rates of BC growth were used as main exposure in the final regression models.
The absolute (unstandardised) rate of BC growth is not the same with the standardised rate of BC growth between birth and 6 months or between birth and 4 months or 4–6 months. Because the standardised rates of BC growth were generated using at least two available BC data at any follow-up period (from birth to 6 months for FFM, and from birth to 4 months or from 4 to 6 months for FM), unlike unstandardised (absolute) rates, which were generated using only two BC measurements at birth and 4 months for FM, or birth and 6 months for FFM.
To identify the pattern of FM and FFM tissue accretion during early infancy, the lambda-mu-sigma method was used to derive centile charts from birth to 6 months( Reference Andersen, Girma and Wells 20 ). Consequently, a linear tissue accretion pattern from 0 to 6 months was identified for FFM tissue, whereas a linear accretion pattern for FM was identified from 0 to 4 months and 4 to 6 months of age( Reference Andersen, Girma and Wells 20 ). Owing to the linear accretion pattern for FFM from 0 to 6 months of age, it was possible to generate a standardised rate for FFM accretion from 0 to 6 months. In contrast, FM showed a nonlinear (quadratic) pattern from 0 to 6 months( Reference Andersen, Girma and Wells 20 ), and thus a standardised rate of FM accretion was generated from 0 to 4 and 4 to 6 months, both of which followed a linear accretion pattern, with very little FM accretion from 4 to 6 months. These standardised rates of FM and FFM accretion were generated for all children who had at least two BC measurements.
The relationship between early life FM or FFM tissue accretion and child developmental progression (DDST-II) from 1 to 5 years of age was examined by linear mixed-effects models fitted separately for FM and FFM using maximum likelihood estimation. Separate models were considered for FM and FFM at birth and for postnatal FM and FFM tissue accretion. The interaction between FM or FFM tissue and time point categorised in terms of visits was included as a fixed-effects term in all models in order to describe developmental progression over time. Three models with different fixed-effect adjustments were considered, as detailed below. All models included child-specific random effects to account for repeated measurements per child. Assumptions and model adequacy were checked before the final analysis.
Linear mixed models with FM or FFM at birth as main exposure and DDST-II raw score for GD as the dependent variable were modelled as follows: Model 1 contained FM or FFM at birth, time point and FM or FFM at birth×time point; model 2 built on model 1, further adjusted for length at birth, sex, head circumference at birth and birth order; and model 3 built on model 2 further adjusted for parental schooling and family wealth index. Thereafter, using standardised rate of FM or FFM accretion as a main exposure, and DDST-II raw score as the dependent variable, the regression models were developed as follows: Model 1 contained the standardised rate of FM or FFM accretion, time point and standardised rate of FM or FFM growth×time point, FM or FFM at birth, length at birth, sex, head circumference at birth and birth order; model 2 built on model 1 further adjusted for rate of length growth; and model 3 built on model 2 further adjusted for parental schooling and family wealth index. In model 1, standardised rate of FM growth was adjusted for FM at birth. Similarly, standardised rate of FFM growth was adjusted for FFM at birth. The above models were repeated with the developmental sub-scales as dependent variables instead of GD score. Covariates for adjustment were selected based on the existence of a plausible biological relationship and known pre-existing relationship with the outcome variable.
We carried out available case analyses such that all children with measurements at 1 or more time points for the outcome variable contributed to the analysis. In practice, this meant that we fitted linear mixed models, making the assumption that missing measurements, if they had been recorded, would have followed the same trends as the measurements that we actually recorded. In other words, we could, in principle, predict the missing values except for their uncertainty; this assumption is often referred to as ‘missing at random’ in the statistics. This would typically be the case if children missed visits or dropped out owing to reasons that did not have anything to do with the exposure.
The mixed-effects model generates change in association as a difference of β-coefficient (estimate) between two time points. The accumulated estimate for the change in association from 1 to 5 years of age was obtained by summing up all the differences in β-coefficients computed for the change between 1 and 1·5, 1·5–2, 2–3, 3–4 and 4 to 5 years or by subtracting the estimate at 5 years (end point) from the estimate at 1 year (starting point).
Results
Background characteristics
From the total of 644 participants enrolled in the study, 631 children had at least one (at birth) BC measurement and 535 children had two or more BC measurements from 0 to 6 months of age. Of these 631 and 535 children, 481 and 461 had at least one developmental assessment from 1 to 5 years of age, respectively. In the initial developmental test at 1 year of age, 176 children underwent developmental test, whereas 379 children were tested at the last follow-up assessment (5 years of age). Approximately 455 of those who have BC at birth and 416 of those who have standardised rate of BC growth were found to have complete data for all covariates and were included in the analysis (Fig. 1). The statistical assumptions required for longitudinal data analysis were tested and met. There was no significant difference for most of the background characteristics; however, FFM at birth and birth order of children who were not followed up were significantly different from those who were included in the analyses (online Supplementary File S1).
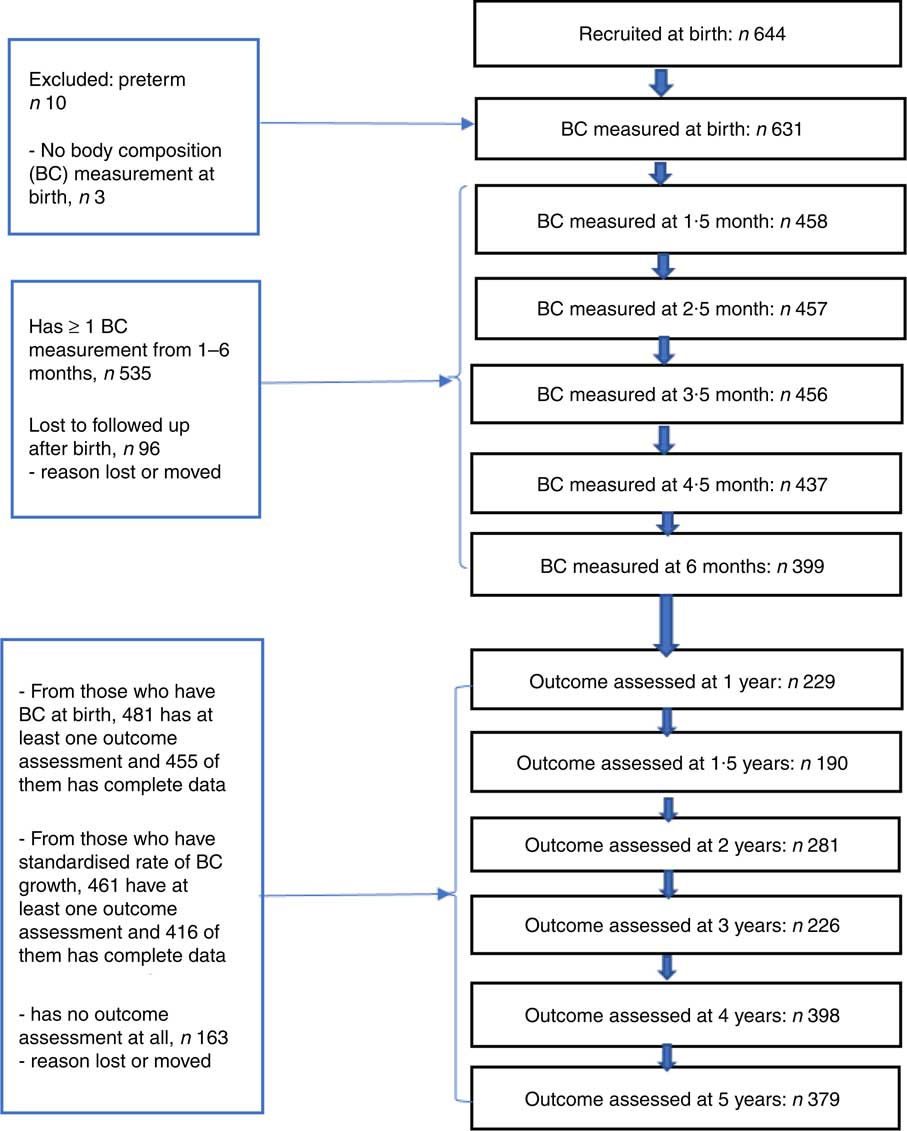
Fig. 1 Number of subjects followed up at different time points. BC, body composition.
Age of the children was 12·4 (sd 0·6) and 59·9 (sd 1·5) months at the 1- and 5-year assessment, respectively. FFM at birth was 2·8 (sd 0·3) kg and FM was 0·2 (sd 0·2) kg. GD scores at 1 and 5 years of age were 57·8 (sd 3·4) and 112 (sd 2·0), respectively (Table 1 and Fig. 2). At delivery of the index child, maternal age was 24·1 (sd 4·6) years. About 450 (93·9 %) mothers and 451 (97·2 %) fathers had at least some formal schooling (Table 1).
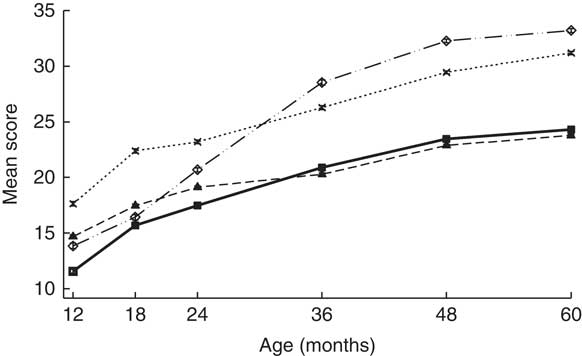
Fig. 2 Denver development domain scores from 1 to 5 years of age. Values are means and 95 % confidence intervals. ![]() , Language;
, Language; ![]() , fine motor;
, fine motor; ![]() , gross motor;
, gross motor; ![]() , personal/social.
, personal/social.
Table 1 Child and parental characteristics at birth among Ethiopian children who have outcome assessment at least once from 1 to 5 years of age (n 481)(Numbers and percentages; mean values and standard deviations)
Correlates of fat mass and fat-free mass growth rates
For the absolute (non-standardised) rate of BC growth, male and female children showed 449 (sd 61) and 409 (sd 49) g/month increase in FFM tissue between birth and 6 months of age. Similarly, male and female children showed 389 (sd 117) and 383 (sd 105) g/month increment in FM tissue between birth and 4 months of age. Sex and birth order of the index child and parental schooling were all associated with absolute rate of FFM tissue from 0 to 6 months of age, whereas only birth order was associated with absolute rate of FM tissue from 4 to 6 months of age (Table 2).
Table 2 Description of non-standardised fat and fat-free mass accretion rates in early infancy and their correlates(Mean values and standard deviations)
* t Test.
† ANOVA.
Body composition as a predictor of developmental progression
FFM independent of length at birth was positively associated with GD progression from 1 to 5 years of age (β=1·8; 95 % CI 0·1, 3·4) and from 4 to 5 years of age (β=1·3; 95 % CI 0·2, 2·4) adjusted for potential confounders such as neonatal and parental characteristics (Table 3). This was mainly owing to the association found between FFM at birth and language developmental progression from 1 to 5 (β=0·6; 95 % CI 0·1, 1·1), particularly from 4 to 5 years of age (β=0·7; 95 % CI 0·2, 1·2). Furthermore, FFM at birth was positively associated with fine motor developmental progression from 4 to 5 years of age (β=0·40; 95 % CI 0·05, 0·8). Although not significant, FFM at birth showed a negative relation with GD progression from 1·5 to 2 and 2 to 3 years of age, which means that FFM at birth has a higher effect at older age: at 2 years compared with 1·5 years and at 3 years compared with the effect at 2 years of age. Next, the estimate changed to positive direction between 3–4 and 4 to 5 years of age in that the effect was higher at a younger age: at 3 years compared with 4 years and at 4 compared with 5 years of age. The standardised rate of postnatal FFM tissue accretion was positively associated with GD score at 1 year of age (β=0·5; 95 % CI 0·01, 0·99) when adjusted for sex, birth order, length and head circumference but disappeared when adjusted for rate of length growth (Table 4). Rate of postnatal FFM tissue accretion, however, showed no association with developmental progression from 1 to 5 years.
Table 3 Fat mass (FM) and fat-free mass (FFM) at birth as a correlate of developmental score from 1 to 5 years of age in Ethiopian children (n 455)†(β-Coefficients and 95% confidence intervals)
* P<0·05, ** P<0·01, *** P<0·001.
† FM and FFM are modelled in separate regression analyses.
‡ FFM or FM at birth, visit (FFM or FM at birth×visit).
§ Model 1 further adjusted for length at birth, sex, head circumference at birth and birth order.
|| Model 2 further adjusted for parental schooling and wealth index.
Table 4 Standardised rate of fat-free mass (FFM) accretion during early infancy (0–6 months) as a correlate of developmental score from 1 to 5 years of age in Ethiopian children (n 416)(β-Coefficients and 95% confidence intervals)
* P<0·05.
† Standardised rate of FFM growth from 0 to 6 months, visit (standardised rate of FFM growth×visit), FFM at birth, length at birth, sex, head circumference at birth and birth order.
‡ Model 1 further adjusted for rate of length growth from 0 to 6 months.
§ Model 2 further adjusted for parental schooling and wealth index.
Although FM at birth was positively associated with GD score at 1 (β=3·6; 95 % CI 0·6, 6·6) and 5 years of age (β=2·7; 95 % CI 1·3, 4·2) in the unadjusted models, the association disappeared when it was adjusted either for length or head circumference at birth (Table 3). However, FM at birth showed a positive association with gross motor development at 5 years (β=0·8; 95 % CI 0·4, 1·5) in the fully adjusted model (Table 5). However, postnatal FM tissue accretion rate during early infancy showed no association with developmental progression from 1 to 5 years of age (Table 6).
Table 5 Relationship between fat mass (FM) or fat-free mass (FFM) during early infancy and developmental domains from 1 to 5 years of age in a fully adjusted model(β-Coefficients and 95% confidence intervals)
* P<0·05, ** P<0·01.
† Rate of FM or FFM accretion is included in the model separately. n 455 for FM and FFM at birth; n 391 for standardised rate of FM 4–6 months.
Table 6 Standardised rate of fat mass (FM) accretion (from 0 to 4 months (n 416) and 4 to 6 months (n 391)) as a correlate of developmental score from 1 to 5 years of age*(β-Coefficients and 95% confidence intervals)
* Standardised rate of FM 0–4 and 4–6 months growth was modelled in a separate regression analysis.
† Standardised rate of FM growth from 0 to 4 months or 4–6 months, visit (standardised rate of FM growth×visit), FM at birth, length at birth, sex, head circumference at birth and birth order.
‡ Model 1 further adjusted for rate of length growth from 0 to 4 months or from 4 to 6 months.
§ Model 2 further adjusted for parental schooling, wealth index.
The role of covariates
Length and head circumference at birth were confounders for the association observed between FM and GD progression at 1 and 5 years of age. When FFM at birth was modelled as the main exposure variable, female sex, increasing maternal education and higher level of family wealth index (4th and 5th wealth quantiles) were all positively associated with developmental progression from 1 to 5 years of age in the fully adjusted model. In addition to the above associated covariates, length at birth was associated with developmental progression from 1 to 5 years of age when FM at birth was modelled as the main exposure variable. All these significantly associated covariates except parental wealth index also replicated when the rate of postnatal FM and FFM growth was included as the main exposure (data not shown).
Discussion
In this study, the relation between early life tissue accretion and developmental progression from 1 to 5 years of age was examined. To our knowledge, we are the first to report the longitudinal relationship between early life tissue accretion, disaggregated into FM and FFM, and developmental progression during childhood. We found that FFM at birth was positively associated with global and language developmental progression from 1 to 5 years of age independent of neonatal and parental characteristics. Furthermore, standardised rate of postnatal FFM tissue accretion was associated with developmental score at 1 year of age adjusted for neonatal characteristics. However, either fetal or postnatal FM tissue accretion showed no such association with GD progression. We adjusted for different neonatal and parental characteristics, and measured the exposure and outcome variables at different time points and implemented a longitudinal data analysis with robust statistical approach using all available data.
FFM at birth showed a positive association with global and language developmental progression. This association was observed from 1 to 5 and 4 to 5 years of age. GD progression from 1 to 5 years of age increased by 1·8 points for each kg increase in FFM tissue at birth. Although not significant, the GD score at 1 year increased by 1·6 points for each kg increase in FFM tissue at birth, whereas it resulted in 0·2 points reduction at 5 years of age. Therefore, it appears that FFM at birth has a stronger estimate at the 1-year developmental achievement compared with the 5-year achievement. We have previously reported that FFM rather than FM at birth was positively associated with developmental score at 2 years of age( Reference Abera, Tesfaye and Girma 15 ). The observation that fetal FFM accretion is associated with subsequent childhood developmental progression may explain the relation between birth weight and developmental achievement.
Postnatal cognitive development is the result of a properly grown and differentiated fetal brain. In this regard, most of the intra-uterine brain growth and development begins soon after conception and continues throughout pregnancy( Reference Levitt 7 – Reference Vasung, Lepage and Radoš 9 ) when there is a simultaneous linear accretion of FFM tissue( Reference Ziegler, O’Donnell and Nelson 10 ). The basic building units of the brain and nervous system including neurotransmitters and enzymes are amino acids( Reference Chi, Zhang and Tokunaga 25 – Reference Boulanger 27 ). Furthermore, at full term, the fetal brain contains about 85 % water( Reference Rutherford 28 ). Thus, the brain mainly consists of FFM. In this case, fetal FFM tissue accretion might partly be a marker of brain growth during infancy. Subsequently, such a well-funded and grown brain helps children attain a better developmental status. Other studies have also reported fetal growth during early and mid-gestation as a predictor for childhood cognitive developmental outcome( Reference Harvey, Prince and Bunton 29 , Reference Walker, Thame and Chang 30 ).
In addition to FFM tissue at birth, postnatal FFM tissue accretion showed a significant positive association with developmental score at 1 year of age adjusted for sex, length, FFM and head circumference at birth, and birth order of the index child. However, this association disappeared during adjustment for the rate of postnatal growth in length. No association was detected between rate of FFM tissue accretion and developmental progression between 1 and 5 years of age. During the postnatal period, environmental factors (nurture) including psychomotor stimulation and children’s self-experience might be more important and mitigate the relation between postnatal tissue accretion and developmental achievement. However, postnatal FFM tissue accretion could start to show the association with developmental performance later in childhood or adolescence.
FM tissue accretion at birth was not associated with the GD progression from 1 to 5 years of age. The human brain starts to grow and develop from conception, whereas fetal FM accretion mainly occurs during the last trimester( Reference Ziegler, O’Donnell and Nelson 10 ). Owing to this, FM may have contributed very minimal for brain development during the first and second trimesters. FM at birth may secure uninterrupted resource supply from the mother to the new born right after birth( Reference Kuzawa 11 ) rather than supporting developmental performance later in life. The contribution of FM tissue to the total body weight at birth was nearly 7 % in this study. This low contribution of FM tissue to birth weight compared with the reference children (13 %)( Reference Ziegler, O’Donnell and Nelson 10 , Reference Butte, Hopkinson and Wong 31 ) could explain the lack of association with childhood developmental progression. In contrast, FM at birth showed a higher degree of variability than FFM tissue accretion at birth, which could favour FM tissue to be identified as a predictor for development compared with FFM tissue. Therefore, this might simply mean that as the proportion of FM compared with FFM in the total body weight is naturally low including in the reference population, this tissue may only be required by the body to a certain limit to function as an alternative source of energy during emergency time( Reference Kuzawa 11 ) and support the physical growth than the developmental achievement. Furthermore, previous studies reported a negative association between a proxy measure of fat tissue (overweight, obesity and adiposity) and developmental performance among children and across the life span( Reference Gentier, D’Hondt and Shultz 32 – Reference Wang, Chan and Ren 36 ). In this regard, we have used a standard instrument to measure FM and FFM tissue and find no association between FM and developmental scores.
Standardised rate of FM accretion during early infancy showed no association with GD progression from 1 to 5 years of age. Similar to the reference children( Reference Butte, Hopkinson and Wong 31 ), the growth pattern of postnatal FM tissue accretion in this study followed a nonlinear pattern( Reference Andersen, Girma and Wells 20 ) with rapid accumulation between 0 and 4 months of age and after which it levels off between 4 and 6 months of age. A maximum (28 %) accumulation of FM tissue accretion was observed at 4·5 months. In most of the follow-up measurements, the contribution of FM was not >25 % of attained growth in weight, and this is only slightly lower than the reference children from USA who were a mixed feeding group( Reference Butte, Hopkinson and Wong 31 ). Such a quadratic nature of postnatal FM tissue accretion may primarily help substitute interrupted supply of resources from the mother to the child during weaning( Reference Kuzawa 11 ). Through this mechanism, fat during infancy may serve as an energy reservoir to prevent sudden occurrence of energy deprivation supporting the immune system and buffer the risk of malnutrition( Reference Bartz, Mody and Hornik 37 ) and funding subsequent linear growth, which is shown in our study( Reference Admassu, Wells and Girma 14 ), but we did not show that it predicts cognitive development. The myelination of higher cognitive functions that involve the accumulation of fat tissue around the nervous system continues until adolescence( Reference Toga, Thompson and Sowell 38 ). The function of FM tissue, although not limited to myelination, might become prominent during such a period. This will further motivate future studies to examine whether FM during fetal life affects postnatal development later in life.
Other known predictors of cognitive development are also replicated in this study. Female sex( Reference Celikkiran, Bozkurt and Coskun 39 , Reference Bouchard, Trudeau and Sutton 40 ), higher length at birth( Reference Ulker 41 ), better maternal schooling( Reference Bartels, van Beijsterveldt and Boomsma 42 ) and higher parental wealth index( Reference von Stumm and Plomin 43 ) all were positively associated with better developmental outcome. As most of these covariates are modifiable factors, they might be of great interest for planners and policymakers to consider relevant intervention strategies aiming to enhance childhood developmental outcome. The lack of similar studies reported elsewhere prevented us from comparing and discussing the current finding related to BC and development with other literatures. Lack of this comparison might be considered as a drawback, whereas the uniqueness of our report contributes a new knowledge to the existing database.
The strength of this study is the use of multiple longitudinal data points both for the exposure and outcome variables. The exposure variables happened before the outcome, which enables establishing a unidirectional relationship between the two and reduces the egg-and-chicken dilemma. The analysis also addressed the global and specific developmental domains, which enabled us to identify the domain most affected by the exposure. To control the effect of sex on tissue accretion, the rates of BC growth for males and females were generated separately. Subsequently, the statistical analyses were not stratified by sex, but the effect of sex was accounted by adjustment.
However, the findings suffer from the following limitations: DDST-II is administered in a research centre, which is a new environment to children and may influence their level of performance. However, the presence of their parents could make the children feel at ease. The screening test has higher sensitivity (83 %) than specificity (43 %). This means that the tool has the ability to detect even a slight problem, which leads to over-referral of normal children( Reference Glascoe, Byrne and Ashford 44 ). Some known predictors of development such as maternal IQ, maternal mental health and home environment were not measured or observed. Intra-uterine growth restriction (IUGR) was not measured directly by means of ultrasound or other imaging techniques during pregnancy that might limit the proper understanding on the effect of IUGR on cognitive development. On the other hand, birth weight, head circumference and length at birth that we have controlled for in the analysis can be considered as a proxy indicator of IUGR. There is evidence of using birth weight as an indicator of IUGR that occurs during the third trimester( Reference Hemachandra and Klebanoff 45 ). Duration of breast-feeding, morbidity and environmental stimulation were also not accounted for. There was a substantial loss to follow-up, although all available data points were included. This may affect the generalisability of the findings. Although there was no significant difference for most of the background characteristics, FFM at birth and birth order of children who were not followed up was significantly different from those who were included in the analyses. However, the longitudinal analysis applied in this study was chosen for efficient use of all available data and assume missing at random to get an unbiased estimate. We refrained from performing sensitivity analyses (e.g. complete case analyses), as these analyses would be based on a much smaller sample size. However, it would have been interesting to impute missing values, but to be of any real value such an imputation approach would require additional assumptions (about the trends in unobserved measurements). As the focus of the study was to test the association between the exposure and outcome variables, children were not classified as developmentally delayed or normal. Furthermore, our sample did not include children with a birth weight <1·5 kg, and thus the finding could have been different if those children had been included in the study.
In summary, despite the above limitations, the findings are a substantial addition to the existing knowledge. Previous studies reported the presence of variation in developmental outcome of children owing to variation in size at birth measured in terms of weight and length( Reference Ulker 41 , Reference Wade, Browne and Madigan 46 ). This knowledge gets a better understanding by depicting the relative importance of FFM over FM tissue accretion at birth for developmental performance during childhood. The fact that fetal, not the postnatal, FFM tissue accretion showed an association with developmental performance might partly be owing to fetal FFM tissue accretion encompassing fetal brain development, both of which are influenced by genetic as well as environmental factors. However, attention has to be paid to interpret and apply this finding to other contexts. The result might simply mean that early FFM tissue accretion at birth correlated with latter childhood cognitive development, and hence FFM tissue accretion during infancy could also show a similar pattern and correlation with developmental outcome later in life during adolescence. Finally, the lack of association between FM and development might call for further research to establish a clear understanding for the relation between the two.
In conclusion, fetal rather than postnatal FFM accretion was associated with child development until 5 years of age. Neither fetal nor postnatal FM accretion was associated with progression of child development. Intervention studies are needed to assess whether nutrition interventions that increase FFM also increase child development.
Acknowledgements
The authors acknowledge Jimma University for facilitating the implementation of the study. The authors also acknowledge the research nurse for their unreserved commitment during such a long course of the research work and the study participants for their time and participation.
The study was funded by Danish Council for Strategic Research-Program Commission on Food and Health; Danida through the Consultative Research Committee for Development Research (104. Dan.8-1207 and 09-097 LIFE).
H. F., T. G., P. K., G. S. A., J. C. W., M. T. and M. A. designed the study; M. A., B. A., T. G., M. T., G. S. A., R. W., P. K. and H. F. conducted the study; M. A., C. R. and B. A. analysed the data and interpreted the findings; M. T., T. G., C. H., R. W., G. S. A., J. C. W., P. K. and H. F. commented on the interpreted findings and contributed to the write-up; and M. A. wrote the first draft of the manuscript and had responsibility for the whole work. All authors reviewed the content, and read and approved the final version.
The authors declare that there are no conflicts of interest.


