


Poor childhood nutritional status in sub-Saharan Africa continues to be a challenge and major risk factor for disability and premature mortality( Reference Fanzo 1 – Reference Lartey 4 ). The UNICEF model and other operational frameworks show the importance of overall child care practices, including interactive behavioural processes between caregivers and children at meal times, to influence child nutrition and health( Reference Larson, Neumark-Sztainer and Hannan 5 , Reference Orrell-Valente, Hill and Brechwald 6 ). The feeding behaviour of caregivers includes decisions about how, why, when and what they feed their children. Central to the recommendations for responsive feeding is ensuring the availability of healthy foods and providing a comfortable feeding environment for the child( Reference Bentley, Wasser and Creed-Kanashiro 7 ). There is ample evidence that more diverse meals are healthier than meals consisting of a single food item or fewer food groups( Reference Black and Aboud 8 ). The consumption of a diverse diet, particularly one that includes animal source foods (ASF)( Reference Mirmiran, Azadbakht and Azizi 9 ), can help meet children’s nutritional requirements( Reference Hsu-Hage and Wahlqvist 10 ) and has been found to be protective against stunting and underweight( Reference Darapheak, Takano and Kizuki 11 – Reference Newmann and Harris 13 ). Although consumption of ASF in general is encouraged, specific foods have a unique contribution to child growth and development and ASF diversity is important( Reference Long, Murphy and Weiss 14 ). The present study, therefore, focused on ASF diversity.
The type, quantity and diversity of food that is chosen for a child may be determined by household and individual characteristics interacting in complex ways to influence the development and maintenance of caregivers’ nutrition knowledge and attitudes. Understanding the dietary choices and caregivers’ reasons for those choices will aid in formulating guidelines to improve child feeding practices( Reference Engle and Pelto 15 ). To date, there is a paucity of information in the literature on caregivers’ nutrition knowledge and attitudes, particularly concerning children’s intake of ASF.
The present study was carried out in Ghana, a West African country that relies mainly on rain-fed agriculture, and thus is vulnerable to food insecurity. Children’s diets consist primarily of cereals, roots and tubers with little or no ASF; the poor quality of the diet contributes to the high prevalence of micronutrient deficiencies( 16 – Reference Adu-Afarwuah, Lartey and Brown 18 ). The 2008 Ghana Demographic and Health Survey estimated that 28 % of children under 5 years of age were stunted with high variation across agro-ecological zones( 19 ). To address this public health concern, the Enhancing Child Nutrition through Animal Source Food Management (ENAM) project developed a context-specific problem model for the causal links to low ASF consumption among young children in rural Ghana. The resulting intervention integrated microcredit with nutrition and entrepreneurial education. The ENAM project methods of assessment, problem model, intervention priorities as well as growth outcomes have been published previously( Reference Colecraft, Marquis and Sakyi-Dawson 20 , Reference Marquis, Colecraft and Sakyi-Dawson 21 ).
To guide the nutrition education intervention, the project collected data on (i) the diets of households and their 2–5-year-old children and (ii) caregivers’ nutrition knowledge and attitudes, especially about ASF, and compared these with standard dietary recommendations and infant and young children feeding recommendations( Reference Brown, Dewey and Allen 22 , Reference Murphy and Allen 23 ). We hypothesised that caregivers’ nutrition knowledge and attitudes independently were associated with household dietary diversity and children’s ASF consumption.
Methods
Study sites and participants
The data used for this analysis were collected as baseline information for the ENAM project between April 2006 and February 2007. The peak rainy season and the driest months correspond to April to July and November to February, respectively. In consultation with staff from the Ghanaian Ministry of Food and Agriculture, three different agro-ecological zones (Guinea Savannah Zone, Forest Transitional Zone and Coastal Savannah Zone) were purposively selected to reflect the diversity of ASF across the country. The survey procedures for this study have been described in detail previously( Reference Colecraft, Marquis and Sakyi-Dawson 20 , Reference Marquis, Colecraft and Sakyi-Dawson 21 ).
An exhaustive list of 608 caregivers with their 2–5-year-old children were identified through community mapping and included all mothers who were willing to participate in the survey and be followed-up for successive data collection for the ENAM study. A caregiver was defined as the person with whom the child lived and who had primary responsibility for child care (including feeding) most of the time. For households with caregivers having more than one child within the eligible age, the youngest child was selected as the index child participant.
Data collection
Research staff were trained to administer the study questionnaire in the language preferred by the participant. The questions were pretested in neighbouring communities and revised as needed. Data were collected through in-person interviews with the caregivers in their homes. Field supervisors randomly duplicated questionnaires to cross-check answers recorded by field staff. Screening questions were incorporated into the questionnaire to identify ineligible respondents and to check the respondent’s credibility.
Household characteristics
Caregivers reported on socio-economic and demographic characteristics, including household composition and the participant’s education and occupation. A sex-balanced key informant group was set up in each community to assign a wealth rank to the selected study households( Reference Colecraft, Marquis and Aryeetey 24 ). Key informants defined for their own community criteria for a household to be considered as having high, medium or low wealth – for example, across study communities, high wealth status was assigned if a family member, particularly the household head, had a profession and regular income, or was able loan money to others. A household ranked as having medium wealth was perceived as not being too rich but able to send their children to school. Criteria used to rank a household as having low wealth included the inability to send their children to school and dependence only on farming for income. A dichotomous variable was used for wealth rank (0=low; 1=medium or high).
Caregivers’ nutrition knowledge and attitudes
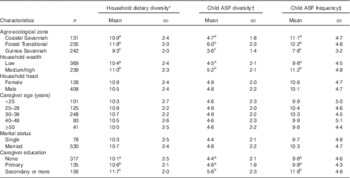
Field staff asked caregivers about their nutrition knowledge and attitudes about specific feeding practices, as well as the reasons for their responses (Table 1). Correct answers and correct reasons were scored 1 and 2, respectively. Incorrect answers and incorrect reasons or missing values were scored 0. The sum of the scores from the questions was calculated to give a maximum score of 14. The overall nutrition knowledge and attitudes score was divided into tertiles. Caregivers in the third tertile had the highest nutrition knowledge and attitudes score.
Table 1 Caregivers’ nutrition knowledge and attitudes questions, response examples and scoring scheme

ASF, animal source foods.
* These were open-ended responses. Credit was given when the response reflected the nutrition concept shown in the table.
Dietary intake
The FFQ was developed based on the guidelines from the Nutrition and Consumer Protection Division of the Food and Agriculture Organization( 25 , Reference Kennedy, Ballard and Dop 26 ). Caregivers were interviewed about foods consumed in their households in the past 7 d. The questionnaire included a list of commonly consumed foods categorised into fourteen food groups (roots and tubers, cereals, legumes, seeds and nuts, red meat, poultry, eggs, fish and seafood, dairy products, green leafy vegetables, other vegetables, citrus fruits, other fruits and fats/oils).
Using another FFQ, caregivers were asked to recall all ASF consumed by their children over the past 7 d. The ten categories included the following: livestock meats (pork, goat, mutton and beef), organ meats and offal, game animals, whole fish, fish powder, shellfish, snails, poultry (chicken, duck, guinea fowl), eggs and milk and milk products( Reference Marquis, Colecraft and Sakyi-Dawson 21 , 27 ). Children’s ASF frequency was calculated as the number of times a child consumed an ASF over the past 7 d. ASF diversity was estimated as the number of different ASF categories consumed within the same time reference.
Data management and statistical analysis
The data were analysed using the Statistical Package for Social Scientists version 19 (SPSS Inc.) and Stata version 12( Reference Hamilton 28 ). Table 1 lists the questions used to assess caregivers’ nutrition knowledge and attitudes, typical responses and scores assigned to the responses. Total nutrition knowledge and attitudes score (range 1–14) was calculated from the sum of the values for each question. The knowledge and attitudes scores were categorised into tertiles, and the means of the dietary intakes were compared across the three levels. The continuous knowledge and attitudes score was used for the multilevel analysis.
A household dietary diversity score was constructed from the fourteen food groups. A value of 0 was given to a food group if no household member consumed any item in that food group in the past 7 d; a value of 1 was given if a member consumed something in the food group. The dietary diversity score had a maximum score of 14 (eating from all fourteen food groups). Child ASF diversity score was defined as the number of different ASF groups a child consumed at least once in the past 7 d. The minimum score for child ASF diversity was 0 (did not consume any form of ASF) and the maximum was 10 (consumed from all ten groups of ASF).
The primary outcomes of the current analysis were household dietary diversity, child ASF diversity and child ASF frequency. Caregivers’ nutrition knowledge and attitudes score, characteristics of the household (wealth and size) and caregiver (age and educational status) and agro-ecological zones were the independent variables. Study variables were described using frequencies as well as means and standard deviations. Associations were first examined using bivariate analysis. Post-hoc tests (Bonferroni) were conducted for differences in means for variables with more than two categories.
Multilevel analysis
Given the hierarchical nature of the sampling design, a multilevel model was used to explore the relationship between caregivers’ nutrition knowledge and attitudes and the three outcomes of interest across the different agro-ecological zones. Individual caregiver’s characteristics that were entered in the model included the following: nutrition knowledge and attitudes, number of years of formal education, employment status, type of income-generation activity (whether or not it was related to ASF) and household wealth rank. Community characteristics that potentially influenced the outcomes of dietary intake included the mean proportion of food items purchased within the community. This variable was used as a proxy for the food environment index of the community( Reference Caswell and Yaktine 29 ) and treated as a random effect.
The agro-ecological zones served as level-2 information in the multilevel analysis. Using multilevel modelling helps overcome the problem of disregarding potential grouping effects( Reference Rabe‐Hesketh and Skrondal 30 ). These effects often lead to miscalculating the standard errors of regression coefficients by isolating ecological-specific effects from the effects of other covariates, thus taking the contextual influences into account( Reference Hox 31 ). We centred values of predictor variables to reduce non-essential collinearity between interaction terms and their components. Models were tested against the null model. Statistical significance was tested at P<0·05. The multilevel model fit was assessed using likelihood ratio tests in Stata statistical package version 12.
Ethical considerations
The study was approved by the Institutional Review Boards of Iowa State University, the Noguchi Memorial Institute for Medical Research at the University of Ghana, Legon, and McGill University. All the participants provided written informed consent for themselves and their children.
Results
Background characteristics of study participants
Almost two-thirds (61·0 %) of the participating households were ranked as having low wealth status. The mean age of the caregivers was 32·8 (sd 8·9) years, 12·8 % were single (either never married, divorced or widowed) and more than half (52·1 %) of them had received no formal education. The mean height-for-age, weight-for-age and weight-for-height Z-scores for children were −1·4 (sd 1·2), −0·9 (sd 1·0) and −0·2 (sd 0·9), respectively. On the basis of the World Health Organization child growth standards, 28·0, 13·2 and 2·0 % of the children were stunted, underweight and wasted, respectively.
Dietary intake
Household dietary diversity
The household dietary diversity score ranged from 4 to 14 with a mean of 10·6 (sd 2·4) food groups. Fig. 1 shows the proportion of households that consumed the different food groups at least once in the past 7 d. Almost all households (99·7 %) reported consuming cereals; this was followed by fats and oil (96·5 %), non-green leafy vegetables (93·8 %), green leafy vegetables (88·3 %) and nuts and seeds (87·7 %). The most common animal food group consumed was fish (98·4 %). Less than half of the households had consumed poultry (47·9 %) or dairy products (37·2 %).
Household dietary diversity differed significantly (P<0·001) across the zones (Table 2). In comparison with the Forest Transition zone and Coastal Savannah zone, households in the Guinea Savannah had the least diverse diets. It also differed significantly across different wealth-ranked households, with higher diversity among households ranked medium/high.
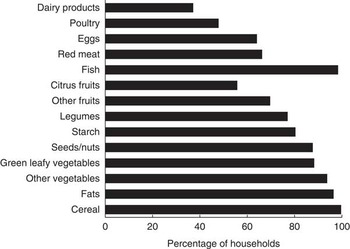
Fig. 1 Percentage of household who consumed from each food group during the past 7 d.
Table 2 Household dietary diversity and child animal source food (ASF) diversity and frequency scores, by socio-economic and demographic characteristics (Numbers, mean values and standard deviations)
a,b,c Mean values within a column with unlike superscript letters were significantly different (the Bonferroni test was use for multiple-comparison; P<0·05).
* Summative score for roots and tubers, cereals, legumes, seeds and nuts, red meat, poultry, eggs, fish and seafood, dairy products, green leafy vegetables, other vegetables, citrus fruits, other fruits and fats/oils consumed the past week (range: 4–14).
† Summative score for livestock meats, organ meats and offal, bushmeats, whole fish, fish powder, shellfish, snails, poultry, eggs and milk and milk products consumed the past week (range: 0–10).
‡ Summative score of frequency for the ASF consumed the past week (range: 0–24).
Children’s animal source food diversity and frequency
The intake of ASF varied widely among children; the ASF diversity score ranged from 0 to 10 with a mean of 4·7 (SD 2.1) foods. The frequency of ASF consumption within the past 7 d varied from 0 to 24 times with a mean of 10·2 (SD 4.7). About 90 % (89·6 %) of children consumed whole fish, making it the most frequently consumed ASF (Fig. 2). This was followed by fish powder (71·5 %) and eggs (71·2 %). The least consumed types of ASF were bushmeats and snails (26·6 and 21·5 %, respectively). Children’s ASF diversity and frequency differed significantly (P<0·0001) across the zones, with children living in the Forest Transitional zone consuming the most diverse ASF compared with children in the Guinea Savannah zone and Coastal Savannah zone. It also differed by wealth rank, with the higher intake of both indicators among households that ranked medium/high.
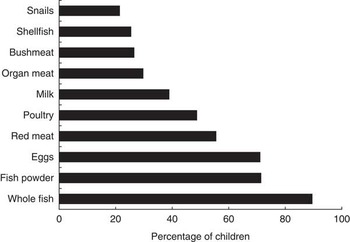
Fig. 2 Percentage of children who consumed at least once from different animal source food group.
Caregivers’ nutrition knowledge and attitudes
When asked about appropriate meal frequency, the majority of caregivers (71·1 %) believed that their 2–5-year-old children needed to be fed >3 times/d (Table 3). Over 80 % of caregivers considered snacks to be an important component of their children’s diet. Although almost 90 % of caregivers believed it necessary to supervise children’s meal times, only 50 % of them were able to articulate a correct reason for the need for supervision, with significantly fewer caregivers from the Guinea Savannah zone compared with caregivers in the Forest Transition and Coastal Savannah zone providing accurate reasons (P<0·001). Caregivers were asked to indicate who in their household they would prioritise if there were limited ASF in a household meal. About two-thirds of them said they would prioritise giving the scarce ASF to children, irrespective of the child’s sex; however, the remaining (33·9 %) indicated that they would give it to other household members. Among those who said they would prioritise children, 20 % fewer caregivers in the Coastal Savannah zone compared with the other two zones (P<0·05) gave good/correct reasons for the need to prioritise children. Over 90 % of caregivers believed it was necessary to feed children diverse diets and 98 % said ASF was important. The highest percentage of correct reasons for these two behaviours was among caregivers in the Forest Transition zone. The lowest tertile for the nutrition knowledge and attitudes score had the lowest mean scores for household diversity, child ASF diversity and child ASF frequency. The scores were significantly different from those of the highest tertile category (Table 4).
Table 3 Proportion of caregivers with correct child nutrition knowledge and attitudes, by agro-ecological zones (Percentages)

ASF, animal source food.
* Comparison of agro-ecological groups, using χ 2 goodness-of-fit test.
† Total sample size was 545: Coastal Savannah 120, Forest Transition 211 and Guinea Savannah 214.
‡ Sample size was 591: Coastal Savannah 129, Forest Transition 232 and Guinea Savannah 230.
§ Sample size was 594: Coastal Savannah 129, Forest Transition 230 and Guinea Savannah 234.
Table 4 Association between caregivers’ knowledge and attitudes score and dietary intake (Mean values and standard deviations)
ASF, animal source food.
a,b,c Mean values within a row with unlike superscript letters were significantly different (the Bonferroni test was used for multiple comparisons; P<0·05).
Multilevel analysis
To determine the extent to which the agro-ecological zone differences explained individual household-level variation in diversity scores, we fit the data to a series of random intercept models (Table 5). For household dietary diversity, the null model (model 1) showed that the mean score was 10·7. The intra-class correlation coefficient (ICC) of 0·20 in model 1 suggested that 20 % of variance in a household’s dietary diversity was attributable to agro-ecological zone level, justifying the use of a multilevel model analysis.
Table 5 Random intercept models for household dietary diversity, child ASF diversity and child ASF frequency (Mean values and standard deviations)
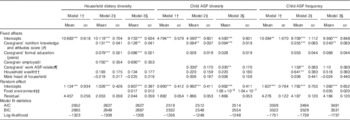
ASF, animal source food.
*** P<0·001, ** P<0·01, * P<0·05.
† Model 1 was adjusted for the agro-ecological zone.
‡ Model 2 included caregivers’ selected characteristics.
§ Model 3 introduced the food environment index into the model.
|| Caregivers’ employment status (1=employed, 0=not working).
¶ Caregivers’ income-generating activity related to ASF (1=work related to ASF, 0=not related to ASF).
†† Household wealth rank (1=high/medium ranked, 0=low ranked).
‡‡ Food environment: mean proportion of food items purchased within the community.
This contextual effect was modified significantly (P<0·001) by the introduction of caregivers’ characteristics (model 2). Household dietary diversity increased with a higher number of years of formal education of caregivers and a better nutrition knowledge and attitudes score. Having an employed caregiver also increased the household diversity score. The variance component corresponding to the random intercept decreased, reflecting that the inclusion of level-2 variables accounted for some of the variance in the dependent variable. These effects, although statistically significant, were very modest. The effect of household wealth and the sex of the household head and their interaction terms were explored and found not to contribute to the model; their interaction was also not significant and excluded from the model.
A final model (model 3) introduced an index for the food environment of the community. The effect of the food environment on the dietary intake may vary across communities; thus, this slope was treated as random. Household dietary diversity increased with an increase in the mean proportion of needed food items purchased within a community. In other words, living in a community with higher availability of needed foods increased the dependent outcome. The variance component for the random intercept was 0·807, which is still large relative to its se of 0·397. Thus, there remains still some unaccounted variance. However, comparing the Akaike information criterion (AIC) and Bayesian information criterion (BIC) statistics in Table 5 it is clear that the final model is preferred to the first two models.
The models for children’s ASF intake were similar to that of household diet diversity (Table 5). Model 1 for child ASF diversity indicated that the mean ASF diversity was 4·8 foods. The ICC for the model was 0·333, meaning that about 33 % of total variance in diversity was attributable to agro-ecological zone level. Model 2 was used to further determine the influence of caregiver and household characteristics. Child ASF diversity increased with caregivers’ nutrition knowledge and attitudes score and having a caregiver engaged in an ASF-related work. Household wealth, sex of the household head and household size and their interaction terms were also explored and found not to contribute to the model.
The multilevel modelling result for child ASF frequency followed a similar direction as that for ASF diversity. However, household wealth predicted ASF frequency. Compared with children in low wealth-ranked households, children in medium/high wealth-ranked households consumed ASF more frequently. The progressive increase in the log-likelihood observed in model 2 and model 3 and also importantly the decrease in AIC values indicated that the latter models better explained the determinants.
Discussion
After controlling for the effect of agro-ecological zone, caregivers’ nutrition knowledge and feeding attitudes positively predicted both household dietary diversity and children’s ASF diversity and ASF frequency. The multilevel analysis model allowed us to account for inequalities that existed in household food diversity and children’s ASF diversity and frequency attributable to the three agro-ecological zones, thus addressing adequately the hierarchical structure of the data. The present study was unique in that it examined nutrition knowledge and attitudes concerning specific feeding practices, particularly about ASF, and the reasons behind some feeding attitudes.
These findings extend previous research in several important ways. First, these results go beyond previous research that have studied the association of caregivers’ nutrition knowledge and attitudes with certain child outcomes and provide insights into specific reasons for feeding practices. This study suggested the need to equip caregivers with more knowledge concerning specific feeding recommendations to ensure better adherence to nutritional guidelines. About one-third of caregivers said they would prioritise other household members over children when there is limited ASF, pointing to the continued existence of some cultural beliefs and practices that are detrimental to the feeding of young children.
These findings corroborate those from earlier studies conducted among a similar socio-economic class in Ghana. Maternal knowledge gained through informal education moderated the negative consequences of poverty and low maternal schooling level on indicators of nutritional status( Reference Ehiri and Prowse 32 ). Moreover, the ability of mothers to adhere to recommended child feeding practices has been shown to be linked to maternal nutritional knowledge( Reference Aidam, Pérez-Escamilla and Lartey 33 ).
Results of the multilevel analysis showed that within each agro-ecological zone, the dietary outcomes were more strongly associated with caregivers’ nutrition knowledge and attitudes than with wealth. Although ample attention has been given to socio-demographic characteristics, this study emphasised the need to recognise the complex interplay of factors that influence what foods households eat and particularly what children are fed. Blaylock et al.( Reference Blaylock, Smallwood and Kassel 34 ) pointed out that ‘consumers make dietary decisions based on economic, physiologic, psychological, sociologic and even spiritual considerations’.
The positive association between the caregiver’s formal education and household dietary diversity has been observed in other studies( Reference Hendricks, Briefel and Novak 35 , Reference Christian, Lartey and EK 36 ). Ultimately, improvements in formal education may result in better household dietary diversity via different pathways such as improved choices or increased purchasing power. However, the path between caregivers’ education and dietary intakes of their 2–5-year-old child is not necessarily a straightforward one. Although increased years of formal education may be linked with increased awareness of a child’s needs and better child care practices, increased formal education may also lead to caregivers working outside home, with a decrease in time spent on child care.
As observed in an earlier analysis( Reference Yaro 37 ), the type of income-generation activity carried out by caregivers predicted diversity of ASF. An ASF-related business was not more profitable than non-ASF-businesses; however, the former appeared to increase ASF availability for young children. Although the variables introduced to the models were associated with the outcomes, the effect sizes, especially for caregivers’ knowledge and attitudes and formal education, were quite modest, suggesting a need to explore other variables as possible determinants of the outcomes.
Several factors may lead to the observed differences in dietary consumption across the agro-ecological zone in Ghana – for example, the Coastal Savannah and Guinea Savannah agro-ecological zones are noted for drier climates, increasing rainfall variability and hotter temperatures that often result in decreased food output and incomes( Reference Pollard, Kirk and Cade 38 ). The Forest Transitional ecological zone on the other hand has a more favourable climate and serves as an important food hub for the country. Thus, this zone is favoured with increased availability and access to food. Cultural practices and/or socio-economic characteristics, such as educational background, across agro-ecological zones may directly or indirectly influence food choices. The final model (model 3) suggested that improved access to needed foods within one’s community influenced all three dependent outcomes. Factors such as food choice and other socio-economic factors known to influence dietary intakes but not accounted for in this study may have contributed to the observed unexplained variance( Reference Kell, Judd and Pearson 39 , Reference Neumann, Murphy and Gewa 40 ).
Policy implication
This study provided a novel examination of nutrition knowledge and feeding attitudes of caregivers who are often overlooked but may influence dietary diversity, especially children’s ASF consumption in Ghana. Challenges to scaling up interventions include the absence of a generic solution to nutritional problems because of persisting infrastructural and cultural differences. Thus, there might not be a ‘one-size-fits-all approach’ in addressing health and nutrition interventions.
The different characteristics of populations found in sub-Saharan countries should remind programmes to be sensitive to cultural norms and other factors that drive caregivers’ nutrition knowledge and feeding attitudes. More resources (time and money) are needed to improve formal education and incomes of caregivers. Meanwhile, this study showed that nutrition interventions that address the negative information and misconceptions about food and child feeding practice may help achieve more healthy dietary habits.
Considering the relatively small amounts of ASF that can trigger an improvement in child growth( Reference Long, Murphy and Weiss 14 , Reference Aemro, Mesele and Birhanu 41 ), actions that improve the likelihood of increased intake, such as improving caregivers’ knowledge, is important. The amounts of ASF required to improve child growth are attainable even in rural areas, either through home production of eggs or small animals or, more likely, through markets. The final models shown in Table 3 suggest that nutrition interventions to improve dietary intake that neglect the food environment may achieve limited success. Interventions that seek to improve dietary intake need to target households with low levels of caregiver education and plan educational materials that consider caregivers with low formal educational background( Reference Torheim, Ouattara and Diarra 42 ).
Study limitations
Our results should be considered with the following limitations in mind. First, dietary intakes of the household and children were determined by recall, which is subject to recall bias. Thorough staff training and cross-validation were used to bring the effect of recall bias to a minimum. Second, dietary diversity scores and frequency may not be equated to the quality of diet. Consumption of an expensive food item may limit the consumption of other less-expensive but equally nutritious foods. A household that consumes small portions of several ASF several times in the same week may be at an advantage with respect to nutrient adequacy. This notwithstanding, several studies have suggested that dietary diversity score is a fairly accurate predictor of nutrient adequacy and household food security( Reference Ruel 43 , 44), thus we consider it a strength of this study. Finally, a cross-sectional survey cannot measure adequately behaviours over time and how changes affect food intake. A longitudinal study would better address the issue of temporality.
Conclusion
The study established that caregivers’ nutrition knowledge and feeding attitudes were significantly associated with both the household diet and the intake of ASF by 2–5-year-old children. This study lends credence to the importance of taking caregivers’ nutrition knowledge and attitudes into consideration when formulating programmes or policies of intervention in the feeding of children. Caregivers are often the gatekeepers of the household diet and are given the primary responsibility of selecting, preparing and serving food for their children. For nutrition interventions targeted at improving dietary intakes to be successful, researchers and programme managers need to understand better the existing nutrition knowledge and attitudes of their target group – the caregivers of young children.
Acknowledgements
This work was supported by the Global Livestock Collaborative Research Support Programme of the Office of Agriculture, Bureau for Economic Growth, Agriculture, and Trade, United States Agency for International Development (USAID) under terms of grant no. PCE-G-00-98-0003600. The opinions expressed here are those of the authors and do not necessarily reflect the views of the USAID.
This study falls under a broader study – The Enhancing Child Nutrition through Animal Source Food Management (ENAM) project. G. S. M., E. K. C., O. S.-D., A. L., B. K. A. and L. M. B. were the principal investigators who designed and conducted the ENAM research. A. K. C. was a graduate student under the ENAM project and contributed in preparing questions for investigation, analysed the data and wrote the paper. The authors thank Paul Voss for kindly providing the statistical expertise for the multilevel analysis. All authors read and approved the final version of the manuscript.
The authors declare that there are no conflicts of interest.


