


Malnutrition is a condition associated with depletion of body cell mass, altered body composition and diminished biological function(Reference Cederholm, Jensen and Correia1). Poor nutritional status has negative effects on several clinical outcomes such as increased risk for complications and infections, longer length of hospital stay (LOS), increased odds of hospital readmission and greater healthcare costs(Reference Adejumo, Adejumo and Adegbala2–Reference Allard, Keller and Jeejeebhoy5). At hospital admission, prevalence of malnutrition ranges from 40 to 60 %(Reference Correia, Perman and Waitzberg6) and conditions that may contribute to this include age, underlying disease, presence of infections, procedures that negatively impacts nutrient intake and lack of monitoring of nutritional status(Reference Allard, Keller and Teterina7–Reference Waitzberg, Caiaffa and Correia9).
Nutritional assessment is an essential step of the nutrition care process(Reference Waitzberg, De Aguilar-Nascimento and Dias10). In this sense, the Subjective Global Assessment (SGA) is a well-established and widely used method to assess nutritional status on the basis of patient history and physical exam(Reference Detsky, McLaughlin and Baker11). A systematic review of twenty-one studies has shown that the SGA has similar or superior performance for identifying malnutrition compared with anthropometric measurements and biochemical markers; in addition, it has the ability to predict relevant clinical outcomes. Indeed, although the SGA was originally validated in surgical patients, several studies in a variety of patient populations provide consistent evidence of its predictive validity(Reference da Silva Fink, Daniel de Mello and Daniel de Mello12).
Several characteristics of the SGA have contributed to its status as a reference standard: it is a simple, safe, inexpensive and non-invasive technique, easily performed at the bedside(Reference Barbosa-Silva and Barros13). However, few studies have so far investigated its validity for nutritional assessment over time. Braunschweig et al. (Reference Braunschweig, Gomez and Sheean14) have demonstrated that deterioration of nutritional status from hospital admission to discharge was associated with higher hospital charges. On a similar analysis, a prospective multicentre cohort(Reference Allard, Keller and Jeejeebhoy15) have shown that 20 % of patients had a deterioration of nutritional status, which was associated with prolonged LOS.
Nevertheless, it has been argued that the subjective nature of the SGA and its focus on chronic rather than acute nutritional changes tend to enhance specificity at the expense of sensitivity to detect mild alterations over time(Reference Barbosa-Silva and Barros13). Alternatively, weight loss may itself reflect relevant short-term deterioration of nutritional status as this criterion has been previously shown to predict worse clinical outcomes. Indeed, patients who experienced over 5 % weight loss during hospitalisation were at increased risk of prolonged LOS in two cohorts(Reference Braunschweig, Gomez and Sheean14,Reference Allard, Keller and Jeejeebhoy15) .
As of yet, published data are limited to analyses from admission to discharge rather than acute changes of nutritional status. Thus, the aim of the current study was to evaluate the associations between clinical outcomes and short-term nutritional decline during the first week of hospitalisation according to changes in SGA category and severe weight loss.
Methods
Study design
This is a secondary analysis of a prospective cohort study conducted in five different facilities of a hospital complex of Porto Alegre (Brazil) that enrolled a total of 601 participants and aimed to investigate the nutritional assessment of hospitalised patients(Reference Chites, Teixeira and Lima16). All patients provided written informed consent before data collection. The protocol was approved by the Ethical Committee (protocol number 2.735.945) and conducted by Brazilian ethical assumptions of 466/12 Resolution (http://bvsms.saude.gov.br/bvs/saudelegis/cns/2013/res0466_12_12_2012.html).
Patients
The inclusion criteria were lucid, oriented and able to walk patients admitted to the hospital within 48 h who were not in the intensive care unit, pregnant, lactating and postpartum. Patients with generalised oedema (anasarca) were excluded. Among of 601 patients included in the prospective cohort study, 299 stayed in hospital for at least 7 d and were therefore included in the current study.
Data collection
Data collection was performed between September 2018 and February 2020. Clinical and sociodemographic data were obtained from electronic records and included age, sex, ethnicity, admission and discharge dates, reason for admission, and previous and current medical history. Information collected from the medical records was used to calculate age-adjusted Charlson Comorbidity Index (CCI) in order to classify the clinical severity of patients(Reference Charlson, Pompei and Ales17). Patients were followed up through electronic records until hospital discharge in order to assess the primary outcomes: (1) prolonged LOS (dichotomised by the median duration of follow-up for analyses) and (2) in-hospital death. In addition, patients were contacted by phone calls after 6 months of hospital discharge to collect data regarding the secondary outcomes: (3) hospital readmission and (4) death.
The SGA was performed in the first 48 h of admission and reassessed after 7 d of hospitalisation by previously trained investigators, as proposed by Detsky et al. (Reference Detsky, McLaughlin and Baker11). For the purposes of SGA assessments, information about current body weight as well as usual body weight (defined as body weight in the past 6 months) was self-reported. Previous weight loss was then calculated ((usual body weight – current body weight) × 100 ÷ usual body weight) and expressed as a percentage to support the SGA judgement at the time of admission. Patients were also asked about changes in food intake (regarding amount and consistency) and presence of gastrointestinal symptoms in the last 2 weeks. Functional capacity was evaluated according to self-reported daily activities, and metabolic demand was stratified by mild, moderate or severe stress based on clinical judgement of the underlying disease. Upon physical examination, patients were evaluated with regard to the magnitude of (a) muscle mass loss, (b) subcutaneous fat loss, (c) generalised or localised fluid accumulation on extremities (e.g. oedema) and (d) ascites. Loss of muscle mass loss was assessed by inspection and palpation of the temporalis muscle, clavicles (pectorals and deltoids), shoulders (deltoids), interosseous muscle, scapula (latissimus, dorsi, trapezius and deltoids), thigh (quadriceps) and calf (gastrocnemius). Similarly, for subcutaneous fat loss, the examined anatomical points were the orbital region, triceps, chest and fat overlying the ribs. Each of the aforementioned criteria (muscle mass, subcutaneous fat, oedema and ascites) was judged as absent, mild, moderate or severe. Finally, patients were subjectively classified as well nourished (SGA-A), moderately or suspected of being malnourished (SGA-B) or severely malnourished (SGA-C).
For each patient, decline in nutritional status was assessed by two different methods: (a) change in SGA category within the first week of hospitalisation (i.e. from admission to 7 d later) and (b) severe weight loss alone, defined as weight loss ≥2 % during the first week of hospitalisation(Reference Blackburn, Bistrian and Maini18). For the SGA method (a), patients at any of the following situations were grouped in the ‘with SGA decline’ category: individuals classified as SGA-A at admission who subsequently changed status to SGA-B or C at reassessment; or SGA-B at admission who changed status to SGA-C at reassessment. Patients classified as SGA-C at baseline would not have been susceptible for further deterioration measured by the SGA method (since there is no ‘SGA-D’ category to which they could decline to); therefore, we considered weight loss ≥2 % during the first week of hospitalisation in patients who had been classified SGA-C at baseline as evidence of further nutritional status decline, as previously performed by other studies(Reference Braunschweig, Gomez and Sheean14,Reference Allard, Keller and Jeejeebhoy15) . Improvement of nutritional status was defined as the following changes from admission to reassessment: patients classified as SGA-C changed to B or A; or SGA-B changed to A. Those who did not have any changes in SGA category in the first week of hospitalisation were considered stable. Furthermore, patients who had an improvement as well as those who remained stable were grouped in a ‘without SGA decline’ category. At the time of reassessment, we have used self-reported body weight for the SGA diagnosis in order to maintain methodological consistency; therefore, weight loss during hospitalisation by the SGA method was calculated as ((self-reported admission weight – current self-reported weight) × 100/self-reported admission weight) and expressed as a percentage to support the SGA judgement at reassessment.
For the severe weight loss method (b) of assessing nutritional status decline, patients were categorised as ‘with severe weight loss’ if they had experienced weight loss ≥2 % during the first week of hospitalisation; otherwise, patients were categorised as ‘without severe weight loss’. We have calculated the percentage of weight loss as (measured admission weight – measured reassessment weight) × 100/measured admission weight.
Data analysis
Continuous variables were described as means and standard deviations or medians and interquartile ranges. The normality assumption for continuous variables was assessed by the Kolmogorov–Smirnov test. Categorical variables were described as absolute and relative frequencies. McNemar’s test was used for comparisons between nutritional diagnosis of the SGA at hospital admission and at reassessment. Student’s t pairwise test was performed to compare body weight at admission and reassessment. Student’s t test, Mann–Whitney U, χ 2 test and Fisher’s exact test were used for comparisons of patients with and without nutritional status decline. Logistic regression models were performed in multivariable analyses considering prolonged hospital stay and 6-month hospital readmission as dependent variables and nutritional status decline during hospitalisation as independent variable, adjusting for CCI and SGA diagnosis at admission. To evaluate the association between in-hospital death and nutritional status decline during the first week of hospital stay, Cox regression analysis was performed adjusting for confounders. Every analysis was performed in SPSS version 21.0 (IBM Corporation, SPSS, Inc.), and P < 0·05 was considered statistically significant. Post hoc statistical power analyses considering the difference in LOS and proportion of mortality rates between patients with and without decline of nutritional status were performed in an online calculator (https://www.openepi.com).
Results
General characteristics of sample
Of the 601 patients who were included in the study, 299 (49·8 %) remained hospitalised for at least 7 d. The characteristics of the total study sample and subset of patients who remained hospitalised for at least 7 d are presented in Table 1. Most of the patients were self-reported white ethnicity, had diagnosis of cancer and were submitted to a surgical procedure during the hospitalisation. The overall median of CCI was four points. The prevalence of well-nourished patients was higher at hospital admission than at the time of reassessment (i.e. after 7 d of hospitalisation).
Table 1. General characteristics of total sample at baseline assessment at the time of hospital admission and of the subset of patients reassessed at seventh day of hospitalisation*
(Mean values and standard deviations; numbers and percentages; medians and 25th–75th percentiles (P25–P75))
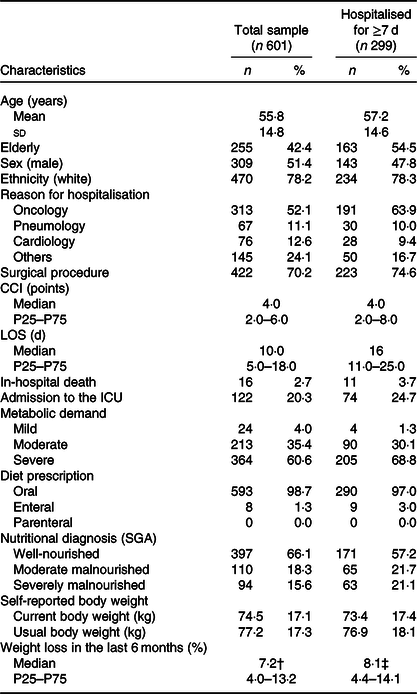
CCI, Charlson’s Comorbidity Index; LOS, length of stay; ICU, intensive care unit; SGA, Subjective Global Assessment.
* Data are presented as mean and standard deviation for continuous variables or absolute frequency (relative frequency, %) for categorical variables.
† n 272.
‡ n 157.
Changes in nutritional status during the first week of hospitalisation
Table 2 presents the comparison of nutritional diagnosis of patients at the time of hospital admission and 7 d later, with significant changes in nutritional status by the SGA method during this period. Among the sample of 299 patients who stayed hospitalised for at least 7 d, 82·6 % (n 264) did not change the nutritional status during this period, 16·1 % (n 48) experienced a decline in SGA category and 1·3 % (n 4) had an improvement in SGA category. None of the patients classified as SGA-C at baseline (n 63) had an improvement of nutritional status, whereas seventeen of them (27 %) experienced further nutritional deterioration during the first week of hospital stay.
Table 2. Changes in nutritional status of patients according to the Subjective Global Assessment (SGA) after 1 week of hospitalisation
(Numbers and percentages)
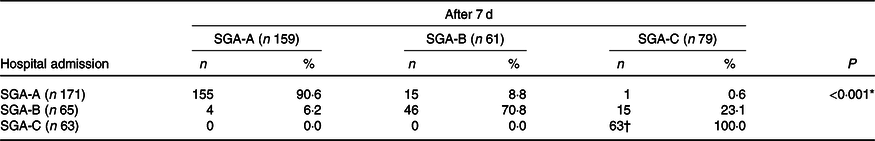
* McNemar test.
† Seventeen patients admitted in hospital with severe malnutrition (SGA-C) experienced further decline in nutritional status identified weight loss ≥2 % during the first week of hospital stay.
With regard to each individual component of the SGA, no significant changes were observed between admission and reassessment in relation to food intake, diarrhoea, vomiting or nausea (P > 0·05 for all analysis, data not shown). Throughout the first week of hospitalisation, worsening of the grading of muscle mass and subcutaneous adipose tissue was observed in 16·8 and 30·7 % of patients, respectively (statistically significant changes from baseline, P < 0·001 for both analyses). A total of 7·0 % of patients presented with ascites and 18·1 % presented with oedema at the time of admission. Of those, the majority of patients did not experience any changes in the magnitude of oedema (88·0 %) or ascites (94·0 %) during the first week of hospitalisation. Moreover, 4·7 % of the patients experienced some worsening of ascites or oedema, whereas 7·4 and 1·3 % experienced some improvement of oedema and ascites, respectively (changes from baseline were statistically significant (P = 0·035) for ascites and non-significant (P = 0·375) for oedema). In addition, among patients with some fluid accumulation at baseline who lost weight during hospitalisation, the median of weight loss was 1·99 % (interquartile range –1·13 to –3·4), while among those without any fluid accumulation at baseline it was –1·32 % (interquartile range –2·2 to –0·66).
The assessment of nutritional deterioration by severe weight loss alone was observed in 22·8 % of all patients during the first week of hospitalisation. The frequency of severe weight loss was 19·6 % in patients who had remained in the same SGA category from admission to reassessment (i.e. patients that remained stable); 15·6 % in patients who remained diagnosed as SGA-B throughout hospitalisation; and 27 % in patients who remained diagnosed as SGA-C throughout hospitalisation. Furthermore, a cross-tabulated contingency analysis presented in Table 3 revealed that 9·86 % (n 29) patients were simultaneously identified with SGA decline and severe weight loss; and 28·91 % (n 85) patients were identified with nutritional decline by either the SGA, severe weight loss alone or both methods.
Table 3. Contingency table comparing the identification of nutritional decline by two different methods
(Numbers and percentages)
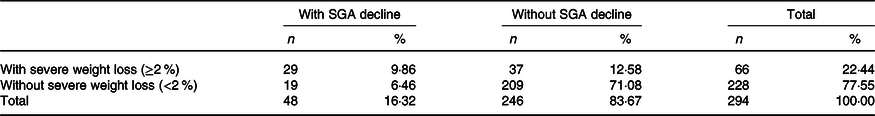
SGA, Subjective Global Assessment.
Five out of the 299 hospitalised patients had missing information about weight loss during follow-up. The overall measured body weight at admission was significantly greater after 7 d (73·2 (SD 17·3) v. 72·7 (SD 16·9) kg; P < 0·001). The median of weight change was –0·51 % (interquartile range –1·83 to 0·62); 59·5 % of patients lost weight during the first week of hospitalisation, while 5·1 % maintained and 35·4 % increased their body weight from admission to reassessment. With regard to the magnitude of weight changes, among patients who experienced weight loss, the median of reduction in body weight was –1·61 % (interquartile range –2·61 to –0·75); in contrast, median of weight gain was 1·18 % (interquartile range 0·54 to 2·10) among patients who increased their body weight during the first week of hospitalisation.
No differences between groups were identified in relation to the general features of patients with or without decline in nutritional status (assessed either by SGA or severe weight loss alone) during the first week of hospitalisation. The severity of the clinical condition assessed by CCI was also not different between groups. On the other hand, the frequency of malnutrition at hospital admission and weight loss throughout hospitalisation were higher among patients with declines in SGA category in comparison with their counterparts (Table 4).
Table 4. General features of patients and components of the Subjective Global Assessment (SGA) according to changes in nutritional status throughout the first week of hospitalisation
(Mean values and standard deviations; medians and 25th–75th percentiles (P25–P75); absolute frequencies and relative frequencies (%))
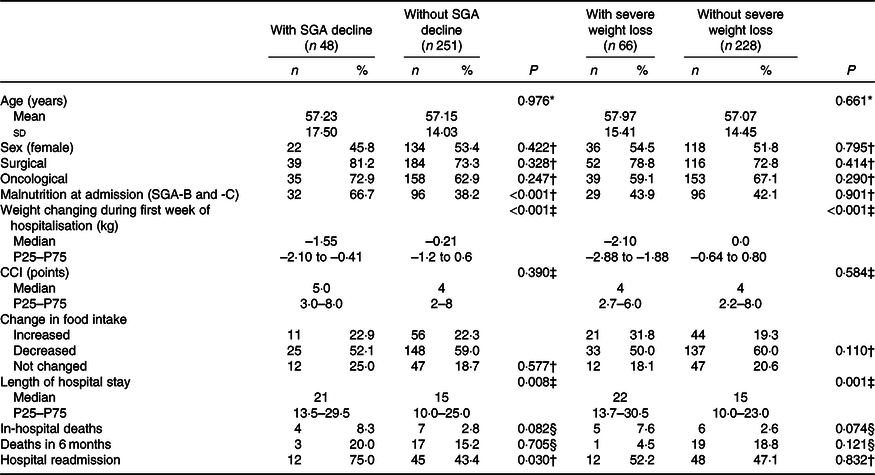
CCI, Charlson’s Comorbidity Index.
* Student’s t test.
† χ 2 test.
‡ Mann–Whitney test.
§ Fisher’s exact test.
Association between decline in nutritional status during the first week of hospitalisation and clinical outcomes
When comparing patients with and without decline in SGA category during the first week of hospitalisation, a higher frequency of 6-month hospital readmission was observed in patients who deteriorated. This group has also experienced longer LOS in comparison with control group and higher frequency of in-hospital death; such differences were, however, not statistically significant. Mortality after 6 months of discharge was also not different between groups (Table 4).
According to multivariable analysis, nutritional status decline in the first week was associated with an increased likelihood of prolonged hospital stay assessed by either decline in SGA category or severe weight loss alone. Furthermore, patients who had a decline in SGA category during the first week presented 3·6 times greater the odds of 6-month hospital readmission relative to patients who remained stable or improved nutritional status (Table 5).
Table 5. Decline in nutritional status by change in Subjective Global Assessment (SGA) category and severe weight loss as predictors of clinical outcomes: multivariate analysis*
(Odds ratios or hazard ratios (HR) and 95 % confidence intervals)
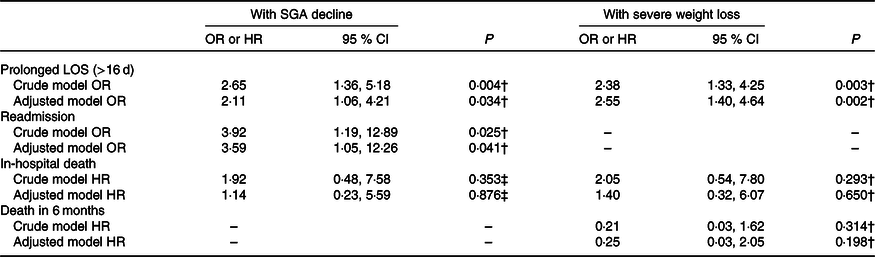
LOS, length of hospital stay; CCI, Charlson’s Comorbidity Index.
* Multivariate analysis adjusted for CCI and SGA category at admission.
† Logistic regression.
‡ Cox regression.
Considering the difference of 7 d in the LOS between patients with and without nutritional status decline and an α of 5 %, the post hoc power analysis revealed that the sample size of 299 patients included in the current study conferred a statistical power of 99·7 %. However, in a post hoc power analysis of the two-sided Fisher’s exact test, considering the observed proportion of mortality rates between ‘with SGA decline’ and ‘without SGA decline’ groups set as 8·3 and 2·8 %, respectively; our sample size was compatible with a statistical power of 35 %.
Discussion
The results of the current study have shown that throughout a period of at least 7 d of hospitalisation, approximately 17 % of patients have experienced changes in SGA categories, predominantly represented by deterioration (16·1 %) of nutritional status. In addition, approximately 23 % of all patients had weight loss of ≥2 % during the follow-up period. Patients whose nutritional status had declined during the first week of hospitalisation were at increased likelihood of prolonged hospital stay and readmission at 6 months post-discharge.
In this study, the prevalence of malnutrition at hospital admission was 33·9 %, whereas 42·8 % of patients were malnourished at reassessment (i.e. 7 d after admission). The bidirectional relationship between malnutrition and increased length of stay has been a subject of extensive discussion in the literature(Reference Adejumo, Adejumo and Adegbala2–Reference Allard, Keller and Jeejeebhoy5). Indeed, data from a multicentre study conducted in Brazil (IBRANUTRI) have shown a 33·2 % prevalence of malnutrition in patients assessed at day 2 after hospital admission, while 44·5 % were malnourished when assessed from day 3 to day 7 and 51·2 % were malnourished when assessed from day 8 to day 10. In the same study, length of hospitalisation ≥15 d was also associated with a 2-fold increased risk of malnutrition(Reference Waitzberg, Caiaffa and Correia9).
Monitoring the nutritional status of patients during 7 d of hospitalisation using the SGA revealed that deterioration was substantially more frequent than improvement, considering 16·1 % of our patients had a decline in SGA category, while only 1·3 % had improved. In a multicentre prospective cohort of 409 patients with LOS ≥7 d, Allard et al. (Reference Allard, Keller and Jeejeebhoy15) have demonstrated that 19·8 % of patients had a decline of nutritional status, whereas 17·3 % had improved. Several differences could explain the seemingly divergent results. For instance, the prevalence of malnutrition at hospital admission was higher compared with our study (50·9 % v. 42·8 %, respectively). In addition, nutritional status was reassessed at the moment of hospital discharge rather than at 7 d after admission, which means patients had the opportunity to improve (or deteriorate) for a reasonably longer period as the median LOS was 11 (interquartile range 8–17) d. Moreover, severity of disease might have been remarkably distinct between studies: our sample had a median score of 4 (interquartile range 2–8) points in the CCI, whereas 53·6 % of patients in Allard’s study had ≤2 points in CCI. Indeed, poor clinical prognosis in our cohort was expected due to the high prevalence of oncological (64 %) and surgical (75 %) patients, conditions that are likely to have compromised the nutritional recovery of many patients. In an earlier report by Braunschweig et al. (Reference Braunschweig, Gomez and Sheean14), results from a cohort of 404 participants show a decline in nutritional status in approximately 31 % of patients, whereas 30 % had improved, from admission to hospital discharge. The divergent findings may again be attributed to characteristics of study population and design: compared with our cohort, participants had a longer LOS (median of 12 d) and higher prevalence of malnutrition (54 %) at hospital admission.
Previous evidence is also scarce on factors associated with nutritional decline. In our analyses, decline of nutritional status itself was not associated with current cancer, history of surgical procedures or clinical severity regardless of the criteria (decline in SGA category or ≥2 % weight loss alone) used for assessment. In contrast, Allard et al. (Reference Allard, Keller and Teterina7) have shown in multivariable analysis that the decline of nutritional status was associated with lower admission BMI, current cancer, reduced food intake and less satisfaction with the quality of food. For surgical patients, however, only male sex was associated with deterioration of nutritional status, which is compatible with our findings given our high prevalence (75 %) of surgical inpatients. Braunschweig et al. (Reference Braunschweig, Gomez and Sheean14) have also reported a lack of association between deterioration in nutritional status and age, sex, reason for hospital admission and history of surgical procedure, whereas presence of cancer had a significant association with nutritional status decline. Taken together, the few available studies provide limited and inconsistent evidence on potentially relevant prognostic factors associated with deterioration of nutritional status.
Perhaps most important is the predictive validity of changes in nutritional status for repeated assessments over time to be pragmatically useful. In our study, subjects whose SGA category declined during hospitalisation had 2-fold increased odds of prolonged hospital stay and 3·6 times the likelihood of hospital readmission at 6 months post-discharge compared with those who remained stable or improved. Similar results were found when decline in nutritional status was assessed by ≥2 % weight loss alone, which was also associated with increased odds of prolonged hospital stay. Our findings are in line with results from Allard et al. (Reference Allard, Keller and Jeejeebhoy15), who showed that nutritional decline was associated with longer hospital stay: in multivariable analysis, SGA-A and SGA-B patients whose nutritional status declined during hospitalisation were 38 % and 65 % less likely to be discharged, respectively. Patients who had experienced weight loss of ≥5 % were also 48 % less likely to be discharged from the hospital. On the same note, Braunschweig et al. (Reference Braunschweig, Gomez and Sheean14) have demonstrated that patients whose nutritional status declined had longer but not statistically significant LOS compared with patients who remained stable or improved (19 v. 16 d, respectively). Interestingly, the authors also report the association of nutritional decline with risk of complications and infections through multivariable analyses; however, controversial findings might have been overlooked. For instance, individuals who had substantial improvement in nutritional status by changing from SGA-C to SGA-A were at much higher risk (OR 4·0; 95 % CI 1·0, 15·6) of infections than individuals stable at SGA-C throughout hospitalisation (OR 0·9; 95 % CI 0·2, 4·4). In addition, a major drawback of the aforementioned choice of analysis was its lack of statistical power due to multiple categorisations, which unfortunately limits the interpretability of the results.
A major shortfall of the traditional SGA for nutritional monitoring is its emphasis on specificity rather than sensitivity, which may hinder its ability to detect acute changes given its original purpose to identify established malnutrition(Reference Barbosa-Silva and Barros13). This limitation is further amplified by the fact that patients are classified into three broad categories. While categorisation is needed for clinical diagnosis, nutritional changes within each category may be left undetected by the traditional SGA if not severe enough to warrant a change in diagnosis; in such case, patients might remain ‘stable’ despite appreciable deterioration (or improvement). To overcome one of such limitations intrinsic to the SGA, previous studies have considered an additional 5 % weight loss for SGA-C patients in order to determine further nutritional deterioration(Reference Braunschweig, Gomez and Sheean14,Reference Allard, Keller and Jeejeebhoy15) . However, the same rationale could be applied to detect changes not only within SGA-C but also other categories. Indeed, we have demonstrated that severe weight loss during hospitalisation has also occurred within categories of patients that did not deteriorate by the SGA, which suggests that the SGA may not grasp relevant changes for nutritional monitoring considering weight loss was independently predictive of worse outcomes. In addition, the fact that the SGA does not necessarily rely on objectively measured parameters (such as body weight) may be a double-edged sword, while in many circumstances, the simplicity of this method is advantageous for nutritional assessment, it could mislead clinicians especially for nutritional status monitoring because patients may not be able to accurately report mild, short-term changes in nutritional parameters. The theoretical implications of our findings imply that for adequate monitoring of nutritional status, reassessments using the SGA should emphasise criteria that precede changes upon physical examination such as weight loss, food intake and functional capacity. This is in line with the understanding of malnutrition as a continuum, which starts with reduced intake, progresses through functional impairment and ultimately leads to changes in body composition(Reference Jeejeebhoy, Detsky and Baker19). Nonetheless, these observations seem to strengthen the idea that the traditional SGA might not be the most suitable method to successfully detect and document mild but clinically relevant changes over time. Taken together, we believe there are strong opportunities for further research to develop novel techniques aimed to most adequately support the monitoring of nutritional status during hospitalisation.
The strengths of our work lie in its prospective design with a heterogeneous sample from five different facilities of a hospital complex. Moreover, investigators were previously trained to adequately perform the SGA assessments, which maximises inter-rater reliability and enhances the internal validity of our study. Furthermore, in contrast to previously published reports, we were able to assess the relationship between change in nutritional status and additional outcomes such as in-hospital mortality, hospital readmission and mortality at 6 months post-discharge. Finally, results from different outcome groups (i.e. deterioration v. stability/improvement) are more comparable in our study than in previous published reports, given the fixed follow-up time frame of 7 d from admission to reassessment, which reduces the risk of potential survivorship bias that could have arisen from varying lengths of hospitalisation.
Some of the potential limitations of our work need to be considered. First, our study was insufficiently powered to detect the observed differences in mortality as statistically significant given our sample size, mostly due to uneven group sizes (of patients who experienced a nutritional decline compared with those who did not) and low mortality rates. Thus, we cannot be confident that there is no association between decline in nutritional status and mortality risk, as in this circumstance the absence of an association does not necessarily imply evidence of no association. Second, we were unable to further investigate plausible reasons for nutritional status decline. For instance, it is well known that reduced food intake and severity of inflammation are important aetiological factors of malnutrition(Reference Cederholm, Jensen and Correia1) and are therefore likely to play an important role in nutritional deterioration; however, we did not address whether patients were meeting nutritional requirements since data collection was restricted to a qualitative rather than quantitative assessment of food intake. In this sense, the lack of data on specific dietary prescriptions after surgical procedures, which may have influenced weight gain or loss, would have also aided the interpretation of our results in light of the high prevalence of surgical inpatients (75 %). Concerning this patient population, another limitation is the lack of data regarding the time point at which patients had undergone surgery, the degree of surgery urgency and whether it was a minor or major procedure. We were also unable to reliably account for presence and degree of inflammation due to the absence of a measurable biochemical marker (e.g. C-reactive protein) in the routine practice of our hospital. Considering that the aetiology of malnutrition has important therapeutic implications for nutritional interventions, we advise future studies for a more thorough investigation of food intake, protein and energy requirements, and pattern of inflammation. It should also be highlighted that the magnitude of actual weight change may have been over or underestimated to some degree in some patients (as 12 % of our sample had some change in the magnitude of oedema and 6 % had some change in ascites), although our analyses suggest that such non-differential measurement errors in a small fraction of our sample were unlikely to have introduced systematic bias in any particular direction with regard to the association of weight loss with clinical outcomes. While it is possible that patients with fluid accumulation lost more weight due to water weight loss, we are unable to statistically address to what extent it could be explained by water weight changes (e.g. due to use of diuretics or spontaneous improvement) or other confounding factors (e.g. patients with fluid accumulation are more likely to present with more clinically severe conditions and consequently lose more body weight). Finally, we did not recalculate the CCI at the time of nutritional reassessment, which might have been a missed opportunity to address changes in overall clinical severity. Nonetheless, the CCI score is likely to be able to adequately capture the underlying clinical severity for most patients, acting as a proxy for disease-associated prognostic factors in multivariable analysis irrespective of the actual underlying diagnosis or reason for hospital admission(Reference Austin, Wong and Uzzo20–Reference Ozrazgat-Baslanti, Blanc and Thottakkara22).
Conclusions
Decline of nutritional status throughout the first week of hospitalisation was identified in approximately 16 % of patients as assessed by decline in SGA category and in 22 % of patients as assessed by weight loss ≥2 % alone. Nutritional decline over time was associated with increased odds of prolonged length of stay and hospital readmission, which reinforces the importance of nutritional monitoring. Considering repeated measures over time are valuable to guide clinical decision-making, further investigations should address the most time-sensitive criteria in order to determine the optimal technique to identify and document acute changes in nutritional status.
Acknowledgements
The authors thank the hospital complex Santa Casa de Misericórdia de Porto Alegre and the members of the Evidence-based Clinical Nutrition Research Group for their support in the conduction of this study.
C. F. B. received a scholarship as Master Student from the Coordination for the Improvement of Higher Education Personnel. F. M. S. received a productivity scholarship from the Brazilian National Council for Scientific and Technological Development.
F. M. S. contributed to the conception of the study. C. F. B., J. L. and P. P. T. contributed to the acquisition of data. F. M. S., C. F. B., J.L. and I. C. E. contributed to the analysis and interpretation of data. J. L., P. P. T., I. C. E. and F. M. S. drafted the manuscript. All authors critically revised the manuscript, provided their final approval and agreed to be accountable for all aspects of the work ensuring its integrity and accuracy.
The authors declare that there are no conflicts of interest.


