


Having an elevated BMI is associated with a myriad of health and financial burdens(Reference Wang, McPherson and Marsh1,2) , including an increased risk of mortality and the risk of developing severe illness from COVID-19(Reference Kompaniyets3). According to the 2017–2018 National Health and Nutrition Examination Survey (NHANES), the age-adjusted prevalence of overweight and obesity (including severe obesity) among USA adults was approximately 31 %, and 42 %, respectively. Notably, the rates of severe obesity (BMI ≥ 35 kg/m2) continue to rise among USA adults, disproportionately affecting non-Hispanic Blacks, females and individuals with low socio-economic status(Reference Ward, Bleich and Cradock4–Reference Hales, Fryar and Carroll6). Therefore, understanding the various factors linked to the prevention of obesity and identifying higher-risk subpopulations is crucial from a public health perspective.
Efforts to prevent obesity in adults have included screening all adults for obesity and providing behavioural interventions for effective weight loss, as recommended by the USA Preventive Services Task Force(Reference Curry and Krist7). Additionally, growing evidence has supported the use of behavioural weight loss strategies that target both physical activity (PA) and dietary intakes(Reference Johns, Hartmann-Boyce and Jebb8–Reference Pate, Taverno Ross and Liese11). At the national level, the Dietary Guidelines for Americans(12) and the Physical Activity Guidelines for Americans are both crucial yardsticks for promoting healthier weights(Reference Cohen, Matthews and Signorello13–15). Previous studies showed an inverse relationship between BMI and adherence to the Healthy Eating Index (HEI)(Reference Guo, Warden and Paeratakul16–Reference Lin, Gao and Lee18), which is developed as an indicator of dietary quality based on the Dietary Guidelines for Americans(19). In addition, adults who did not meet the PA guidelines, which recommend at least 150 min of moderate- to vigorous-intensity physical activity per week, were found to have a higher BMI compared to those who met the PA guidelines(Reference Pate, Taverno Ross and Liese11,Reference Japas, Knutsen and Dehom20) .
While behavioural factors related to diet quality and PA in adults with obesity have been extensively documented using data from a nationally representative survey in the USA(Reference Guo, Warden and Paeratakul16,Reference Wang and Chen21–Reference Jia, Lu and Wu24) , the variations in diet quality among adults with excess body weight remain poorly understood. The factors influencing diet quality within this population are also unclear, particularly regarding socio-demographic characteristics and behavioural factors related to PA.
Therefore, the main objectives of this study were (1) to examine socio-demographic differences by weight status among USA adults with overweight and obesity using data from the 2015–2016 and 2017–2018 rounds of the NHANES, (2) to describe the differences in diet quality among different weight statuses using the HEI-2015 scores, and (3) to examine the socio-demographic characteristics and PA factors that contribute to the observed differences, aiming to identify high-risk subgroups and promote more targeted interventions for obesity.
Materials & methods
Study and sample design
The present study is a cross-sectional analysis of data obtained from the NHANES, which reports multiple survey cycles conducted among nationally representative samples of USA non-institutionalised individuals(25). NHANES utilises a multi-stage probability method to select its sample participants and collects information on various aspects, such as demographics, socio-economics and nutrition, to facilitate research in epidemiology and medicine(25). It is one of the population survey programmes directed by the National Center for Health Statistics (NCHS), a section of the Centers for Disease Control and Prevention. The NCHS Ethics Review Board approved NHANES, and written informed consent was obtained from all recruited participants(25). We selected participants from two NHANES cycles: 2015–2016 and 2017–2018 (n 19 515). Since each participant has a survey weight that needs to be incorporated into the analysis regardless of whether they are included in the final sample(26), we subsetted the data to the population of our interest by applying a series of our selection criteria (see Fig. 1), the final sample size was 6476 overweight and obese adults (aged ≥ 20 years).
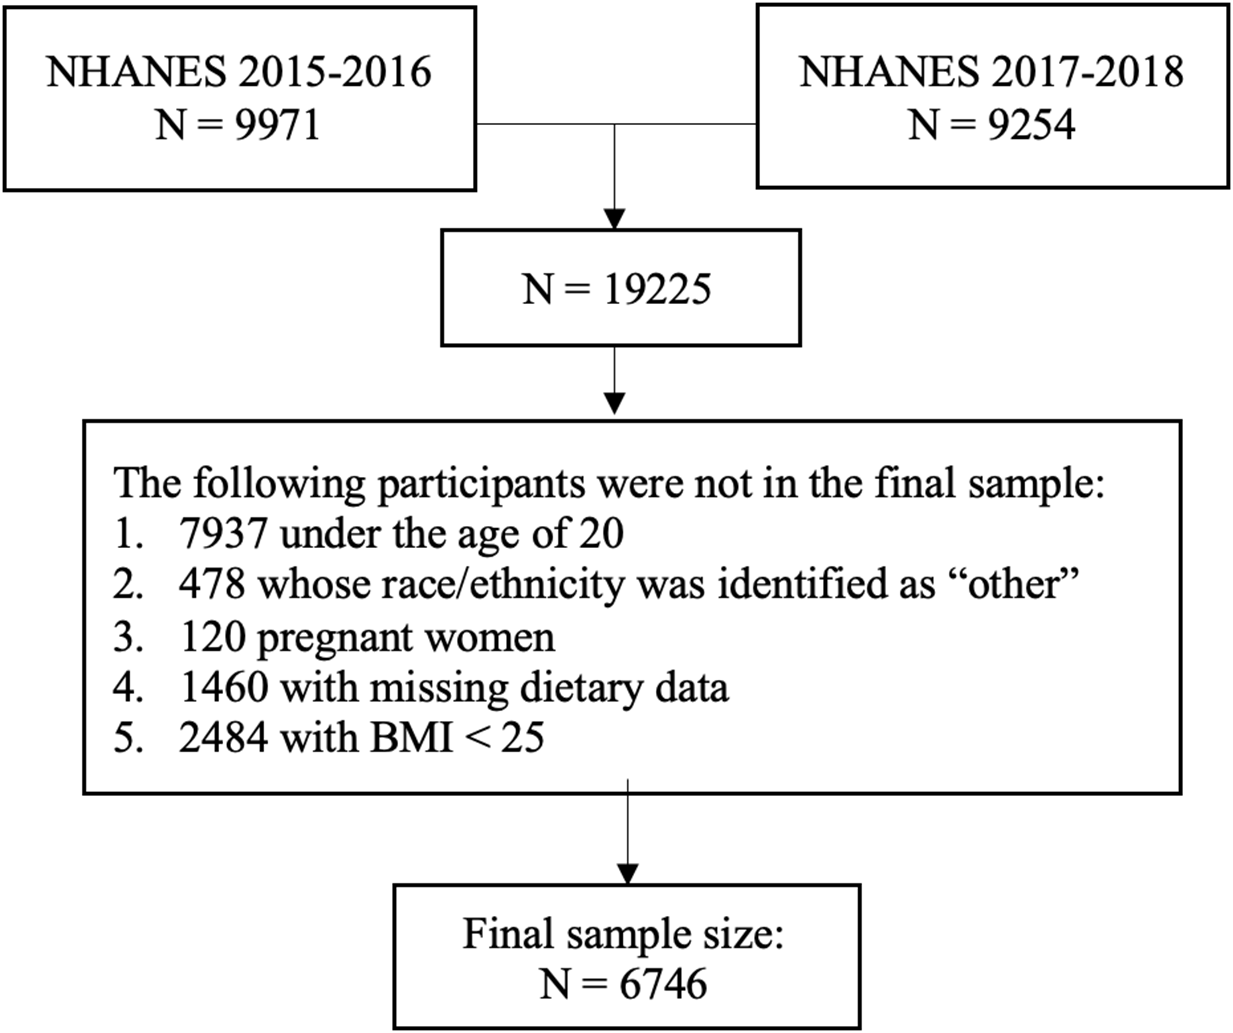
Fig. 1. Flowchart for sample selection based on the NHANES 2015–2018.
Primary explanatory variable: weight status
The NHANES 2015–2018 body measurement data were collected by trained health technicians whose performance was monitored and evaluated in the Mobile Examination Center, and the details were provided elsewhere(25). BMI kg/m2 was obtained by calculating the weight divided by squared height. According to the CDC definition(27), weight status was classified as overweight (BMI ≥ 25 to < 30 kg/m2) and obesity (BMI ≥ 30 kg/m2). Obesity was further divided into three classes: Class 1 obesity (≥ 30 to < 35 kg/m2), Class 2 obesity (≥ 35 to < 40 kg/m2), and Class 3 obesity (≥ 40 kg/m2). Consistent with another research(Reference Hames, Coen and King10), Class 2 and Class 3 obesity (BMI ≥ 35 kg/m2) were categorised as severe obesity(Reference Ward, Bleich and Cradock4).
Outcome variables
The diet quality score was determined by using the HEI-2015, a scoring system developed by the National Cancer Institute and the USA Department of Agriculture that aimed to reflect the Dietary Guidelines for Americans 2015–2020(19,28) . The HEI-2015 scores were calculated based on the dietary intake data that were collected by trained dietary interviewers(25). The USDA’s Automated Multiple-Pass Method was applied during the two 24-hour dietary recall interviews, and further details were described elsewhere(25). We used the first-day dietary intake data in this study.
The HEI-2015 has 13 different components that are separated into two categories(Reference Krebs-Smith, Pannucci and Subar29). The first category contains nine adequacy components (a higher score means a higher intake): total fruits, whole fruits, total vegetables, greens and beans, whole grains, dairy, total protein foods, seafood and plant proteins, and fatty acids. The second category contains four moderation components (a higher score reflects a lower intake): refined grains, sodium, added sugars, and saturated fats. According to the scoring standards, both minimum and maximum scores were assigned to each component(30). And the in-between scores were calculated as proportions to the intakes between the maximum and minimum intake standards. The simple HEI scoring algorithms method was applied to calculate the HEI-2015 scores for each participant after the amount of the first-day dietary intake was obtained for each individual(30). The HEI-2015 total score is the sum of all the component scores, which ranges from 0 to 100. A higher total score indicates better diet quality(Reference Panizza, Shvetsov and Harmon31,Reference Wang, Zhao and Nie32) .
Covariates
Data related to gender, age, race/ethnicity, education and family income level were also obtained(25). NHANES reported race/ethnicity based on six categories: Mexican American, Other Hispanic, non-Hispanic White, non-Hispanic Black (NHB), non-Hispanic Asian (NHA), and other race. Consistent with existing research(Reference Ma, Weng and Gao33), we combined the Mexican American and other Hispanic populations into a single group described as ‘Hispanic’ to increase the sample size. Additionally, we excluded participants of other race due to the small sample size. Age was divided into three groups: 20–39 years, 40–59 years, and ≥ 60 years(Reference Ogden, Carroll and Kit34). The highest education level achieved was recoded into three levels: low (less than a high school degree), middle (high school degree and some college or associate degree), and high (college graduate or higher). The poverty income ratio (PIR), which is the ratio of family income to the federal poverty level, was used to indicate family income levels(Reference Kailembo, Quiñonez and Lopez Mitnik35). In line with a previous study(Reference Ma, Weng and Gao33), PIR, ranging from zero to five in the NHANES, was calculated and divided into three categories: PIR < 1·3, 1·3 ≤ PIR < 3·5, and PIR ≥ 3·5.
Data related to PA were obtained by using the Global Physical Activity Questionnaire(Reference Kim, Canada and Kenyon36). Moderate-intensity physical activity is defined as activities that would increase heart rate and cause perspiration, and vigorous-intensity physical activity involves activities that would significantly increase heart rate and breathing. The participants were asked to report the duration of the PA they engaged in at both moderate and vigorous intensity levels in a typical week across three domains: work, transportation, and recreation. The total time of moderate- to vigorous-intensity physical activity (minutes/week) for each participant was calculated by adding the weekly minutes of moderate-intensity physical activity and vigorous-intensity physical activity in the domains of work, transportation, and recreation. Adult participants aged ≥ 20 years were considered as meeting the PA guidelines if they engaged in at least 150 min of moderate- to vigorous-intensity physical activity according to the current Physical Activity Guidelines for Americans(15,Reference Piercy, Troiano and Ballard37) .
Statistical analysis
Since oversampling is often performed to increase the precision of the estimation of a certain subgroup and to match the population counts provided by the Census Bureau, sample weight was applied in the design of NHANES. Consistent with the NHANES rule for selecting the most suitable weighting variable(38), we used the dietary day-one weighting variable along with the variables related to the stratum and primary sampling unit in the analytical process. Statistical methods for complex survey designs were used for both descriptive and inferential analyses.
Rao-Scott χ2 test was applied for categorical variables to examine socio-demographic differences by weight status (overweight (BMI ≥ 25 to < 30 kg/m2), class 1 obesity (BMI ≥ 30 to < 35 kg/m2), and severe obesity (BMI ≥ 35 kg/m2)), and Bonferroni multiple-comparison correction was applied. Differences in the HEI-2015 total and component scores across different weight statuses were examined by using ANOVA. Tukey’s honest significant difference correction was applied to all post hoc multiple comparisons between weight statuses. P < 0·029 was to be considered statistically significant. Additionally, we plotted the percentages of maximum possible scores for the 13 HEI-2015 components in a radar chart to help visualise the differences in intake of each component across weight statuses. To determine significant socio-demographic characteristics and PA that explain differences found in diet quality between weight statuses, 14 multiple linear regression models were run. All models included the HEI-2015 total score or an HEI component score as the outcome variable, and weight status as the primary explanatory variable, adjusted for gender, age, race/ethnicity, education PIR, and the status of meeting PA guidelines. All statistical analyses were performed using R (version 4.0.3, R Core Team, Vienna, Austria).
Results
This study included a total of 6746 participants aged ≥ 20 years with a BMI ≥ 25 kg/m2. Over half of the participants were females (51 %). Approximately 72 % of them were aged ≥ 40 years (34 % 40–59 years old and 38 % ≥ 60 years old). Among these participants, 36 % were non-Hispanic White, 32 % were Hispanic, 24 % were NHB, and 8 % were NHA. Based on the socio-economic data, only 23 % of them had a college degree or above, and 38 % of them had low household income (PIR < 1·3). Approximately 70 % of them met PA guidelines (Table 1).
Table 1. Sample characteristics for 6746 adults (≥ 20 years of age) with overweight and obesity of the NHANES 2015–2018 (weighted analysis), by weight status*

NHANES, National Health and Nutrition Examination Survey; NHW, non-Hispanic White; NHB, non-Hispanic Black; NHA, non-Hispanic Asians; PIR = poverty income ratio; PA, physical activity.
* Weight status was categorised into three groups: BMI ≥ 25 to < 30 kg/m2 was classified as overweight; BMI ≥ 30 to < 35 kg/m2 was classified as Class 1 obesity; BMI ≥ 35 kg/m2 was classified as severe obesity.
† Class 1 obesity significantly different from overweight.
‡ Severe obesity significantly different from overweight.
§ Severe obesity significantly different from class 1 obesity.
|| The highest education achieved was divided into three levels: low (less than a high school degree), middle (high school degree and some college or associate degree), and high (college graduate or higher).
¶ Age-based Physical Activity Guidelines for Americans recommended at least 150 min of moderate- to vigorous-intensity physical activity per week.
** P-values were derived from the design-based Rao-Scott χ2 omnibus test. Bonferroni correction was applied when making multiple comparisons among weight statuses.
Table 1 also shows the distribution of overweight, class 1 obesity, and severe obesity by different socio-demographic characteristics and adherence to PA guidelines. Over one-fourth of participants had severe obesity (BMI ≥ 35 kg/m2). Among female participants, the prevalence of severe obesity was the highest, followed by class 1 obesity, and overweight. Conversely, among male participants, the prevalence of overweight was the highest, followed by class 1 obesity and severe obesity. NHB participants were more likely to have severe obesity than overweight, while NHA participants were less likely to have severe obesity than overweight. Those with a high education level (college degree and above) and a PIR ≥ 3·5 were less likely to have severe obesity than overweight. Participants who did not meet PA guidelines were more likely to have severe obesity compared to overweight, while those who did not meet the guidelines were more likely to have severe obesity compared to overweight.
Table 2 presents the weighted pairwise comparisons of mean HEI-2015 scores among participants with overweight, class 1 obesity, and severe obesity. Participants with severe obesity had the lowest HEI-2015 total score, followed by those with class 1 obesity and overweight. Additionally, participants with severe obesity had significantly lower score for total fruits, whole fruits, whole grains, sodium, and saturated fats as compared to those with overweight. Participants with class 1 obesity had significantly lower score for whole fruits, greens and beans, and sodium as compared to those with overweight.
Table 2. Weighted Healthy Eating Index-2015 (HEI-2015) scores for 6746 adults (≥ 20 years of age) with overweight and obesity of the NHANES 2015–2018, by weight status*

NHANES, National Health and Nutrition Examination Survey; se, standard error.
* Weight status was categorised into three groups: BMI ≥ 25 to < 30 kg/m2 was classified as overweight; BMI ≥ 30 to < 35 kg/m2 was classified as Class 1 obesity; BMI ≥ 35 kg/m2 was classified as severe obesity.
† Class 1 obesity significantly different from overweight.
‡ Severe obesity significantly different from overweight.
§ Severe obesity significantly different from class 1 obesity.
|| Tukey’s correction was applied when making multiple comparisons among weight statuses with P-value < 0·029 to be considered significant. P-values were derived from design-based ANOVA across all weight statuses.
The radar chart provides a clear visual representation of the differences and similarities in the percentage of the maximum possible score for each HEI-2015 component between weight statuses (Fig. 2). The scoring patterns were strikingly similar among all three groups, with all three scoring relatively high for total protein foods and very low for greens and beans and whole grains.
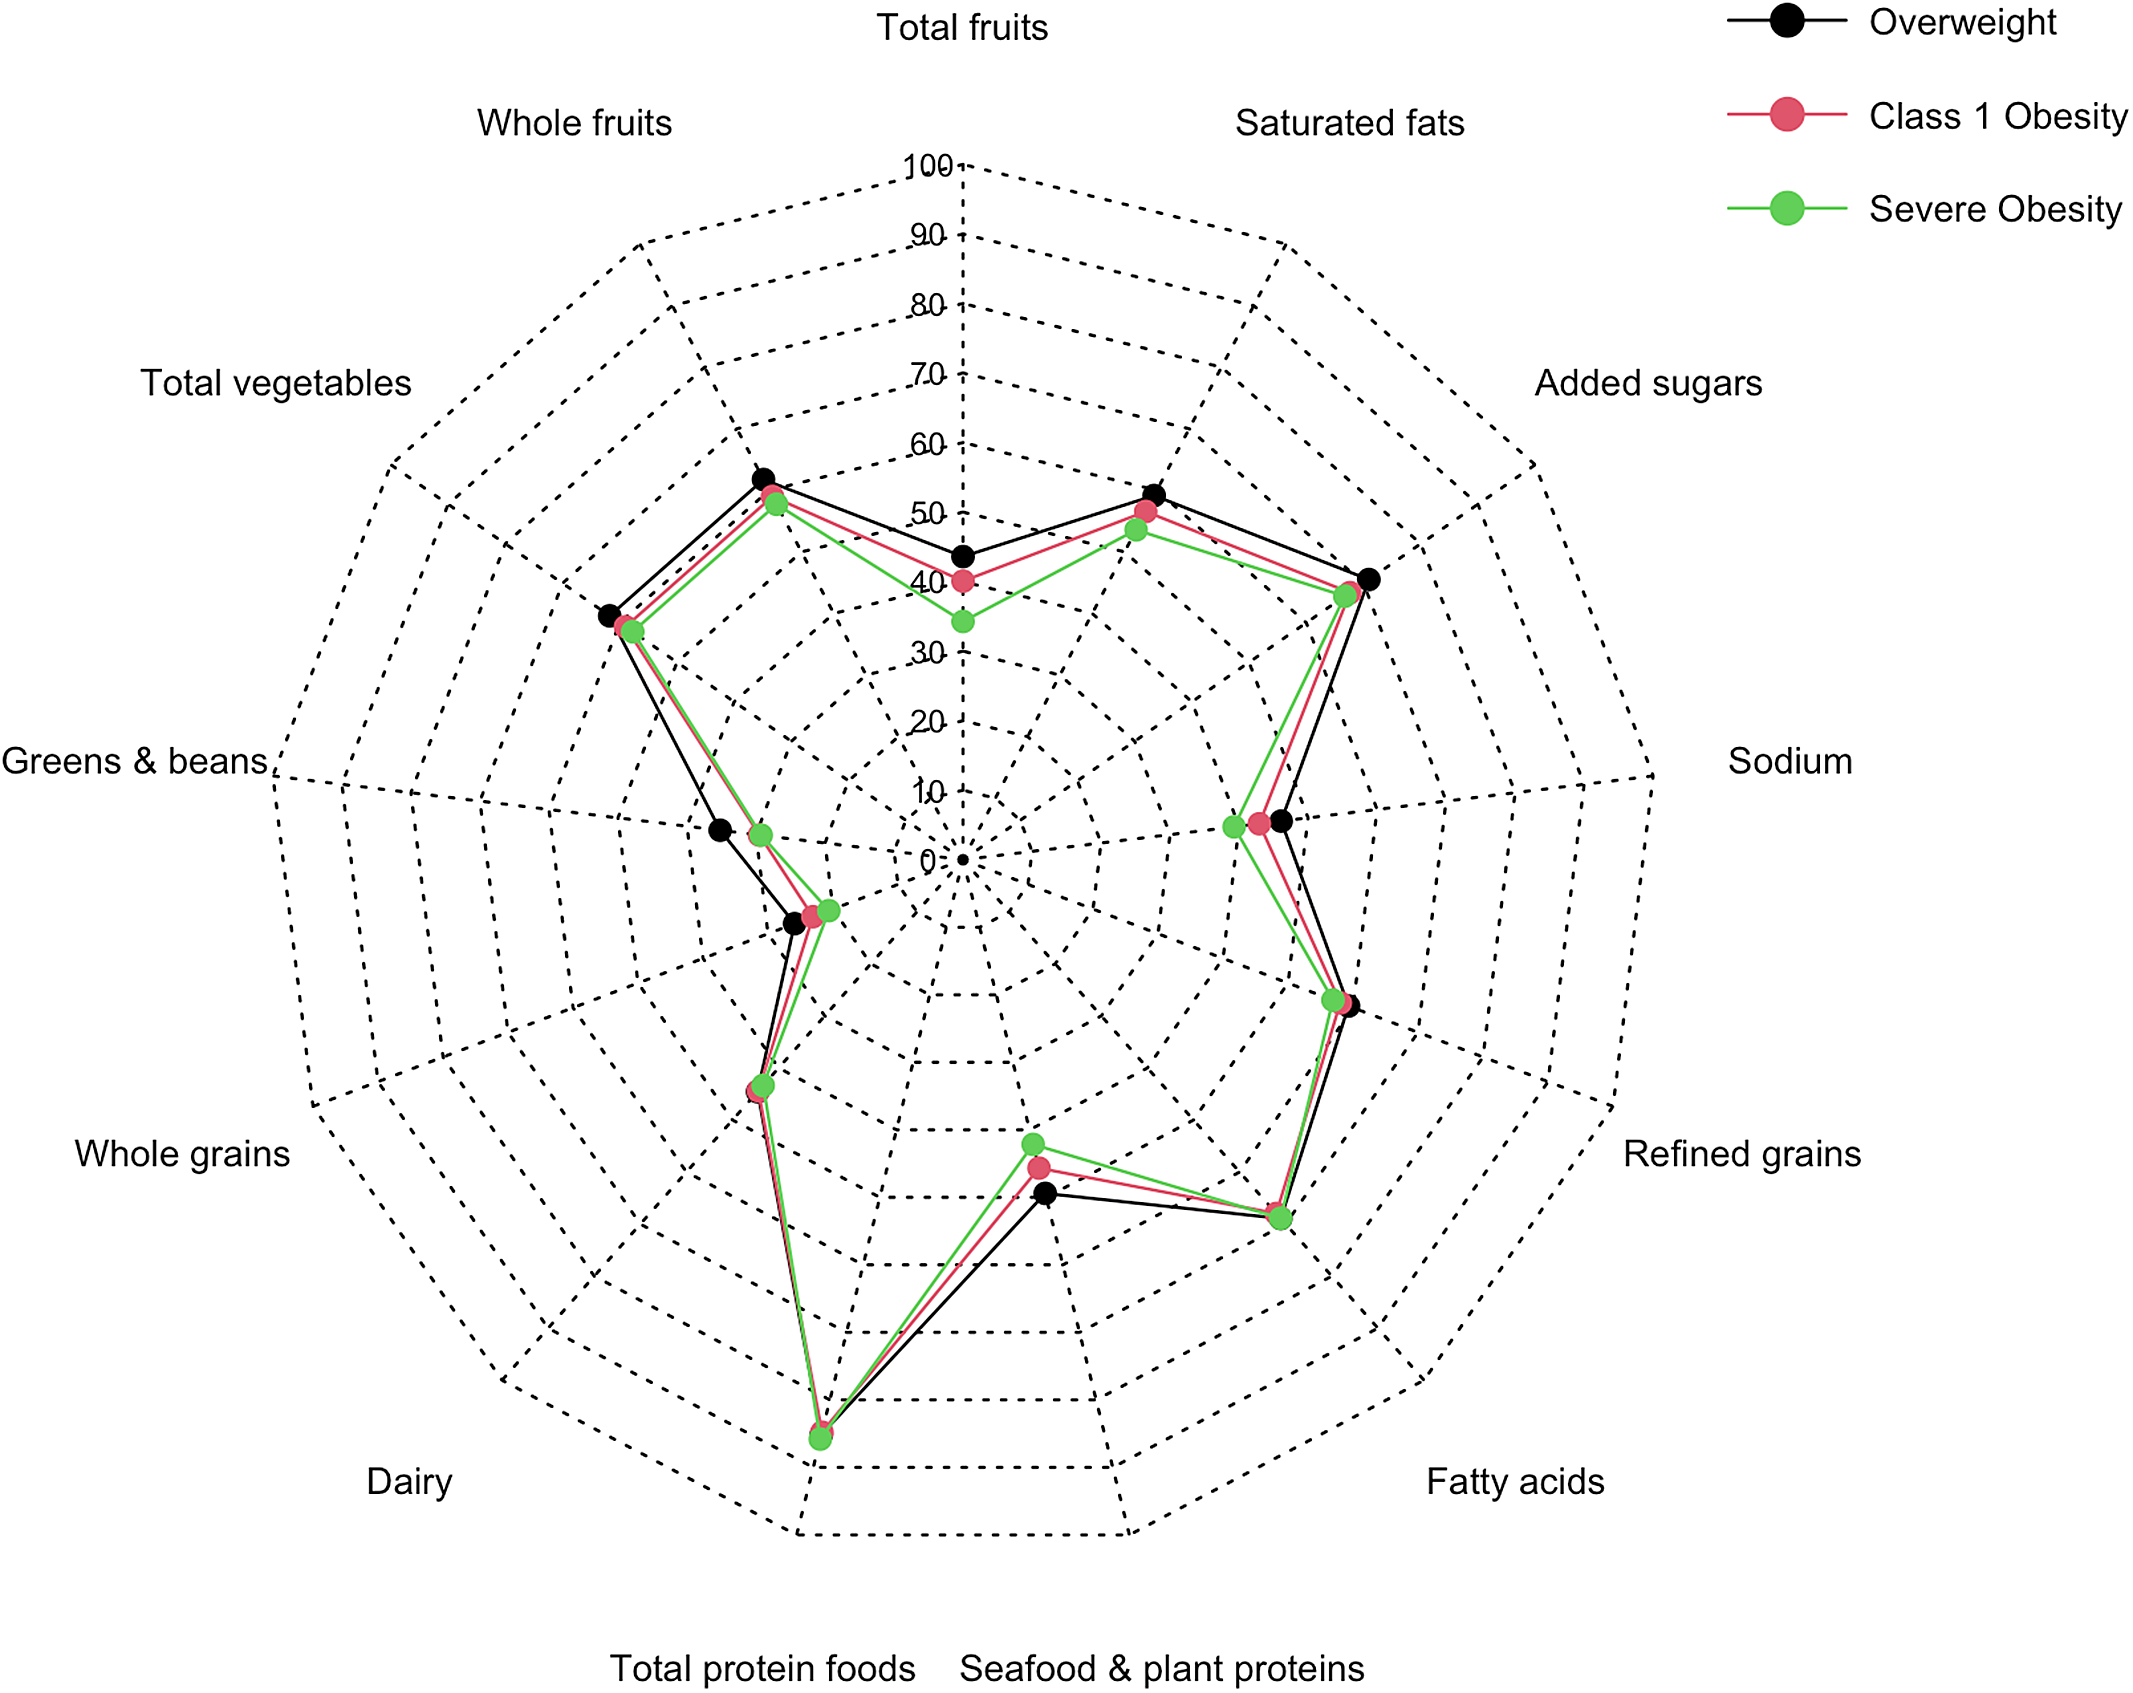
Fig. 2. Radar chart for percentages of maximum possible scores for HEI-2015 components in different weight statuses.
Table 3 summarises the associations of HEI-2015 scores with various factors including weight status, age, gender, race/ethnicity, education, income, and status of meeting PA guidelines. Severe obesity was associated with a lower total score and lower scores for total fruits, whole fruits, greens and beans, refined grains, and sodium. Female participants had significantly higher total scores and scores for total fruits, whole fruits, total vegetables, greens and beans, and seafood and plant proteins than their male counterparts. NHA participants had significantly higher total scores and scores for whole grains, added sugars and saturated fats compared to Hispanic participants. On the other hand, non-Hispanic White and NHB participants had significantly lower total scores and scores for total fruits, whole fruits, total vegetables, greens and beans, seafood and plant proteins, and added sugars compared to Hispanic participants. Age showed significant positive associations with the total score and all component scores, except for dairy, total proteins, fatty acids, and saturated fats. Similarly, education level showed a positive association with the total score and all component scores, except for dairy, total proteins, fatty acids, sodium and saturated fats. Few significant associations were observed between HEI-2015 scores and both income and the status of meeting PA guidelines.
Table 3. Multiple linear regression results on the association of Healthy Eating Index-2015 (HEI-2015) scores with weight status and selected socio-demographic and physical activity factors for 6746 adults (≥ 20 years of age) with overweight and obesity of the NHANES 2015–2018†

NHANES, National Health and Nutrition Examination Survey; NHW, non-Hispanic White; NHB, non-Hispanic Black; NHA, non-Hispanic Asians; PIR = poverty income ratio; PA, physical activity; ref, reference.
* P < 0·05.
** P < 0·01.
*** P < 0·001.
† All data were presented as ß, coefficient, and 95 % CI, confidence interval.
‡ Weight status was categorised into three groups: BMI ≥ 25 to < 30 kg/m2 was classified as overweight; BMI ≥ 30 to < 35 kg/m2 was classified as class 1 obesity; BMI ≥ 35 kg/m2 was classified as severe obesity.
§ The highest education achieved was divided into three levels: low (less than a high school degree), middle (high school degree and some college or associate degree), and high (college graduate or higher).
|| Age-based Physical Activity Guidelines for Americans recommended at least 150 min of moderate- to vigorous-intensity physical activity per week.
Discussion
To our knowledge, no prior studies have examined the association between HEI-2015 scores and weight status along with socio-demographic variables and PA among USA adults with overweight and obesity. One of the primary findings in our study was that, in general, participants with overweight had significantly higher scores for total diet quality and six diet quality components as compared to participants with either Class 1 obesity or severe obesity. Specifically, participants with severe obesity were more likely to have a lower HEI-2015 total score and scores for total fruits, whole fruits, whole grains, sodium and saturated fats as compared to those with overweight. These results are consistent with literature that has documented a negative relationship between adult obesity and HEI scores(Reference Guo, Warden and Paeratakul16,Reference Gao, Beresford and Frank22,Reference Asghari, Mirmiran and Yuzbashian39) . They also align with the evidence from the literature supporting the association between weight gain and decreased consumption of plant-based foods including fruit, vegetable, whole grains, nuts and legumes, as well as increased consumption of sodium(Reference Schlesinger, Neuenschwander and Schwedhelm40,Reference Ptomey, Goetz and Lee41) . However, only two studies had a study sample similar to ours. Sundararajan et al. did report an inverse relationship between the HEI-2005 total score and BMI among Canadian adults with overweight and obesity(Reference Sundararajan, Campbell and Choi42), but their analyses did not include HEI component scores. The study by Ptomey et al. had a more comparable scope to ours, using HEI-2005 scores to show that higher intakes of total fruit, whole fruit, total vegetables and whole grains were associated with lower BMI among USA adults with overweight and obesity(Reference Ptomey, Goetz and Lee41). In contrast, one study found that adult women with severe obesity had a higher HEI-2010 score compared to those with moderate obesity(Reference Richardson, Arsenault and Cates43). One possible explanation could be the populations of interest, as Richarshon et al.’s study focused solely on adult women with a child enrolled in a special programme in North Carolina.
In addition to the main findings, this study also identified significant differences in HEI-2015 scores among various socio-demographic subgroups based on gender, age, race/ethnicity, education and income. We found that NHB adults with overweight and obesity consumed significantly fewer fruits and vegetables compared to their counterparts in other racial/ethnic groups. These findings are consistent with a previous study that reported NHB individuals were less likely to meet national recommendations for fruit and vegetable intake compared to other racial/ethnic groups(Reference Moore, Dodd and Thompson44). NHB adults with overweight and obesity were also less likely to consume dairy compared to other races/ethnicities, which is in line with another study showing that dairy intake for both NHB men and women was lower than that for their racial/ethnic counterparts(Reference Fulgoni, Nicholls and Reed45). The lower intake of dairy among NHB adults may be due to their lactose intolerance and cultural food preferences(Reference Hiza, Casavale and Guenther46). The finding that NHA adults with overweight and obesity were more likely to have better overall diet quality, a higher intake of whole grains, and a lower intake of added sugars is consistent with evidence showing that a higher intake of whole grains is associated with higher HEI scores and a lower intake of added sugars(Reference O’Neil, Nicklas and Zanovec47). A study by Thompson and colleagues also found that added sugar intake was the lowest among NHA adults when compared to Hispanic and NHB adults(Reference Thompson, McNeel and Dowling48).
Significant gender differences were also observed among adults with overweight and obesity, with females scoring higher in the HEI-2015 total score and five out of nine adequacy components. This finding corresponds well with previous research showing that females had a higher HEI total score as well as scores for total fruits, total vegetables, dairy, and legumes(Reference Hiza, Casavale and Guenther46).
It is also worth noting that significant differences in diet quality were found among different age groups, with older adults with overweight and obesity scoring higher on the HEI-2015 total score and most components. Older adults may be more motivated to prioritise their health and prevent the development of other illnesses and severe obesity. Additionally, they may have more knowledge of nutrition and more resources to afford healthier foods, which could explain the observed trend of increasing diet quality with age(Reference Leslie and Hankey49,Reference Stosovic, Vasiljevic and Jovanovic50) . Furthermore, we also observed a positive association between diet quality and education level, which reflects the literature showing that higher education was associated with a less obesity rate and higher diet quality(Reference de Mestral, Chatelan and Marques-Vidal51).
Concerning adherence to PA guidelines, we found that participants who met PA guidelines had significantly better total diet quality compared to those who did not meet PA guidelines. Although there is a lack of research on the relationship between diet quality and PA among adults with overweight and obesity, our result aligns with the study by Mitchell et al., which reported a positive association between nutrition quality and PA.
Furthermore, in line with our findings, Ward et al. also observed a higher prevalence of severe obesity among NHB individuals and those with lower education and income(Reference Ward, Bleich and Cradock4). One study suggested that healthy foods are often more expensive and have become an economic burden for lower-income and minority consumers(Reference Fulgoni and Drewnowski52), which could potentially explain the result in our study indicating lower HEI-2015 scores among these subgroups.
There are several limitations in this study. Prior studies have shown that NHA participants included in the NHANES were typically skewed to have higher income and more education, so we acknowledge that the results may not represent the NHA adults having lower-income and less education achievement(Reference Oh, Galanter and Thakur53). In general, NHAs tend to have higher adiposity levels(Reference Thomas and Leak54). Therefore, there is a need to consider changing BMI cutpoints for this group and including other obesity indicators such as adiposity measures(Reference Liu, Du and Wu5). Additionally, NHANES is a cross-sectional study that relies heavily on self-reported dietary data, which are subject to underreporting of diet intakes from those who were not satisfied with their body image(Reference Fulgoni, Wallace and Stylianou55). We did not address other socio-economic and obesity-related factors such as marital status, neighbourhood environment and smoking, which might also have impacts on the disparities in obesity according to previous studies(Reference Min, Goodale and Xue56).
Nevertheless, to the best of our knowledge, this cross-sectional study is the first to investigate the socio-demographic differences among over 6000 adults with overweight, class 1 obesity, and severe obesity, as well as evaluate the variations in diet quality across different weight statuses and socio-demographic and PA factors. Understanding the disparities in modifiable behavioural risk factors like dietary intake can help to identify the most susceptible groups for more targeted obesity interventions. The results of our study highlight the importance of improving overall diet quality and increasing the intake of healthy foods, such as fruits, vegetables and whole grains, among adults with overweight and obesity who are male, NHB, younger, less educated and less physically active. Additionally, nutrition recommendations should emphasise reducing intakes of sodium, refined grains and saturated fats to prevent further weight gain among adults with overweight and obesity.
Acknowledgements
The authors thank Martin O’Brien and Editage, a proofreading company, for their assistance in editing the manuscript.
This research received no specific grant from any funding agency, commercial or not-for-profit sectors.
The authors’ contributions are as follows: Y.Z. contributed to study design and data analyses, interpreted the findings and wrote the manuscript; T.A. was the supervisor of this study. All authors read and approved the final version of the manuscript.
The authors have no financial or personal conflicts of interest to declare.


 Open access