


The incidence and prevalence of patients with kidney failure are increasing worldwide, and the prevalence of patients in early stages of chronic kidney disease is even higher( Reference Eknoyan, Lameire and Barsoum 1 ). Obesity increases the risk for developing kidney disease and adversely affects the progress of kidney disease( Reference Wang, Chen and Song 2 ), partly explained by impaired glucose regulation( Reference Maric-Bilkan 3 ). Obesity is an important and independent risk factor for development of chronic renal diseases( 4 – Reference Ting, Nair and Ching 7 ), and this is of concern as the prevalence of obesity is increasing all over the world( 8 ).
Both paediatric and adult patients with chronic kidney failure are recommended a diet with modest protein restriction to limit the development of toxic nitrogenous metabolites, uraemic symptoms and other metabolic complications( Reference Kopple 9 , 10 ). The dietary advice for these patients in general does not distinguish between different sources of proteins, although intake of fish has been shown to reduce the risk for developing kidney disease both in the general population( Reference Gopinath, Harris and Flood 11 ) and in the patients with type 1 diabetes( Reference Mollsten, Dahlquist and Stattin 12 ). Still, little is known about how various types of dietary proteins may affect kidney function, both in the healthy population and in individuals with high risk of developing impaired kidney function.
The obese Zucker fa/fa rat is a popular rat model for studies on development and treatment of the metabolic syndrome, as this rat presents a range of abnormalities similar to those seen in humans, including insulin resistance, dyslipidaemia, mild glucose intolerance and hypertension( Reference de Artinano and Castro 13 ). Obesity is also associated with proteinuria and focal segmental glomerulosclerosis both in humans and rats and increases the risk of developing renal disease( 4 – Reference Ting, Nair and Ching 7 , Reference Stevenson, Wheeldon and Gades 14 ). Obese Zucker rats spontaneously develop proteinuria and focal segmental glomerulosclerosis as they grow older, ultimately leading to renal failure( Reference Zucker 15 , Reference Coimbra, Janssen and Grone 16 ), and increased glomerular macrophage density can be observed in these rats already at an age of 4 weeks( Reference Lavaud, Michel and Sassy-Prigent 17 ). Proteinuria is developed at around 10 weeks age( Reference Stevenson, Wheeldon and Gades 14 ), and indications of decreased renal function are seen at around 12 weeks of age( Reference Laping, Olson and Day 18 , Reference Kasiske, O’Donnell and Keane 19 ). Dietary interventions using obese rat models that spontaneously develop renal disease, such as the obese Zucker fa/fa rat, are thus highly relevant to understanding the pathophysiology of obesity-associated morbidity in humans( Reference Stevenson, Wheeldon and Gades 14 , Reference Kasiske, Cleary and O’Donnell 20 ).
The American Heart Association and the Norwegian government recommend a fish intake of 300–450 g/week (two to three dinner meals per week) for the general public( Reference Kris-Etherton, Harris and Appel 21 , 22 ), and the daily average total protein intake for adults in the USA and in Norway is estimated to be 91–96 g( Reference Fulgoni 23 , 24 ). Thus, the fish intake following these recommendations corresponds to approximately 60–90 g of fish proteins weekly, amounting to 9–13 % of the total protein intake. Most publications on the effects of fish proteins in rat models have been studying the effects of dietary fish proteins as 100 % of the protein source( Reference Iritani, Narita and Fujita 25 – Reference Wergedahl, Liaset and Gudbrandsen 38 ). In the present study, fish protein was added to the feed in an amount closer to what is recommended for the human population, that is, 25 % of total protein content. We have recently shown that replacing 25 % of the casein in a regular American Institute of Nutrition (AIN)-93G diet( Reference Reeves, Nielsen and Fahey 39 ) with cod fillet protein resulted in lower postprandial glucose concentration when fed to obese Zucker fa/fa rats( Reference Drotningsvik, Mjos and Hogoy 40 ) and when taken as supplement cod protein reduced postprandial glucose in overweight and obese adults( Reference Vikoren, Nygard and Lied 41 ). In line with this, others also report on improved glucose regulation after cod protein intake in animal and clinical studies( Reference Lavigne, Marette and Jacques 28 , Reference Lavigne, Tremblay and Asselin 29 , Reference Ouellet, Marois and Weisnagel 42 ). A persistent high blood glucose concentration over time may damage the glomeruli and thus the capacity of the kidneys to filter the blood; therefore, further studies on the effects of fish proteins on kidney function are warranted. Little is known about the effects of fish proteins on markers of kidney function in this animal model of human obesity, but fat-free protein hydrolysates from herring and salmon by-products( Reference Drotningsvik, Pampanin and Slizyte 43 ) as well as salmon fillet( Reference Vikoren, Drotningsvik and Mwakimonga 44 ) beneficially affected markers of kidney function in obese Zucker fa/fa rats.
The aim of the present study was to investigate any effects of muscle proteins from a lean fish species, the Atlantic cod, on markers of kidney function and on the amino acid compositions in plasma and urine in obese Zucker rats in the early stage of decreased renal function. Cod protein was fed to rats in an amount corresponding to 25 % of the total protein in the diet, with the rest of the protein from a casein/whey mixture. The control group was feed a diet with a casein/whey mixture as the only protein source. We hypothesised that dietary cod protein would beneficially affect markers of kidney function, and that amino acid compositions in plasma and urine would reflect the content of amino acids in the cod protein diet and in the control diet that were fed to obese Zucker fa/fa rats.
Methods
Ethics
The institutional and national guidelines for the care and use of animals were followed. All experimental procedures involving animals were approved by the Norwegian State Board of Biological Experiments with Living Animals (approval no. 2012-4610) and were conducted in accordance with the Norwegian regulation on animal experimentation.
Animals
A total of twelve male Zucker fa/fa rats (HsdOla:Zucker-Lepr) were obtained from Harlan Laboratories, and randomly assigned to two experimental groups of six rats each with comparable mean body weight. Rats were housed in pairs in Makrolon IV cages (Ehret GmbH & Co.) with wood chips bedding and plastic housing, and were subjected to a 12 h light–12 h dark cycle (light from 07.00 to 19.00 hours), a constant temperature of 20–23°C, and relative humidity of 65±15 %. The rats were acclimatised under these conditions before the start of the experiment. The intervention period started when the rats were 9–10 weeks old and weighing 360 (sd 40) g.
Design
The experimental diets were based on AIN-93G recommendation for growing rats( Reference Reeves, Nielsen and Fahey 39 ) with addition of 1·6 g methionine/kg diet as recommended by Reeves( Reference Reeves 45 ) (Table 1). All diets contained 20 wt% proteins, and the control diet (CAS) contained a casein/whey mixture (90 % casein, 10 % whey; Armor Proteines) as the sole protein source. Fish powder made from cod fillet (Atlantic cod, Gadus morhua) (no. 0271, Seagarden AS) was added to the COD diet in an amount providing 25 wt% of total protein from cod, while casein/whey mixture constituted the remaining 75 wt% of protein. Casein/whey mixture and cod protein were not hydrolysed before use. All other feed ingredients were purchased from Dyets Inc. Table 1 provides an overview of the experimental diets. Energy and amino acids in the diets were analysed by Nofima BioLab. Creatine in fish the powder and casein/whey mixture was analysed using the Creatine Assay Kit (MAK079) from Sigma-Aldrich, following the manufacturer’s instruction for the colorimetric assay. Trimethylamine N-oxide (TMAO) was determined in the fish powder and the casein/whey mixture by the Conway microdiffusion assay( Reference Conway and Byrne 46 ) (Nofima BioLab).
Table 1 Composition of the experimental diets (g/kg diet)
CAS, casein/whey; COD, cod protein; AIN, American Institute of Nutrition.
* Contains 90 % crude protein.
† Contains 88 % crude protein.
‡ Contains 41·1 % choline.
§ Contains vitamin B12 (40 mg/kg) and vitamin K1 (25 mg/kg) mixed with sucrose (995 g/kg) and dextrose (5 g/kg).
Feed was given as a powder, and rats always had access to wood chewing sticks. Newly thawed feed was provided every day except Sundays (double doses on Saturdays), and rats had free access to tap water and feed (ad libitum). The intervention period was 4 weeks, and rats were weighed every 7th day during the intervention period.
Rats were housed in Makrolon IV with grids for 24 h on the 18th day of the intervention period, without fasting in advance, for collection of urine and measurement of feed and water intake. Feed and water intakes were registered by weighing.
At the end of the feeding period (i.e. after 4 weeks intervention), under fasting conditions for 12 h with free access to tap water, the rats were euthanised while under anaesthesia with isoflurane (Isoba vet, Intervet; Schering-Plough Animal Health) mixed with nitrous oxide and oxygen. Blood was drawn directly from the heart and was collected in Vacuette Z Serum Clot Activator tubes (Greiner Bio-One) for isolation of serum and in Vacuette K2EDTA tubes (Greiner Bio-One) for isolation of plasma.
Staff handling the rats and conducting the analyses were blinded, and rats were handled and euthanised in random order.
In vitro inhibition of angiotensin-converting enzyme
To the casein/whey mixture and cod protein was added Trizma buffer (50 mm, pH 8·0). The casein/whey mixture and cod protein were hydrolysed using trypsin from bovine pancreas (T1426 from Sigma) at 45°C for 4 h as recommended by Shalaby et al.( Reference Shalaby, Zakora and Otte 47 ). Angiotensin-converting enzyme (ACE) inhibition by protein hydrolysate was measured as described by Shalaby et al.( Reference Shalaby, Zakora and Otte 47 ), using ACE from rabbit lung (A6778-.25UN from Sigma) and 0·88 mm furanacroloyl-Phe-Glu-Glu (F7131 from Sigma) as substrate (dissolved in Trizma buffer; 50 mm, pH 7·5 with 0·3 m NaCl, all ingredients from Sigma). Immediately before reading, 10 µl ACE, 10 µl protein hydrolysate and 150 µl substrate were added to ninety-six-well polystyrene microtitre plates (Corning®, CoStar®), and plates were read at 340 nm every 30th second for 30 min at SpectraMax Plus384 (Molecular Devices) at 37°C. Protein in hydrolysates were quantified on the Cobas c111 system (Roche Diagnostics GmbH) using the TP2 kit from Roche Diagnostics GmbH.
Analyses in serum, plasma and urine
Serum concentrations of creatinine, total protein and carbamide and urine concentrations of creatinine, total protein, carbamide and uric acid were analysed by accredited methods at the Laboratory of Clinical Biochemistry at Haukeland University Hospital. Plasma concentration of ammonium, serum concentration of uric acid and urine concentrations of ammonium and creatinine were analysed using the Cobas c111 system using the appropriate kits from Roche Diagnostics GmbH.
Plasma and urine concentrations of cystatin C and T cell immunoglobulin mucin-1 (TIM-1) were quantified using the mouse/rat Cystatin C Quantikine® ELISA (catalogue no. MSCTC0) and the Rat TIM-1/KIM-1/HAVCR Quantikine® ELISA (catalogue no. RKM100) from R&D Systems, Bio-Techne. Serum vitamin D was measured by ELISA, using the 25-OH vitamin D total (Rat) kit (EIA-5532; DRG Instruments GmbH).
Amino acids, selected metabolites of amino acids and potential markers of fish intake were measured in plasma/serum and urine by Bevital AS (http://www.bevital.no) using GC and liquid chromatography (LC) with tandem mass spectrometry (GC–MS/MS and LC–MS/MS) as previously described( Reference Midttun, Kvalheim and Ueland 48 , Reference Midttun, McCann and Aarseth 49 ). We analysed 3-hydroxyisobyturate (3-HIB)( Reference Midttun, McCann and Aarseth 49 ), TMAO, 1-methylhistidine (1-MeHis, π-methyl-histidine) and 3-methylhistidine (3-MeHis, τ-methyl-histidine)( Reference Midttun, Kvalheim and Ueland 48 ) by adding the analytes and isotope labelled internal standards to existing assays. Arginine, α-ketoglutaric acid and 3-HIB were measured in plasma but could not be quantified in urine, otherwise the same compounds were analysed in plasma and urine. Sarcosine was measured in serum and urine. Thiamine, riboflavin, nicotinamide, pyridoxal 5′-phosphate, and isoforms and metabolites of these vitamins as well as tryptophan metabolites in the kynurenine pathway, were analysed in plasma by Bevital AS( Reference Midttun, McCann and Aarseth 49 , Reference Midttun, Hustad and Ueland 50 ). Thiamine, thiamine monophosphate, nicotinic acid, nicotinamide and N1-nicotinamide with isotope labelled internal standards were added to the previously published assay( Reference Midttun, Hustad and Ueland 50 ).
Analyses of T cell immunoglobulin mucin-1 in kidney homogenate
Kidneys were homogenised in TRIS-buffer (pH 7·8). TIM-1 in kidney homogenate was measured with the Rat TIM-1/KIM-1/HAVCR Quantikine® ELISA kit. Kidney protein content was measured with the Bradford dye-binding method( Reference Bradford 51 ) using Protein Assay Dye Reagent (Bio-Rad Laboratories) with bovine serum albumin (Bio-Rad Protein Assay Standard II, Bio-Rad Laboratories) as standard.
Sample size
This study was designed to investigate the effects of a diet containing cod protein on glucose regulation, lipid metabolism and growth. Based on our previous findings that cod protein seems to improve postprandial glucose regulation and growth( Reference Drotningsvik, Mjos and Hogoy 40 ), and the knowledge that obese Zucker fa/fa rats spontaneously develop kidney failure( Reference Zucker 15 , Reference Coimbra, Janssen and Grone 16 ), the primary outcome of the present study was to investigate whether these cod protein fed Zucker fa/fa rats had a better kidney function and better utilisation of dietary protein when compared with rats fed a control diet. Instead of conducting a new rat experiment, and in line with The Three Rs of animal experiments (reduction, refinement and replacement), we chose to do more analyses using the biological samples from the same experiment. Therefore, no power analysis has been conducted for the present study.
Statistical analysis
Data were tested for normality using the Shapiro–Wilk test, and since most data were normally distributed they were evaluated by unpaired Student’s t test and the cut-off level for statistical significance was set to 0·05. CAS-fed rats served as controls. Data are presented as means with standard deviations for six rats per group for all serum/plasma analyses. One urine sample from a rat in the CAS group fell on the floor after collection and was discarded; therefore, only five urine samples from the CAS group were analysed whereas six urine samples from the COD group were analysed. Patterns in biomarker concentrations were investigated separately in urine and plasma by performing principal component analysis (PCA) on matrixes containing centred and standardised biomarker concentrations. Statistical analyses were performed using SPSS version 25 for Windows; SPSS Inc., and R version 3.2.3 (http://www.r-project.org) with the prcomp package.
Results
Diets, growth and energy intake
The contents of the indispensable amino acids histidine, isoleucine, leucine, threonine, tryptophan, phenylalanine and valine were comparable in the CAS and COD diets (i.e. <1 g/kg diet difference), whereas lysine, methionine and the conditionally essential amino acid arginine( Reference McCoy 52 ) were found in higher concentrations in the COD diet (Table 2). Some differences were also seen between the two diets for the non-essential amino acids; the COD diet contained higher concentrations of aspartic acid+asparagine, glycine and alanine and lower concentrations of glutamic acid+glutamine and proline when compared with the CAS diet. The COD diet contained 0·25 g EPA and 0·62 g DHA per kg, whereas long-chain n-3 PUFA were not found in the CAS diet( Reference Drotningsvik, Mjos and Hogoy 40 ).
Table 2 Amino acids in diets (g/kg diet)Footnote *
CAS, casein/whey; COD, cod protein.
* Means of two measurements; deviations were <5 % between parallels.
Creatine and TMAO were found in cod protein powder (12·5 µg creatine and 5·4 µg TMAO per mg protein) but not in the casein/whey mixture. The COD protein had a stronger ACE-inhibiting capacity when compared with the CAS protein (IC50 was 165 and 253 µg/ml for COD and CAS proteins, respectively, mean of three measurements with CV <5 %).
Body weight at baseline was similar in both groups (Fig. 1). COD-fed rats had gained significantly more weight after 3 and 4 weeks of intervention (P values of 0·018 and 0·016, respectively) and tended to have higher body weight already 2 weeks into the intervention period (P=0·067) when compared with CAS-fed rats. When comparing the weight development curves over the 4 week intervention period, the growth was significantly larger in COD-fed rats when compared with CAS-fed rats (slope 41·4 (sd 3·4) and 35·5 (sd 4·1) g/week, respectively, P=0·022).
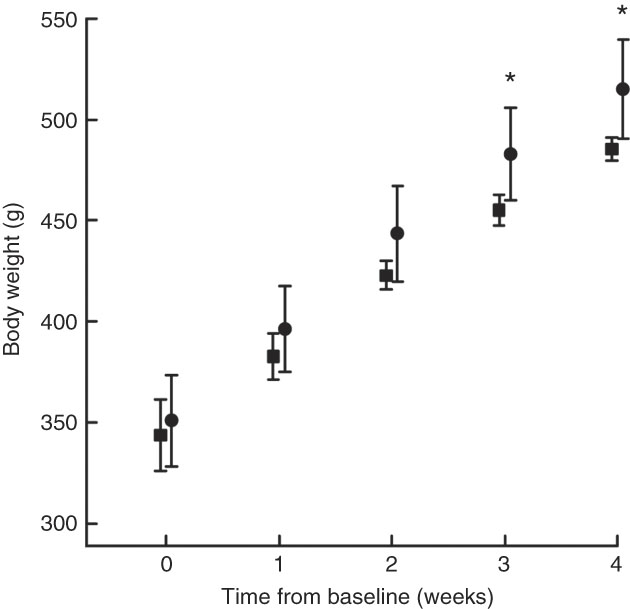
Fig. 1 Body weight measured at baseline (week 0), and after 1, 2, 3 and 4 weeks of intervention for rats fed a control diet (casein/whey; CAS; ![]() ) or cod diet (COD;
) or cod diet (COD; ![]() ). Values are means (n 6 in CAS group and n 6 in COD group), with standard deviations represented by vertical bars. * Mean value was significantly different from that of the CAS group (P<0·05, evaluated by independent-samples t test assuming equal variances).
). Values are means (n 6 in CAS group and n 6 in COD group), with standard deviations represented by vertical bars. * Mean value was significantly different from that of the CAS group (P<0·05, evaluated by independent-samples t test assuming equal variances).
The intakes of energy (1280 (sd 74) and 1270 (sd 77) kJ/kg body weight per 24 h, respectively, P=0·82) and total amino acids (14·9 (sd 0·9) and 15·0(sd 0·9) g/kg body weight per 24 h, respectively, P=0·91) were similar between rats fed the CAS and COD diets. Water intake was similar between the groups, as previously published( Reference Drotningsvik, Mjos and Hogoy 40 ). The weights of kidneys, white adipose tissues and thigh skeletal muscle (all relative to body weight) and body weight-to-square body length were similar between the groups( Reference Drotningsvik, Mjos and Hogoy 40 ). These observations indicate that rats fed the CAS or COD diets had similar body composition and that the higher body weight in COD-fed rats was not a result of higher adiposity.
Analyses in urine and kidneys
Urine concentrations (adjusted for creatinine concentration) of cystatin C and TIM-1 (Fig. 2(a) and (b)) and total sum of amino acids, carbamide, uric acid and ammonium (Table 3) were significantly lower in COD-fed rats when compared with the CAS group, whereas no difference was seen between groups for concentration of urinary protein. In addition, we found a significantly lower amount of TIM-1 in kidneys from COD-fed rats when compared with CAS-fed rats (12 (sd 11) and 6 (sd 1) pg TIM-1 per mg protein, respectively, P=0·045).
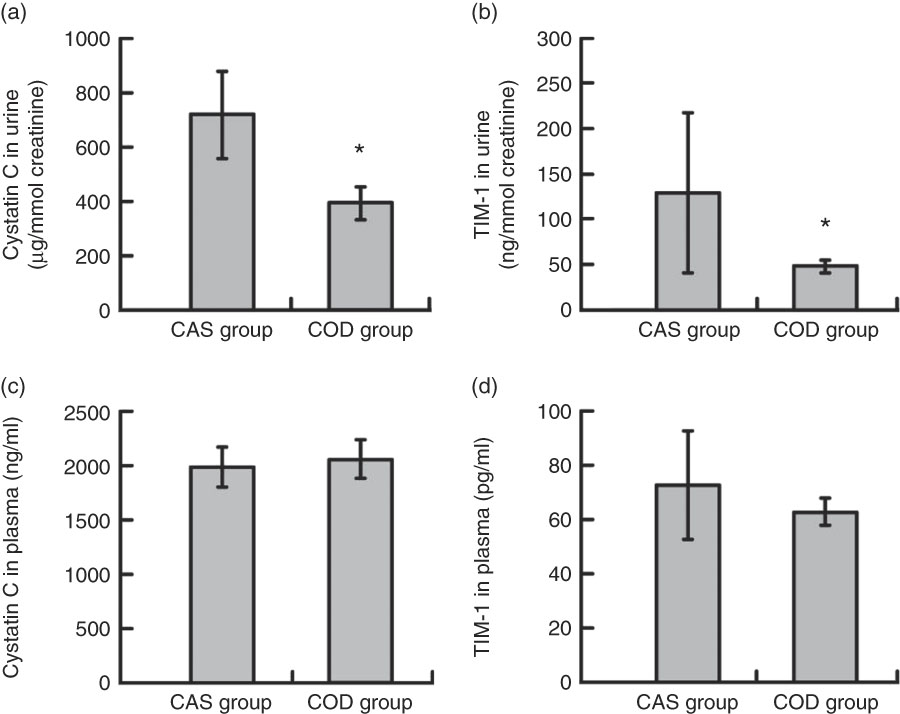
Fig. 2 Cystatin C (a) and T cell immunoglobulin mucin-1 (TIM-1) (b) in urine, and cystatin C (c) and TIM-1 (d) in plasma. Values are means, with standard deviations represented by vertical bars. Plasma values are shown for n 6 rats in the control diet (casein/whey; CAS) group and n 6 rats in the cod diet (COD) group. Urine values are shown for n 5 rats in the CAS group and n 6 rats in the COD group. * Mean value in the COD group was significantly different from that of the CAS group (P<0·05; evaluated by independent-samples t test assuming equal variances).
Table 3 Nitrogen-containing compounds measured in urine* (Mean values and standard deviations)
CAS, casein/whey; COD, cod protein.
* n 5 rats in the CAS group and n 6 rats in the COD group. P<0·05 was considered significant. Groups are compared using independent-samples t test assuming equal variances.
Using PCA for combined analysis of all analytes measured in urine (concentrations relative to creatinine concentration), the first two principal components (PC) explained 80·3% (65·2 and 15·1%, respectively) of the variation in the dataset, with a clear separation of the CAS and COD groups (Fig. 3(a) and (b)). Compared with the CAS group, urine from COD-fed rats was characterised by high relative concentrations of creatine, TMAO, 1-MeHis and 3-MeHis, which originates from the cod protein, and lower concentrations of all amino acids and metabolites thereof. For more details on concentrations of the individual compounds in urine, see Table 4.
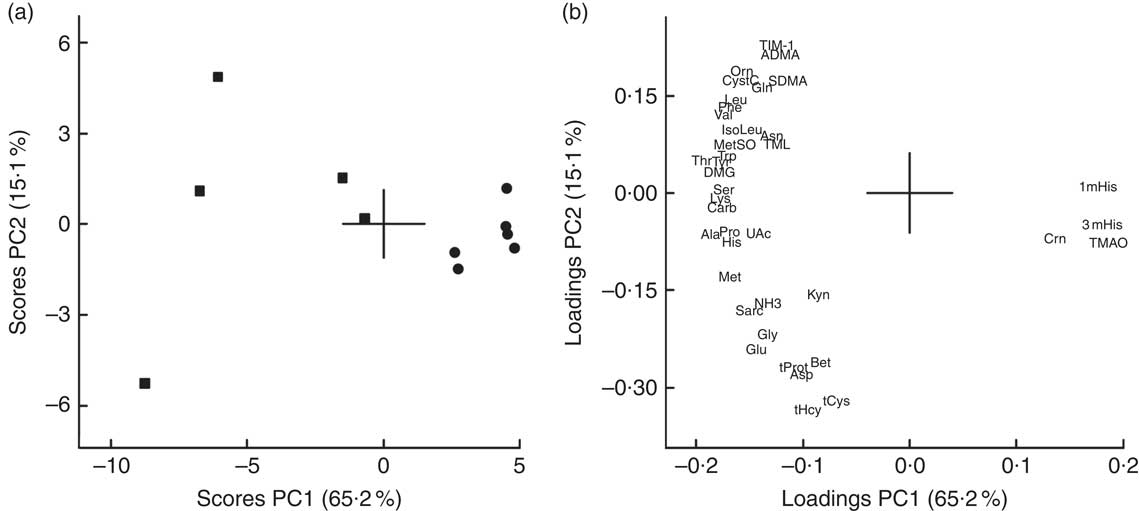
Fig. 3 Scores (a) and loadings (b) from the first two principal components (PC1 and PC2) obtained from principal component analysis using centred and standardised biomarker concentrations (relative to creatinine) in urine. Values are means shown for n 5 in the control diet (casein/whey; CAS) group and n 6 in the cod diet (COD) group. The score plot (a) shows the rat groups by feed (![]() =CAS and
=CAS and ![]() =COD), while the loading plot (b) shows the biomarkers. ADMA, asymmetric dimethylarginine; Ala, alanine; Asn, asparagine; Asp, aspartic acid; Bet, betaine; Carb, carbamide; Crn, creatine; CystC, cystatin C; DMG, dimethylglycine; Gln, glutathione; Glu, glutamine; Gly, glycine; His, histidine; IsoLeu, isoleucine; TIM-1, T-cell immunoglobulin mucin-1; Kyn, kynurenine; Leu, leucine; Lys, lysine; 1mHis, 1-methylhistidine; 3mHis, 3-methylhistidine; Met, methionine; MetSO, methionine sulfoxide; NH3, ammonium; Orn, ornithine; PC, principal component; Phe, phenylalanine; Pro, proline; Sarc, sarcosine; SDMA, symmetric dimethylarginine; Ser, serine; tCys, total cysteine; tHcy, total homocysteine; Thr, threonine; TMAO, trimethylamine N-oxide; TML, trimethyllysine; tProt, total protein; Trp, tryptophan; Tyr, tyrosine; UAc, uric acid; Val, valine.
=COD), while the loading plot (b) shows the biomarkers. ADMA, asymmetric dimethylarginine; Ala, alanine; Asn, asparagine; Asp, aspartic acid; Bet, betaine; Carb, carbamide; Crn, creatine; CystC, cystatin C; DMG, dimethylglycine; Gln, glutathione; Glu, glutamine; Gly, glycine; His, histidine; IsoLeu, isoleucine; TIM-1, T-cell immunoglobulin mucin-1; Kyn, kynurenine; Leu, leucine; Lys, lysine; 1mHis, 1-methylhistidine; 3mHis, 3-methylhistidine; Met, methionine; MetSO, methionine sulfoxide; NH3, ammonium; Orn, ornithine; PC, principal component; Phe, phenylalanine; Pro, proline; Sarc, sarcosine; SDMA, symmetric dimethylarginine; Ser, serine; tCys, total cysteine; tHcy, total homocysteine; Thr, threonine; TMAO, trimethylamine N-oxide; TML, trimethyllysine; tProt, total protein; Trp, tryptophan; Tyr, tyrosine; UAc, uric acid; Val, valine.
Table 4 Amino acids and metabolites thereof and potential markers of fish protein intake*(Mean values and standard deviations)
CAS, casein/whey; COD, cod protein; ND, not determined.
* Plasma values are shown for n 6 rats in the CAS group and n 6 rats in the COD group. Urine values are shown for n 5 rats in the CAS group and n 6 rats in the COD group. P<0·05 was considered significant. Groups are compared using independent-samples t test assuming equal variances.
† The biochemical assays do not allow for quantifications of arginine, α-ketoglutaric acid and 3-hydroxyisobutyrate in urine.
‡ Sarcosine was measured in serum.
Analyses in serum and plasma
Circulating concentrations of cystatin C and TIM-1 (Fig. 2(c) and (d)) and of creatinine, total protein, the total amount of amino acids, carbamide and ammonium (Table 5) were similar in the CAS and COD groups. PCA of circulating metabolites showed that PC1 and PC2 explained only 26·9 and 16·6%, respectively, of the variance in the dataset when all analytes measured in serum and plasma are included, with no clear separation between the dietary groups (data not presented). Table 4 shows the concentrations of amino acids and metabolites thereof demonstrating significantly lower concentrations of glycine, aspartic acid and sarcosine and significantly higher concentrations of arginine, creatine, 1-MeHis and 3-MeHis in the COD group compared with the CAS group. Groups were similar with regard to circulating concentrations of micronutrients and tryptophan with metabolites (online Supplementary Table S1), and PCA of micronutrients and tryptophan metabolites showed no clear separation between the CAS and COD groups (PC1; 32·0, PC2; 19·9, data not presented).
Table 5 Circulating analytes that are relevant to kidney function*(Mean values and standard deviations)
CAS, casein/whey; COD, cod protein.
* n 6 rats in the CAS group and n 6 rats in the COD group. P<0·05 was considered significant. Groups are compared using independent-samples t test assuming equal variances.
Discussion
Obesity increases the risk of developing renal disease in humans and rats( 4 – Reference Ting, Nair and Ching 7 , Reference Stevenson, Wheeldon and Gades 14 ), whereas consumption of proteins from fish is associated with lower prevalence of kidney disease( Reference Gopinath, Harris and Flood 11 , Reference Mollsten, Dahlquist and Stattin 12 ). In the present study, we show for the first time that diets that are different only with regard to source of protein have very different effects on growth as well as on urine concentrations of cystatin C and TIM-1 (established markers of kidney function), amount of TIM-1 in kidney and urinary excretion of amino acids when fed to obese Zucker fa/fa rats that spontaneously develop renal disease( Reference Stevenson, Wheeldon and Gades 14 , Reference Kasiske, Cleary and O’Donnell 20 ). Findings in the present study indicate that cod protein may have the potential to delay the development of kidney damage in obese Zucker rats and to improve protein utilisation.
The presence of proteins and amino acids in urine are among the earliest sign of almost all renal diseases in both humans and animals( Reference Gross, de Azevedo and Silveiro 53 – Reference Macpherson, Moscarello and Goldberg 55 ). The obese Zucker fa/fa rat was chosen as a model in the present study since this rat develops proteinuria already at around 10 weeks age( Reference Stevenson, Wheeldon and Gades 14 ), that is, at the same age as the rats in the present study at start of intervention. Protein was found in urine from both COD- and CAS-fed rats, with no difference between the groups, suggesting that renal dysfunction was evident in both groups. The urine cystatin C concentration is a specific marker of tubular dysfunction( Reference Conti, Moutereau and Zater 56 ) and is strongly associated with renal dysfunction in patients with obesity( Reference Satoh-Asahara, Suganami and Majima 57 ). Urine cystatin C concentration has also been shown to be a good marker of renal damage in diabetic Zucker fa/fa rats( Reference Togashi and Miyamoto 58 ). TIM-1 has emerged as a useful early indicator of tubular injury as TIM-1 is not detectable in normal kidney tissue or urine but is expressed on the proximal tubule apical membrane in response to renal injury leading to rapid increase in urine concentration( Reference Han, Waikar and Johnson 59 , Reference van Timmeren, van den Heuvel and Bailly 60 ), even before morphological changes are detected( Reference Chiusolo, Defazio and Zanetti 61 ). TIM-1 was found in detectable concentrations in urine and kidneys from both CAS- and COD-fed rats (aged 13–14 weeks at euthanasia) in the present study, suggesting that both intervention groups experienced kidney injury, which was expected since decreased renal function is seen in obese Zucker fa/fa rats at around 12 weeks age( Reference Laping, Olson and Day 18 , Reference Kasiske, O’Donnell and Keane 19 ). Since the urine concentrations of both cystatin C and TIM-1 as well as the amount of TIM-1 in kidneys were significantly lower in the COD group compared with in the CAS group, this could suggest that the COD diet may have offered some protection against the development of kidney injury in the present study.
A commonly used marker of kidney function is serum creatinine, which is produced at a relatively constant rate mainly depending on the muscle mass, muscle function, diet and health status( Reference Stevens, Coresh and Greene 62 ). Serum creatinine concentration may remain normal until about 50 % of kidney function is lost( Reference Stevens, Coresh and Greene 62 ), with a lag time between the injury and a rise in serum concentration( Reference Han, Waikar and Johnson 59 ). Therefore, serum creatinine is no longer regarded as a sensitive marker of kidney function( Reference Star 63 ), and more sensitive markers of renal tubular injury are warranted to discover early stages of kidney injury, as the kidney is most amendable to treatment in the early stages of the disease. Serum cystatin C is considered to be a better marker than serum creatinine for early detection of reduced renal function( Reference Pucci, Triscornia and Lucchesi 64 ); however, no differences were seen between the CAS and COD groups for circulating concentrations of creatinine and cystatin C.
Rats fed the COD diet grew significantly more during the 4-week intervention period when compared with CAS-fed rats, with similar body weight-to-square body length as well as weights of white adipose tissues and thigh skeletal muscle relative to body weight between the groups( Reference Drotningsvik, Mjos and Hogoy 40 ). Lack of vitamins could impede growth in young rats, and therefore, we measured plasma concentrations of fat soluble vitamins, B vitamins and metabolites of these, but no differences were seen between the groups for any of these micronutrients. Under normal conditions, amino acids can be metabolised, degraded to carbamide or they can become building blocks in proteins. Typically, the N excreted in urine is mainly in the form of carbamide and ammonia, with <1 % of renal N in the form of other compounds such as uric acid, proteins, amino acids, nitric oxide metabolites and nitrates, and the carbamide production normally reflects the protein intake. Here, we found that the urinary excretions (relative to creatinine concentration) of the small N-containing compounds carbamide, uric acid, ammonium and the majority of free amino acids were significantly lower in COD-fed rats when compared with CAS-fed rats, whereas no difference was seen between groups for urinary total protein concentration. Circulating concentrations of creatinine, total protein, carbamide, ammonium and free amino acids were, however, not different between the groups. These findings, especially regarding the lower urinary excretion of N-containing compounds in relation to better growth in COD-fed rats concomitant with similar intakes of energy and proteins from diets in the CAS and COD groups, indicate that cod protein is better utilised for growth when compared with the casein/whey mixture used in the CAS diet.
Differences in amino acid compositions in the CAS and COD diets were, in general, not reflected in the plasma concentrations of amino acids in rats fed these diets. The COD diet contained more lysine, methionine, arginine, aspartic acid+asparagine, glycine and alanine and less glutamic acid+glutamine and proline when compared with the CAS diet. The higher arginine and lower aspartic acid concentrations in plasma from COD-fed rats may be a reflection of the dietary concentrations of these amino acids, whereas the lower plasma glycine in the COD group was not expected as the glycine concentration was higher in the COD diet when compared with the CAS diet.
Most of the amino acids that are filtered by the glomeruli will normally be reabsorbed by the tubules and are not excreted in urine( Reference Garibotto, Sofia and Saffioti 65 , Reference Woolf and Giles 66 ). Aminoaciduria occurs before proteinuria as kidney dysfunction develops and is an early index of renal tubular damage with reduced tubular reabsorption of amino acids( Reference Betts and Green 54 , Reference Macpherson, Moscarello and Goldberg 55 ). Also, 1-MeHis, 3-MeHis, creatine and TMAO are small molecules that are cleared from plasma by the kidneys and excreted in urine. Anserine, which is found in cod and rat skeletal muscle but not in cows’ milk( Reference van Waarde 67 – Reference Forde-Skjaervik, Skjaervik and Morkore 70 ), is degraded to 1-MeHis, whereas 3-MeHis is released on breakdown of actin and myosin. Therefore, 1-MeHis and 3-MeHis found in rats’ plasma and urine may originate from either dietary intake or proteolysis of the rats’ own muscles. These methylhistidines are not reutilised for protein synthesis or metabolised and are, therefore, excreted in the urine and have been proposed to be useful as biomarkers of meat intake( Reference Altorf-van der Kuil, Brink and Boetje 71 ). In line with this, COD-fed rats were characterised by higher concentrations of both 1-MeHis and 3-MeHis in plasma and urine compared with CAS-fed rats, probably as a result of higher fish protein intake and not as a consequence of muscle protein degradation. Creatine and TMAO (or its precursor trimethylamine) can be obtained from the diet or produced in the body. Cod is a good source of both creatine( Reference Clark 72 ) and TMAO( Reference van Waarde 67 , Reference Cho, Taesuwan and Malysheva 73 ), whereas cows’ milk proteins contain little of these compounds. High creatine intake is reflected in high serum concentrations and increased urine excretion of creatine but does not seem to affect established markers of kidney disease in rodents( Reference Taes, Delanghe and Wuyts 74 , Reference Ellery, LaRosa and Kett 75 ). The results from PCA showed that COD-fed rats, in general, had lower urine concentrations of all amino acids and related compounds, but higher 1-MeHis, 3-MeHis, creatine and TMAO when compared with CAS-fed rats, that is, no direct correlation was seen between intake and urinary excretion of amino acids. The observed associations between the intake of COD and urine concentrations of 1-MeHis, 3-MeHis, creatine and TMAO suggest that these compounds should be further investigated as markers of lean fish intake. Reduction of circulating TMAO has been suggested as a therapeutic treatment of renal disease, since circulating TMAO concentration is increased as kidney function decreases in patients with renal dysfunction, and the risk of developing renal disease is increased in persons with high plasma TMAO( Reference Zeisel and Warrier 76 ). However, some studies report no causal association of TMAO with morbidity or mortality from renal diseases( Reference Zeisel and Warrier 76 ). When glomerular filtration and plasma clearance of TMAO are reduced, TMAO will accumulate in the circulation. Cod fillet, unlike dairy products, contains high amounts of TMAO( Reference van Waarde 67 , Reference Cho, Taesuwan and Malysheva 73 ), but no difference was seen between rats fed the CAS and COD diets for plasma TMAO concentration, thus indicating that the glomerular filtration of TMAO was sufficient avoid accumulation in circulation in the latter group.
Patients with kidney disease are often treated with angiotensin-I-converting enzyme inhibitors to reduce blood pressure and protect kidneys( Reference Molitch, DeFronzo and Franz 77 – Reference Lewis, Hunsicker and Bain 79 ). ACE catalyses the conversion of angiotensin-I to the potent vasoconstrictor angiotensin-II, and ACE inhibitors; therefore, it plays an important role in the regulation of systemic blood pressure and protect kidney through the reduction of glomerular pressure by dilatation of the efferent arteriole and inhibition of the non-haemodynamic profibrotic effects of angiotensin II( Reference Anderson, Rennke and Brenner 80 , Reference Brewster and Perazella 81 ). Peptides with ACE-inhibiting properties in vitro have been identified in muscle, skin and frame from various fish species( Reference Ngo, Vo and Ngo 82 ). In the present study, we measured the ACE-inhibiting capacity of the proteins used in the diets, and we found that COD protein more efficiently inhibited ACE when compared with the CAS protein. Thus, COD may protect kidney tissue through inhibition of ACE.
This study has some strengths and limitations. Strengths include the measurement of many biomarkers related to renal function, in both urine and serum/plasma. By measuring circulating micronutrient concentrations, we also demonstrated that better growth in the COD group was not due to a better micronutrient status. This study was originally designed to investigate the effects of cod protein intake on growth, lipid metabolism and glucose regulation in obese Zucker fa/fa rats( Reference Drotningsvik, Mjos and Hogoy 40 ). Therefore, a limitation to the present study is that we do not have histopathological data from the kidneys. However, the finding of lower urinary concentration of TIM-1 in COD-fed rats was supported by lower kidney concentration of TIM-1 in these rats when compared with CAS-fed rats.
In conclusion, in line with our hypothesis, cod protein feeding led to lower urine concentrations of cystatin C and TIM-1, which are established markers of tubular injury and lower urine concentrations of small N-containing compounds including amino acids. Contrary to our hypothesis, the amino acid compositions in plasma and urine did not reflect the content of amino acids in the cod protein diet and in the control diet. In addition, the lower TIM-1 concentration in kidneys from COD-fed rats supports the assumption that cod proteins may protect against tubular damage. Cod protein may, therefore, have the potential to delay the development of kidney damage in obese Zucker rats. The beneficial effects of the COD diet may be a result of improved glucose control as we have previously shown that these COD-fed rats had lower postprandial glucose concentration compared with CAS-fed rats( Reference Drotningsvik, Mjos and Hogoy 40 ) or through ACE-inhibitory effects of the cod protein. Also, the COD diet seems to improve protein utilisation and thus the growth of young rats. Obesity is associated with proteinuria and focal segmental glomerulosclerosis and increases the risk of developing renal disease in both humans and rats( 4 – Reference Ting, Nair and Ching 7 , Reference Stevenson, Wheeldon and Gades 14 ), and therefore, the findings of the present study may also be applicable to humans and merit further investigation.
Acknowledgements
This work was supported by the Bergen Medical Research Foundation and the Regional Research Fund of Western Norway (project no. 212625). These sponsors were not involved in the design of the study, data collection, analysis and interpretation of data, writing of the article or in the decision to submit the article for publication.
I. H. and O. A. G. formulated the research question and designed the study. A. D. and O. A. G. conducted the animal study. A. D., Ø. M., A. M., P. M. U. and O. A. G. analysed the data and performed statistical analyses. O. A. G. drafted the manuscript and had primary responsibility for the final content. All authors have contributed to the writing and approved the final manuscript.
I. H. is CEO and Chairman of Blue Protein, a company that commercialises new products based on fish proteins from fish rest raw materials. Blue Protein was not involved in on-site data collection or analyses and interpretation of the data. I. H. is a minor shareholder in Seagarden AS. The other authors declared no conflicts of interest.
Supplementary material
For supplementary material/s referred to in this article, please visit https://doi.org/10.1017/S0007114518002076


