


Exposure to large portion sizes has been linked with increased intake in both children and adults, and across a variety of foods and settings( Reference Hollands, Shemilt and Marteau 1 – Reference Ledickwe, Ello-Martin and Rolls 3 ). The widespread availability of large portion sizes means that individuals need to invoke personal coping strategies to avoid overeating. Portion control has been recognised as an important behavioural element for weight management( Reference Rolls 4 ), and reducing portion sizes at specific meals has been shown to reduce daily energy intakes( Reference Lewis, Ahern and Solis-Trapala 5 , Reference Hannum, Carson and Evans 6 ). Despite this evidence, very little is known on how to support people to eat smaller portions. Educating people on the health effects of large portions( Reference Cavanagh, Vartanian and Herman 7 ) or using portion size information on food labels( Reference Spanos, Kenda and Vartanian 8 ) has only limited effect. This may be because large portions have become an automatic behaviour in some individuals( Reference Hollands, Shemilt and Marteau 1 ) facilitated by cultural norms (i.e. larger portions are ‘the normal’)( Reference Harnack, Steffen and Arnett 9 ) and price incentives to consume more food( Reference Condrasky, Ledikwe and Flood 10 ).
Judging an appropriate portion can be difficult, especially for foods lacking a defined shape and which tend to take the form of their container, such as rice, pasta and potato-based foods( Reference Slawson and Eck 11 ). A number of commercial portion control tools are available, which claim to help control portion sizes by either limiting capacity (e.g. portion pots( 12 ) and guided tableware( 13 )) or by including visual prompts for appropriate amounts, such as calibration marks in tableware and serving utensils( 13 , 14 ). Such instruments could potentially provide a practical strategy for individuals to help control their intake( Reference Hollands, Shemilt and Marteau 1 , Reference Marteau, Hollands and Shemilt 15 ). The exact way in which portion control tools may work is still not known( Reference Kesman, Ebbert and Harris 16 , Reference Pedersen, Kang and Kline 17 ); however, recent research( Reference Hollands, Shemilt and Marteau 1 ) has confirmed that the shape, depth and capacity of the container( Reference Marchiori, Corneille and Klein 18 – Reference Raghubir and Krishna 21 ) or serving utensils( Reference Wansink, van Ittersum and Painter 22 ) may modulate the way we perceive a portion and how much we consume. Specific tools to guide portion size may also provide a visual reference point for the amount of food to be consumed( Reference Kesman, Ebbert and Harris 16 , Reference Pedersen, Kang and Kline 17 , Reference Versluis, Papies and Marchiori 23 , Reference Benton 24 ). Stimuli presented in a two or three-dimensional format may generate increased attention because of the impact that perceptual inputs have over other types of inputs when estimating food amounts( Reference Versluis, Papies and Marchiori 23 ).
Intervention studies with portion control tools have shown that such instruments may be a useful addition to weight management strategies( Reference Rolls 4 ), but they did not explore the acceptability or perceived effectiveness that will be crucial to longer-term adherence to these tools, especially when used at home, with minimal health professional contact. This study examined the perceived effectiveness and acceptability of two portion control tools to assist weight management efforts in a sample of overweight or obese people. We used a guided crockery set (CS) (plate, bowl and glass) and a set of calibrated serving spoons (SS) and asked participants to complete a quantitative and qualitative questionnaire while using the tools at home. The aim was to obtain information on which tool set may be most appropriate to apply in future interventions without any a priori hypothesis as to which tool would work better. Because of the novelty of the intervention, we hypothesised that the combined use of both tools over the course of the study may induce a small amount of weight loss from baseline. Here we report the results of the quantitative analysis.
Methods
The study was conducted in two phases from February to July 2013 (Phase 1) and November 2013 to August 2014 (Phase 2). In Phase 1, a representative sample of volunteers participating in a 12-week public weight loss programme (Weigh2Change) were asked to rank four commercially available portion control tools in order of preference using an anonymous poll. From this poll, the two tools ranking highest were selected for further investigation (Phase 2).
The study was conducted according to the guidelines laid down in the Declaration of Helsinki, and all procedures involving patients were approved by the West Midlands National Health Service (NHS) Health Research Authority ethical committee (reference no. 12/WM/0426). Written informed consent was obtained from all subjects, and those completing the study were offered the opportunity to keep one of the portion tool sets (at their choice) as a token of appreciation for their time.
Phase 1 methods
Adult volunteers were recruited from the Lifestyle and Weight Management Services (LWMS) at the Wirral Community NHS Foundation Trust in Birkenhead and surrounding area. This community is located within the Borough of Wirral and has one of the highest indexes of deprivation in England( 25 ). As this was an exploratory trial, we aimed for an initial convenience sample of at least sixty participants to investigate tool preference (based on contacting at least six groups of about ten patients each already attending group education sessions at the LWMS). To be eligible, participants had to have completed a minimum of 6 weeks in the Weigh2Change programme to ensure they were familiar with weight management strategies, including portion size education covered in week 2.
Participants were approached by one of the LWMS lifestyle advisors during individual or group consultations as part of their routine NHS visits, and were asked to take part in a ranking poll, after receiving a short demonstration of each tool’s use (Fig. 1). The portion control tools included an all-in-one portion pot( 26 ); a colour-coded measuring portion pot and measuring spoon set( 12 , 27 ); a set of plastic serving utensils( 14 ); and a set of crockery tableware with either a labelled or unlabelled plate( 13 ). The portions of the all-in-one portion pot range from 1 portion of dry, split lentils (approximately 1/4 cup or 50 g) to 1/3 portions of finely cut crunchy salad (approximately one cup or 75 g). The colour-coded spoons measure 1 or 1/2 tablespoon, and 1, 1/2 or 1/4 teaspoon. The colour-coded measuring pots measure in the range of 13 g (Special K cereal) to 250 g (mashed sweet potato). Portions for the serving SS and CS are described in Fig. 2. The lines in the CS differentiate portions in the dishes, and work as calibration marks in the bowl and glass. The unlabelled dish measures 10 in (25 cm) in diameter and is intended for users already familiar with portion control (e.g. trying to maintain weight). The labelled dish measures 9 in (23 cm) in diameter and is intended for users less familiar with portion control or actively attempting to lose weight( 13 ). The two plate sizes also accommodate higher (e.g. men) or lower (e.g. women) energy needs.
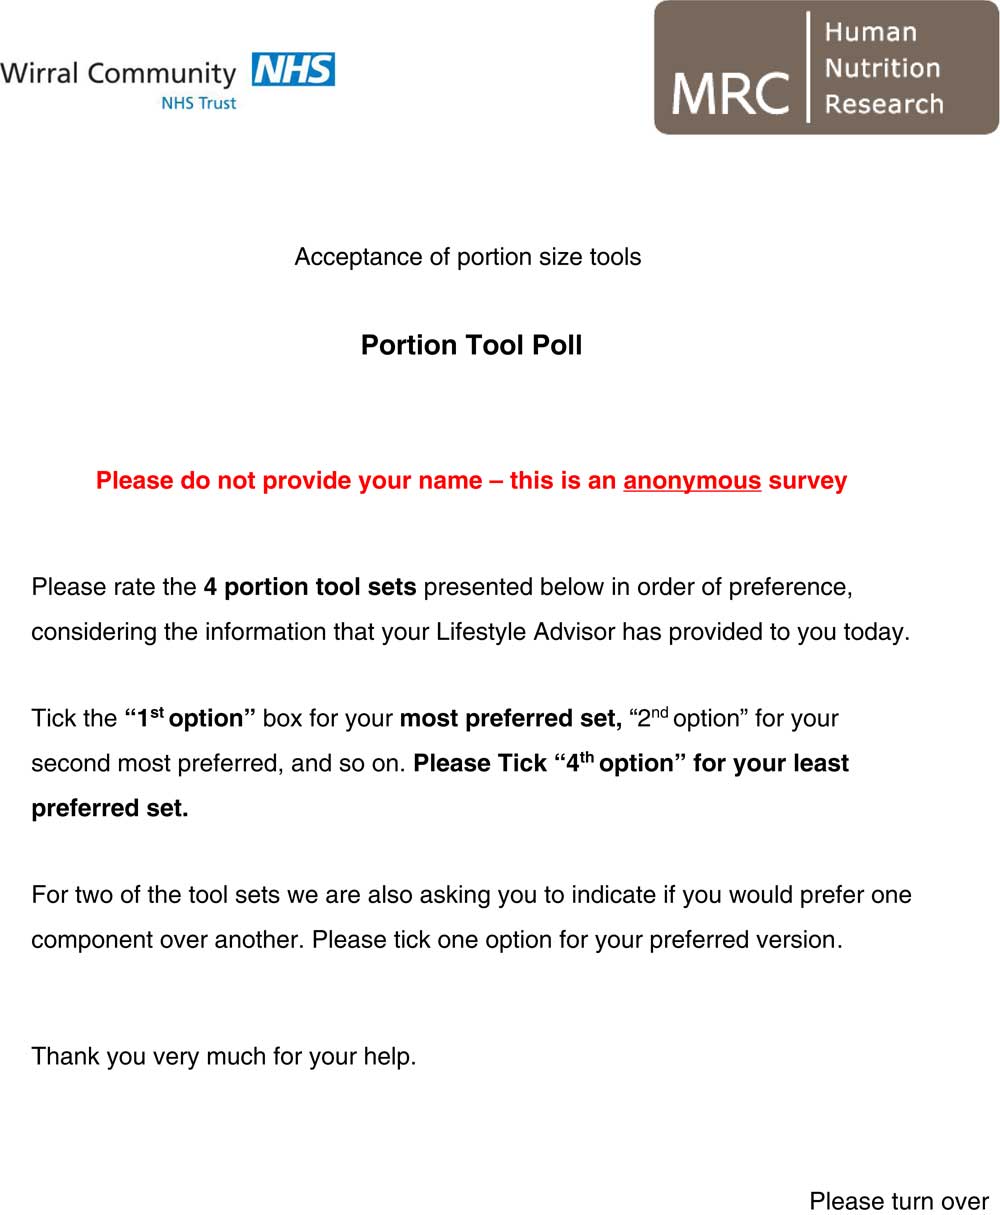
Fig. 1 Ranking poll used in Phase 1 of the study. For details of the portion size tools, see the ‘Phase 1 methods’ section.
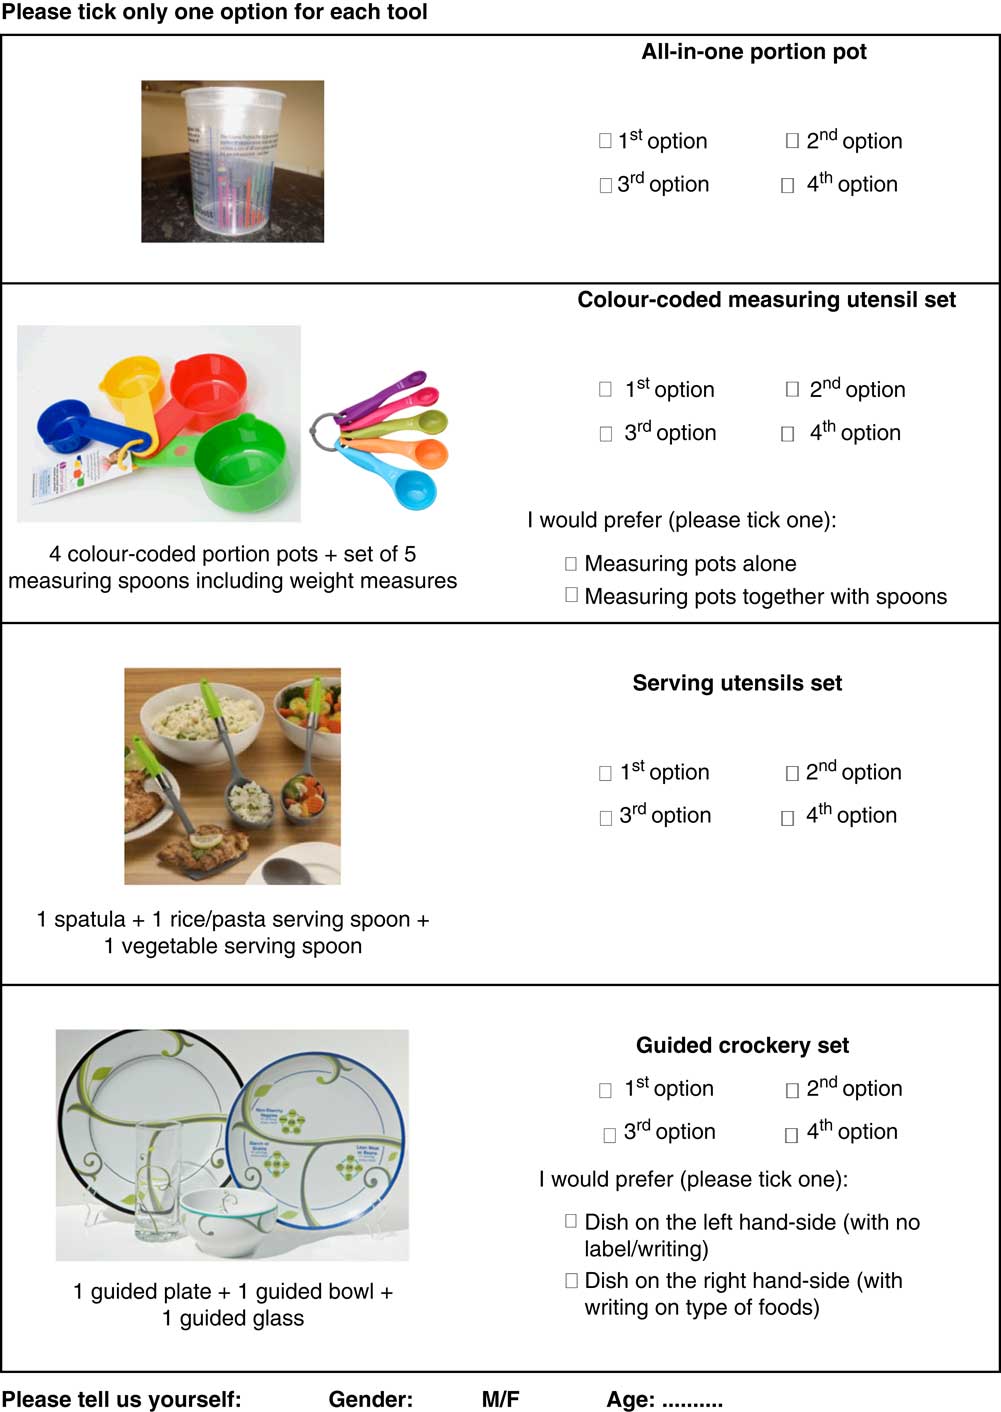
Fig. 1 (Continued from previous page) Ranking poll used in Phase 1 of the study. For details of the portion size tools, see the ‘Phase 1 methods’ section.
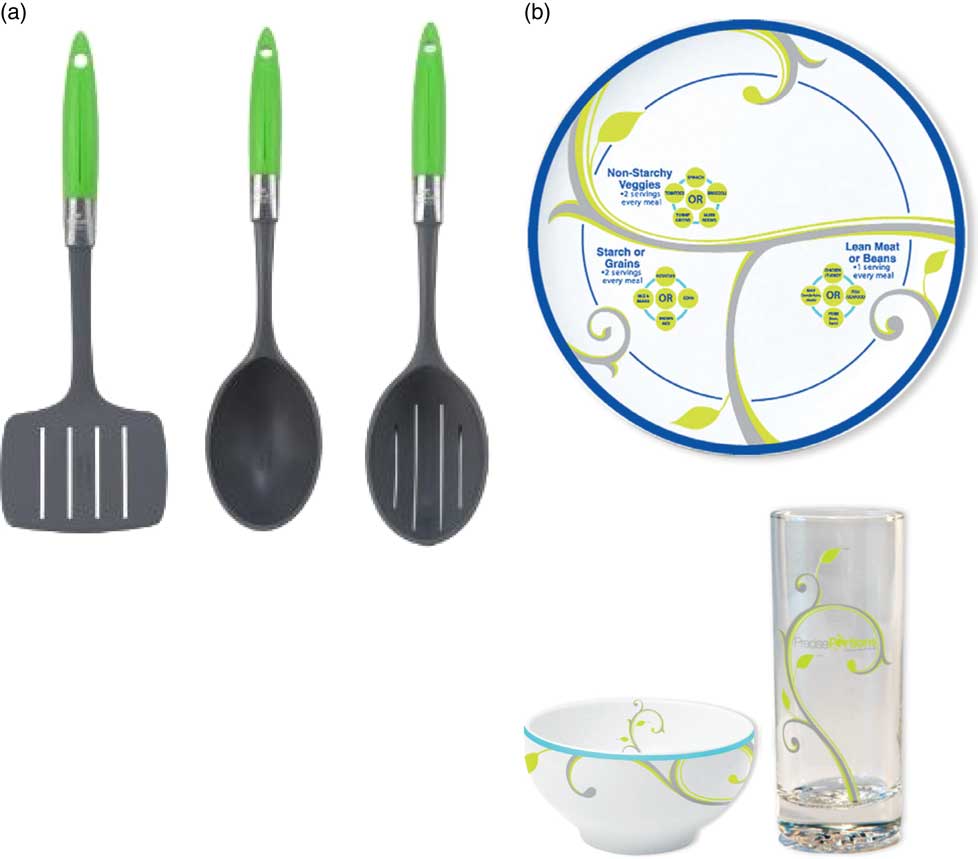
Fig. 2 Portion control tools used in Phase 2 of the study. The set of plastic serving utensils (a) included a serving spatula for 1 portion of protein (2.5 oz.), a serving spoon with capacity for 1 portion of starch (1/2 cup), and a slotted serving spoon for 1 portion of vegetables (1/2 cup cooked; 1 cup raw), based on United States Department of Agriculture standards (HealthySteps™ Portion Control Serving Set( 14 )). (b) The crockery set included a 9-inch (23 cm) plate decorated with leaves depicting three sectors and labels to indicate food types (non-starchy vegetables, protein and starch) in each sector; a crockery bowl with disguised marks for 1/2, 1, 1·5 cup; and a clear, tall glass with disguised marks for 4 and 8 oz. (Precise Portions Nutrition Control System( 13 )). For reference, 1 cup equals 25 g of cornflakes, 85 g of muesli, 75 g of shredded lettuce and 243 g of soup; 8 fluid oz. equals 237 ml of milk or 253 ml of juice; and 3 oz. of meat, fish or egg equals 85 g.
The tool sets for the poll were selected based on the results of a previous expert and literature consultation, which identified five key elements of portion control tools for efficacy: versatility across a range of foods; being culturally acceptable; ease of use; resistant to wear and tear; and corresponding with reference portion sizes (unpublished data).
Phase 2 methods
Adult volunteers were recruited from the LWMS at the Wirral Community NHS Foundation Trust in Birkenhead and surrounding area, as for Phase 1. The study population was overweight or obese, participating in a dietetic-led, community weight-loss programme and motivated to try new approaches to aid weight loss. To capture a range of different experiences with the tools, we aimed to include a total of thirty participants. To account for an expected drop-out rate of 50 % from start to end plus a further 20 % dropping between weeks 1 and 2, seventy-five volunteers were required for Phase 2. To avoid unnecessary use of resources, recruitment was stopped once the first thirty participants had completed the study.
Inclusion criteria included an initial BMI>35 kg/m2 (or a BMI>25 kg/m2 with co-morbidities such as heart disease or diabetes) and having recently completed at least 7 weeks of the Weigh2Change programme. Exclusion criteria included having taken part in Phase 1; being pregnant or lactating; and having been diagnosed with an eating disorder, mental illness or psychiatric disorder within the past 12 months that required active treatment.
Eligible participants were invited to try the two selected portion tools from Phase 1 at home for 2 weeks each and to answer a quantitative questionnaire containing embedded qualitative questions while they were using each of the tools. A weight measure was taken before and after completing the study (Fig. 3).
Fig. 3 Study design for Phase 2. TFEQ, Three-Factor Eating Questionnaire( Reference Stunkard and Messick 28 ).
Phase 2 procedures
Participants were approached by one of the LWMS lifestyle advisors during individual or group consultations as part of their routine NHS visits. Those interested in the study were provided with detailed information in writing and invited to attend an individual session (visit 1) at their local NHS venue during which their eligibility was confirmed and if appropriate they were enrolled. At this visit, participants were informed about the tools and how to use them, and provided with a copy of the study questionnaire, together with the first portion control tool set and instructions for use. Participants were asked to complete the questionnaire while using the tools at home, and to return the completed questionnaire and portion tools 2 weeks later (Fig. 3). During visit 1 participants also completed a baseline questionnaire asking about pregnancy, breast-feeding, diagnosed mental illness, eating disorder or psychiatric disorder, dieting status, past experience with portion tools and who they normally prepared meals for. Eligible participants completed in addition a self-reported ethnicity tick list and the Three-Factor Eating Questionnaire (TFEQ). This is a previously validated tool that allows classifying individuals based on their eating traits, as measured by three sub-scales: dietary restraint (R), disinhibition (D) and hunger (H)( Reference Stunkard and Messick 28 ). In our study, TFEQ scores for R, D and H were used to adjust for baseline differences in eating traits across participants in the statistical analysis.
During visit 2 participants met with the lifestyle advisor again to review their experience, returned the materials and received the second set of tools and instructions plus a second copy of the questionnaire, which they completed as for visit 1. This and the second tool set were returned 2 weeks later (visit 3). Participant’s compliance with the study protocol was monitored via a case report form that included a record of any dietary plans the participant was following.
Phase 2 questionnaire
Experiential data on tool use were collected by means of a paper-based semi-structured questionnaire addressing three target outcomes: the acceptability of the portion size tools, their ease of use and how effectively the participant perceived the tool to be for controlling portion sizes. The questionnaire was designed based on specific tool criteria previously identified from an expert consultation (see the ‘Phase 1 methods’ section) and was piloted amongst seven patients attending the LWMS whose feedback was incorporated in the final version. In addition to multiple-choice questions on frequency of tool use, type of meal on which the tool was used and self-reported changes in portion size of main food groups, the questionnaire also included a 100-mm visual analogue scale (VAS) for likelihood of anticipated adherence and five-point Likert scales on tool attributes (e.g. liking, fitting with lifestyle; ease of use; clear instructions; convenience, versatility and helping to meet dietary goals) (see online Supplementary Information Document S1).
Phase 2 portion tools
Phase 2 tools included the CS and the serving SS selected in Phase 1 with the exception that only the smaller, labelled dish in the CS was used (as chosen by Phase 1 participants) (Fig. 2). The serving SS and CS were both accompanied by a simple set of instructions based on the manufacturer’s information, including details of each tool-set component, correspondence to reference portion sizes, heat resistance information and cleaning instructions. Each participant was asked to use each of the two tools separately for a 2-week period, with the order of use assigned randomly and with minimal health professional contact. The total testing period was 4 weeks. Only one tool set was provided at a time and the two sets were never used in combination (Fig. 3).
Statistical analysis
The main aim of Phase 1 was to select the two most-preferred portion tools for use in Phase 2. The four possible ranking values (1–4; 1 being the most preferred choice) for each tool in the ranking poll were weighted by their observed frequency and summed to generate a single-weighted sum score, with possible values in the range of 66–264, and lower values indicating higher levels of preference.
The aim of Phase 2 was to compare the acceptability and pattern of use of the two most-preferred tools. Scores for acceptance, ease of use and perceived effectiveness were calculated from Question 4 of the main study questionnaire (online Supplementary Information Document S1). Acceptance was the average score to responses 4a, 4b, 4c and the reverse of 4d scores. Ease of use averaged questions 4e, 4f and 4g (4h was excluded because of a large number of incorrect answers), and perceived effectiveness was the average of questions 4i, 4j, 4k and 4l. A score between 0 and 2·5 was interpreted as ‘none to low’ level of the attribute; a score between 2·6 and 3·4 as ‘neutral’; and a score between 3·5 and 5 as ‘moderate to high’ level.
In addition, a binary score for each attribute was created by dichotomising each score with values >3·5, indicating high levels of the attribute. These were analysed using logistic regression models with a random intercept to account for the correlation between the two scores provided by an individual during the two time periods of the crossover design. For each attribute, the logistic regression model examined the OR of a high v. low level between the two tool types. The explanatory variables were an indicator of tool type, age, BMI and TFEQ scores. In addition, an indicator of order of tool type used and its interaction with tool type were included to account for potential carry-over effects. These may arise from the experience of having used the first allocated tool type in the 2 weeks before crossover.
Patterns of use (Questions 2, 3, 8) were described through means, percentages and frequency tables by tool type.
Mean VAS scores for likelihood for continued use and mean Likert scores for liking, fitting with kitchenware, fitting with lifestyle; causing embarrassment; easy to use; resistant; carrying clear instructions; convenient to use; helping to learn portions; versatile; allowing continued use; and helping to meet dietary goals were analysed descriptively within each tool condition and with contingency tables.
The mean change in weight at the end of the study from baseline was assessed using a paired t test.
Results
Ranking poll (Phase 1)
A total of seventy-eight polls were received (69 % females), from which twelve polls were excluded because of invalid or missing answers, leaving a total of sixty-six polls for analysis. Mean age for the sixty-six participants providing valid polls was 47·3 (sd 13·3) years (range 25–86 years, 70 % female). The most preferred tool was the calibrated CS, followed by the serving utensil set and the colour-coded portion pots in similar proportions. The all-in-one portion pot was the least preferred (Table 1). Within the CS category, the option of the labelled dish was chosen by thirty-seven out of fifty (74 %) respondents answering this question. For the colour-coded portion pots and the serving utensils, both the weighted sum scores and number of participants choosing them as 2nd option were very close. However, the portion pots were rated as 3rd option more frequently than the serving utensil set. The serving utensil set was considered more useful, being designed to serve food directly rather than just measuring and was chosen for inclusion in Phase 2, alongside the CS.
Table 1 Results of the anonymous poll (Phase 1) on preference for four commercial portion control toolsFootnote † (Numbers and percentages)
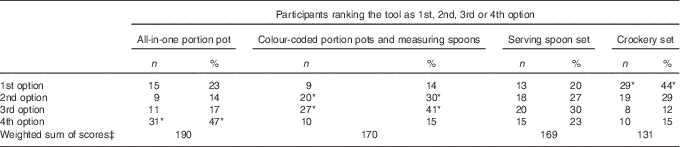
* Highest values and percentages within each option. For details of the tools see reference( 26 ) (all-in-one portion pot)( 12 ), (colour-coded portion pots)( 27 ), (colour-coded measuring spoons)( 14 ), (serving spoon set)( 13 ) and (crockery set).
† Participants (n 66) were patients with diagnosed overweight or obesity attending the Lifestyle and Weight Management Services at the Wirral Community NHS Trust, England.
‡ For example: 15×1+9×2+11×3+31×4=190. The lowest possible score is 66 and the highest is 264. The lower the score, the higher the preference for that tool.
Main study (Phase 2)
Participants
The final sample of recruited participants for Phase 2 was forty-three. Retention rate from initial recruitment was 70 %. After excluding one invalid questionnaire, data from twenty-nine participants (eleven men and eighteen women) were retained for analyses. Table 2 provides characteristics of the twenty-nine completing participants. Fourteen participants tested the CS first and fifteen tested the serving spoons first.
Table 2 Baseline characteristics for the twenty-nine participants who completed study Phase 2 (Numbers and percentages; means and standard deviations)
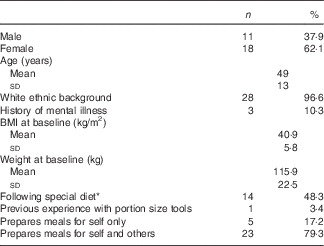
* Low-carbohydrate diet (n 5); low-salt diet (n 4); low-fat diet (n 2); other diet excluding kidney, liver and coeliac disease diets (n 3).
Two-third of the participants were female, mean age was 49 years and 79 % had a BMI>35 kg/m2. Most were of white ethnic background with no experience of portion size tools and who normally prepared meals for themselves and others. Although fourteen participants reported following a special diet at baseline (Table 2), only three participants reported following a specific dietary plan over the course of the study (intermittent fasting, n 1; low fat, n 2). Mean TFEQ scores were as follows: restraint, 11·4 (sd 4·7); disinhibition, 8·6 (sd 4·6); and hunger, 5·9 (sd 4·3).
Weight changes
Weight change could not be computed for two participants because of missing baseline values.
The average change in weight for the remaining twenty-seven participants over the duration of the study was –1·7 (sd 4·1) kg (P<0·05). Twenty-one participants lost weight, one participant maintained weight and five gained weight.
Frequency of tool use, meal type and changes in self-selected portions
Sixteen out of twenty-nine (55 %) participants used the CS on most days (6 or 7 d/week) compared with 6/29 (21 %) for the serving SS. The CS was used for all meals, whereas the SS was mostly used for evening meals. Self-selected portion sizes were reported to be changed with both tools. Notably, 46 and 63 % of participants reported increasing portions of cooked vegetables, 48 and 35 % reported increasing portions of raw vegetables, 77 and 82 % reported decreasing portions of potatoes and 79 plus 93 % reported decreasing chips for the CS and serving SS, respectively.
Acceptance, ease of use and perceived effectiveness
Acceptance, ease of use and perceived effectiveness scores were predominantly high for both tools, especially for ease of use (Table 3 and Fig. 4). Mean scores fell on the ‘moderate to high’ range and were very similar between tools. Likelihood of continued use was also high and similar across tools.
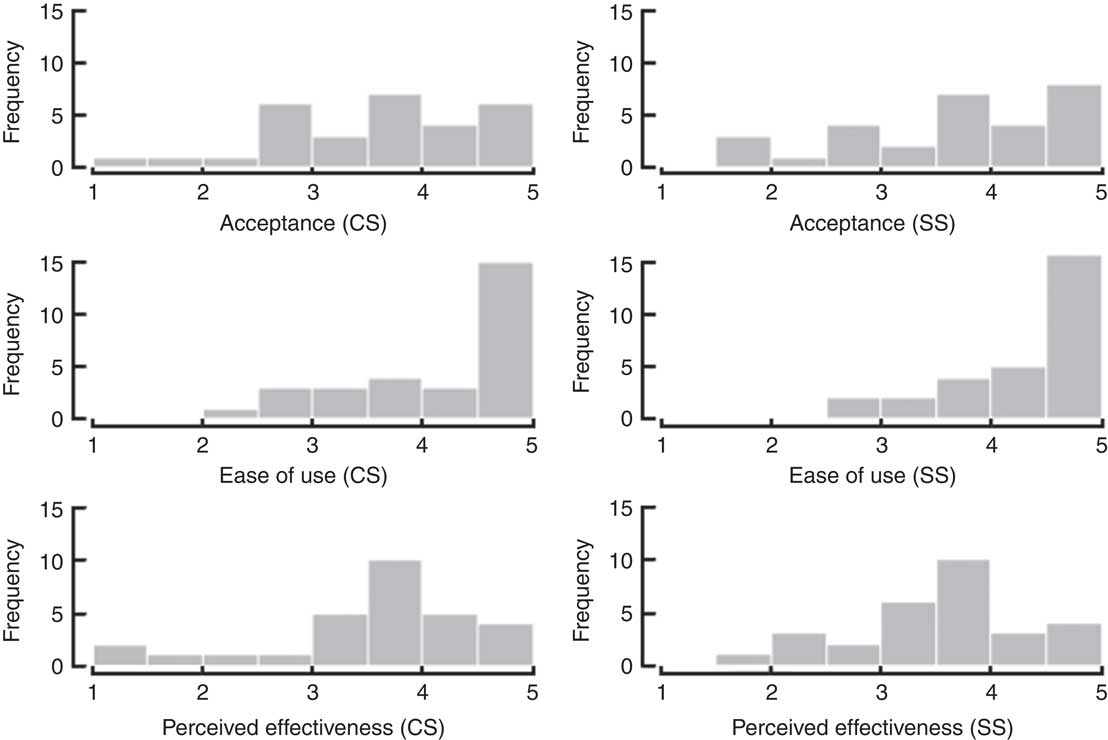
Fig. 4 Distribution of combined scores for the crockery set (CS) and serving spoon set (SS), for acceptance, ease of use and perceived effectiveness. Data from five-point Likert scales (sub-scores combined as for Table 3).
Table 3 Mean combined five-point Likert scores for acceptance (sub-scores for liking, fitting in kitchen, fitting with home life and not feeling embarrassed of using it); ease of use (sub-scores for easy to use, resistant to wear and tear, having clear instructions); and perceived effectiveness (sub-scores for helping to learn portions, measuring new foods, used continuously, helping with dietary goals); and 100 mm visual analogue scale scores for Likelihood of continued use (scale ranging from ‘very unlikely’ to ‘extremely likely’) (Mean scores and standard deviations)
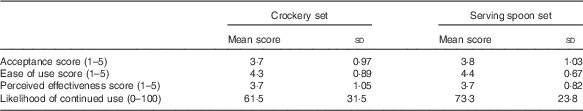
There were no significant differences between tool types on the odds of high v. low levels of acceptance, ease of use or effectiveness (P=0.86, 0.89 and 0.33, respectively). There were no carry-over effects. Likelihood ratio tests showed that none of the variables in the regression models were explanatory of the odds of high v. low attributes (P=0·91, 0·49 and 0·86, respectively).
Discussion
The results of this short intervention show that two commercial portion control tools consisting of calibrated tableware and portioning serving spoons are acceptable, easy to use and potentially effective instruments for inclusion as part of weight-loss interventions. Both tools were equally acceptable and perceived as potentially effective, although the CS was used daily by more people and across a wider range of meals than the serving SS. Both tools helped to reduce self-served portions of chips and potatoes, and to increase vegetable portions (both cooked and raw). These results, together with the tools being perceived as very easy to use and likely to be used in future, suggest these tools may be a useful strategy in weight-loss interventions, at least within the home context. Our results are further supported by participants’ accounts that the tools helped learning about portions and to control portions especially for starchy food( Reference Almiron-Roig, Vaughan and Jebb 29 ).
These data expand on previous studies that have collected only limited experiential data( Reference Kesman, Ebbert and Harris 16 , Reference Pedersen, Kang and Kline 17 ). We included a quantitative measure to detect whether participants felt they had increased or decreased the amount of self-selected main food groups when using the tools, and asked their agreement with specific statements about effectiveness (e.g. the tools helping to learn what an appropriate portion is, helping to meet current dietary goals).
However, changes in portion size data were self-reported and thus potentially subject to bias. A measure of actual changes in amounts eaten or energy intake would have been a more objective measure of behaviour( Reference Lewis, Ahern and Solis-Trapala 5 ). In this short-term study, we did not measure habit formation, which is necessary for long-term dietary change( Reference Lally, Wardle and Gardner 30 ). Despite these limitations, the high self-reported likelihood of continued use plus the reported changes in portion size of certain foods suggests a good potential for both tools to induce habit formation.
The participant sample was drawn from a group of overweight and obese patients attending public weight-loss services in the North of England. In all, 62 % were female, and nearly all participants were of White ethnic background; therefore, the findings may not be applicable to other ethnic and social groups, or those less motivated to lose weight.
Past studies looking at the effects of tableware size on portion intake have tended to involve non-dieting individuals studied under very controlled laboratory settings, which could affect their behaviour( Reference Rolls, Roe and Halverson 31 ), or as part of natural experiments subject to environmental confounding( Reference Wansink, van Ittersum and Painter 22 , Reference Wansink and Kim 32 ). Our study explored the experiences of individuals with obesity in their own home environment. Although this was also a non-controlled environment, it represents a more realistic context in which such tools may be used in a consistent manner than the laboratory.
Previous studies using similar tools have also reported reductions in body weight. In a study with patients with diabetes, a calibrated diet bowl for cereals and soups plus a plate marked with sectors indicating servings of three food groups resulted in a 2 kg greater weight loss v. the control arm over a 6-month period( Reference Pedersen, Kang and Kline 17 ). Similar results were obtained when using a sector plate and calibrated bowl as part of a dietetic weight-loss intervention over a 3-month period( Reference Kesman, Ebbert and Harris 16 ). Our study achieved similar modest weight loss in a shorter time; however, it cannot be directly compared, as here participants had recently completed a weight-loss programme and the very short-term outcome may be a transitory effect initiated by the novelty of the tools and by participant’s motivation as a result of their participation in the study. Other studies found that glass shape influenced drinking rate of alcoholic beverages( Reference Attwood, Scott-Samuel and Stothart 19 ); however, plate size did not influence intake of a pasta meal( Reference Rolls, Roe and Halverson 31 ) but both studies focused on acute effects only (within one eating/drinking occasion). On the other hand, studies using smartphone and Internet technology( Reference Jacobs, Radnitz and Hildebrandt 33 ) have used much larger sample sizes and longer intervention times than our study, plus included a full dietetic intervention, which makes results difficult to compare with the present study.
We did not investigate the mechanisms associated with changes in portion choice. However, self-selected portion sizes increased mainly for raw and cooked vegetables and decreased mainly for chips and potatoes, which would reduce dietary energy density( Reference Rolls, Roe and Meengs 34 ). Portion control tools may prompt users to pay additional attention to how much they self-serve each meal component relative to the whole meal, mediated by visual information of the amount of food to be eaten generated by the specific design of the tool( Reference Marchiori, Corneille and Klein 18 , Reference Robinson, Aveyard and Daley 35 ). In support of this, participants consistently verbalised their surprise at how their habitual portions physically deviated from recommendations when using both tool sets( Reference Almiron-Roig, Vaughan and Jebb 29 ). In addition, if such a process created a lasting visual memory of the distribution of the various food groups on the plate, or the number of serving spoons, this may have helped some participants to recalibrate perceptions of what a normal serving of that food is( Reference Robinson, Oldham and Cuckson 36 ).
In conclusion, this study has generated evidence that specific portion control tools including guided and calibrated utensils are perceived as acceptable and easy to use by people with obesity trying to adhere to a dietary plan, and have the potential to induce modest weight loss with minimal health professional input. The portion control tools we tested here provide a simple and relatively inexpensive strategy that could be implemented alongside other strategies as part of weight management interventions. Further research is needed to explore in more depth the mechanisms by which portion control tools influence learning, and to assess whether they increase weight loss in the longer term over and above standard dietary advice( Reference Thomas, Bond and Phelan 37 , Reference Curioni and Lourenco 38 ).
Acknowledgements
The authors are grateful to the staff at the Wirral Community NHS Foundation Trust and in particular staff from the LWMS for assistance in data collection; to all participants for their contribution; to Alison James and Darren Cole for their help with data management; and to the members of the expert panel consultation (Rachel Crockett, Jessica Dodd, Hannah Lewis, Amy Ahern, Nina Peach (née Brogden), Joanna Weston, Adrian Park, Claire Harris, Jill Sommerville, Clare Whitton, Caireen Roberts, Emily Fitt, David Pell, Alison Lennox, Helen Hackett).
This study was sponsored by the UK Medical Research Council Programme grants U105960389 and U105960384.
E. A.-R. conceived the study with guidance from S. A. J., supervised all the steps in the study and analysed the data for Phase 1, and wrote a first draft of the article. S. A. J., D. V. and I. S.-T. contributed to the study design. D. V. coordinated the data collection in the Wirral. A. D. performed the statistical analyses with support from I. S.-T. All the authors contributed to the writing of the paper and approved the final manuscript.
One example of tools used in the anonymous survey were donated by Precise Portions Nutrition Control Systems (NCS) and another by Rosemary Conley Online Ltd, respectively, as an inspection sample. The remaining tool sets were purchased with Medical Research Council (MRC) funds. Precise Portions NCS and Rosemary Conley Online Ltd had no involvement whatsoever in the design of the study or interpretation of the results. There are no other conflicts of interest.
Supplementary Material
For supplementary material/s referred to in this article, please visit https://doi.org/10.1017/S0007114516004104


 Open access