Diet and eating behaviours are important for health. Unhealthy eating patterns are key risk factors for obesity and non-communicable diseases. The Global Burden of Disease Project showed that dietary factors accounted for 3·1 million deaths in China in 2017, which ranked top in attributed factors and were even higher than hypertension (which attributed to 2·5 million deaths)(Reference Zhou, Wang and Zeng1). Transitions in eating patterns in the past three decades in China may help explain the climbing prevalence of obesity and related non-communicable diseases.
Eating patterns are affected by many social and cultural factors (e.g. food availability, religion, ethnic identities, values and beliefs), genuine behavioural traits (e.g. the response to satiety, food reward) and dietary preferences; which could be partially represented by ethnicity(Reference Zhang and Wang2). Studies conducted in the USA showed that ethnicity affected children’s and adults’ adherence to dietary guidelines and their weight status, which was further mediated by socioeconomic status(Reference Kell, Judd and Pearson3,Reference Kirkpatrick, Dodd and Reedy4) . National surveys in China have also revealed dynamic variations in eating behaviours (e.g. snacking and cooking methods, meal skipping, etc.) among adults(Reference Wang, Zhai and Du5–Reference Wei, Yu and Ju7). Such diversities in eating patterns in China were largely shaped by social and cultural factors, which are largely distinctive across different ethnic groups.
West China is featured by its diverse ethnic populations and eating patterns. In addition to the majority Han people, multiple minority groups live in there. Different ethnic populations have traditionally lived in areas with various geographic features and livelihoods and had different religious-related beliefs and social norms. For example, Tibetans live in the high-altitude areas and believe in Buddhism; Hui traditionally live on trading and believe in Islam. These affect eating behaviours and lead to unique eating patterns. Moreover, some potential proximate determinants (e.g. socio-economic status and nutrition literacy) might also lead to distinctive eating patterns, and subsequently affect weight status. However, no research has studied ethnic variations in eating patterns and their associations with weight status among Chinese adults.
This study aimed to (1) identify ethnic differences in eating patterns and behaviours and (2) explore the associations between eating patterns and obesity among a multi-ethnic adult population in West China. The findings will provide insights for tailored interventions among multi-ethnic groups in an economically disadvantaged area in China.
Materials and methods
Study settings
This study focused on West China across seven provinces (including provincial level autonomous regions): Shaanxi, Gansu, Qinghai, Ningxia Hui Autonomous Region, Tibet Autonomous Region, Inner Mongolia Autonomous Region and Xinjiang Uyghur Autonomous Region (Fig. 1).

Fig. 1. Characteristics of the targeted seven provinces in West China. (a) Map of targeted seven provinces. (b) Characteristics of the targeted seven provinces*.
*The values of % were as % of national values. †100 Chinese Yuan is equal to 14·8 USD.
The region is sparsely populated, economically disadvantaged and diverse in ethnicity in China. Recent data have shown that the seven provinces cover 57·0 % of the area but only 9·3 % of the total population in China(8,9) and accounted for 7·6 % of national Gross Domestic Products(10). Multiple ethnic minority groups, like Tibetan, Hui, Mongolian and Uyghur, lived in this region. The multi-ethnic region was historically well connected to the Middle Asia, Middle East and Europe by the ancient Silk Road and the new Belt Road, an important international trade road in history and in recent years. The long-standing commercial and cultural exchange may also affect the residents’ eating behaviours.
Study design, data collection and participants
An online survey was developed by a multi-disciplinary expert team from the China Nutrition Society, aiming to investigate the eating behaviours as well as their associations with obesity and non-communicable diseases in China. The online survey was carried out using ‘Questionnaire Star’ (a Chinese version of Qualtrics) and was mainly disseminated via WeChat (a widely used social media platform in China). Additional questions were developed based on our previous qualitative studies on local dietary tradition and culture. Demographic characteristics, socio-economic status, eating habits and behaviours, body weight and height were self-reported.
The ethnic minorities are relatively hard to reach as they share different cultures, religions, languages or sometimes move about in search of pasture. Therefore, extensive efforts have been made to recruit minorities by circulating the questionnaires in targeted provinces via WeChat. First, we contacted and obtained approvals from opinion leaders in multiple institutions in West China, such as chairmen of local nutrition societies, directors of nutrition departments in local hospitals and nutrition lecturers in universities. They helped to distribute the questionnaires via WeChat to their work, patient, student groups as well as other relevant networks. Additionally, cash incentives were used to encourage minority students in universities in these areas who came from the seven provinces in West China to collect questionnaires from their friends, neighbours and communities.
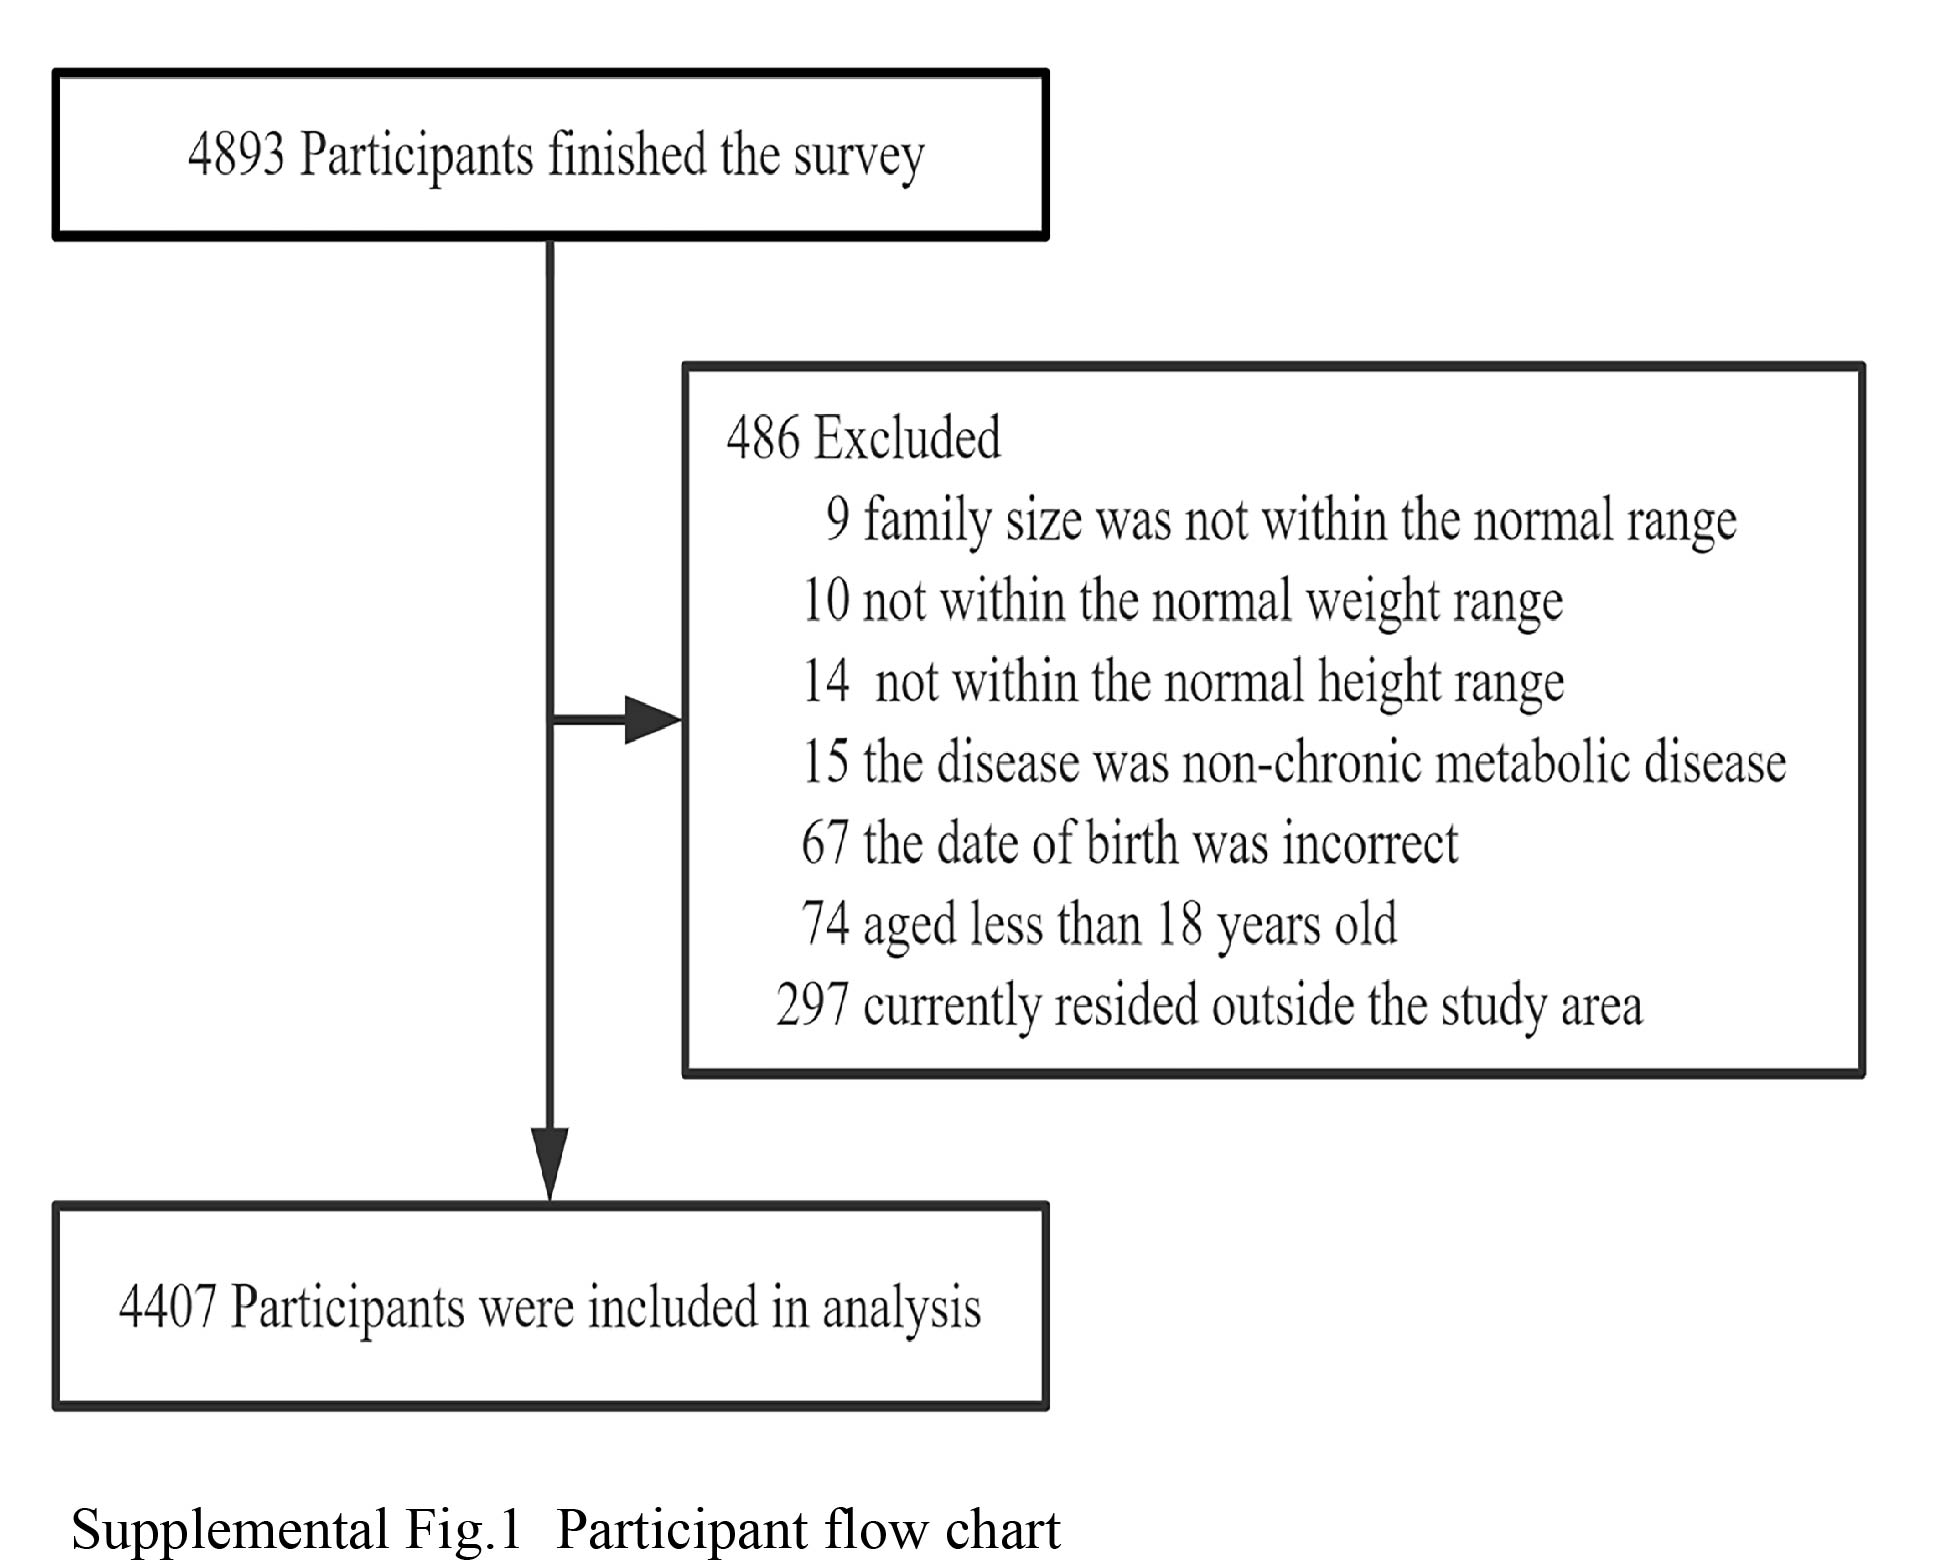
During January – February 2021, voluntary response sampling was applied in our survey and 4893 participants completed the survey. Inclusion criteria for analysis included: (1) being 18 years old or above; (2) current residence within the study areas and (3) being able to finish the online survey independently or with help. Participants were excluded from the analysis if they did not meet the inclusion criteria or their questionnaires did not pass the quality control (n 486). These included respondents who were under 18 (n 74), currently resided outside the study areas (n 297) or completed the questionnaires with low quality (n 115, e.g. conflicts in birth date and age, unreasonable extreme outliers in self-reported body height or weight, etc.). Finally, 4407 subjects were included in analysis (online Supplementary Fig. 1).
Outcome assessment
Eighteen items related to eating behaviours (varying from eating chicken/duck to packing leftovers when eating out) were used to identify eating patterns. Kaiser–Meyer–Olkin measure of sampling adequacy (Kaiser–Meyer–Olkin = 0·826) and Bartlett’s test of sphericity (p < 0·001) were conducted. Then, different eating patterns were identified using principal component analysis, with orthogonal rotation (varimax) to minimise factor correlation and improve interpretability. After checking eigen values (> 1), scree plot and factor interpretability to derive common factors (eating patterns), factor scores for each pattern were obtained and further divided into quartiles.
Frequencies of selected specific eating behaviours (e.g. reading nutrition labels when purchasing prepackaged food) were self-reported and were further dichotomised into ‘never/rarely/sometimes’ or ‘usually/always’.
BMI was calculated from weight (kg) divided by height (m) squared. Later, each participant’s weight status was defined using BMI cutoff points, underweight if BMI < 18·5 kg/m2, normal weight if 18·5 kg/m2 ≤ BMI < 24 kg/m2, overweight if 24 kg/m2 ≤ BMI < 28 kg/m2 or obese if BMI ≥ 28 kg/m2, following the China’s national standard(Reference Zhou11).
Predictor assessment
Ethnicity was self-reported, and the subjects were divided into five groups: Han, Hui, Tibetan, Mongolian and others.
Covariate assessment
Age, household income and province were included in the analysis as covariates. Age was categorised as 18–24, 25–44 and 45 year old or above. Monthly household income was divided into low (< 5000 yuan/month), middle (5000–9999 yuan/month) and high (≥ 10 000 yuan/month) levels.
Statistical analysis
First, eating patterns were derived using principal component analysis. Quartiles of each eating pattern’s factor scores were obtained. Second, the four patterns’ factor scores and frequencies of selected eating behaviours were compared between men and women in each of the five ethnic groups. Third, participants’ socio-demographics and weight characteristics were compared between Q1 and Q4 of the four pattern scores using ANOVA tests for continuous variables or χ 2 tests for categorical variables. Fourth, ordered logistic regressions were fit to examine ethnic differences in eating patterns while adjusting for age, household income and province. Finally, linear and logistic regression models examined if eating patterns and ethnicity were related to BMI and weight status (overweight/obese or not) adjusting for covariates, respectively. As the distribution of BMI was skewed, its log transformation was used in linear regression analysis.
For sensitivity analysis, ordered logistic regression models that treated weight status as a three-level variable (underweight/normal weight, overweight and obese) were fit to demonstrate if eating patterns and ethnicity were associated with weight status.
All analyses were performed using STATA 16·0. All P values were two sided, and α level of < 0·05 was used for significance.
Results
Sample characteristics
The subjects’ age ranged from 18 to 78, with a mean age of 32·6±10·7 years. Most of them were between 25 and 44 years old (54·1 %), women (67·6 %), of Han ethnicity (72·5 %) and from low-income families (42·3 %). Approximately one-fourth of the sample were either overweight (18·5 %) or obese (5·8 %), see Table 1.
Table 1. Baseline characteristics among adults in west china, by gender and ethnicity (n 4407)*
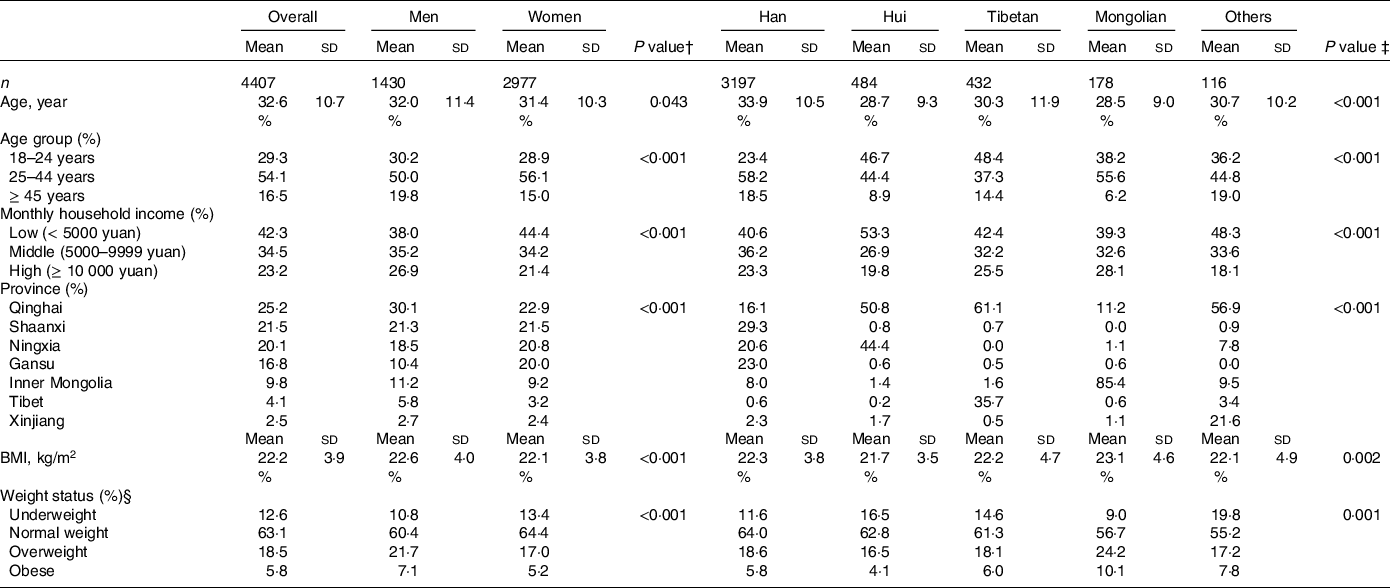
* Values are means (standard deviations) for continuous variables and n (%) for categorical variables. Differences in characteristics were compared using χ 2 tests for categorical variables and t tests/ANOVA for continuous variables.
† P value by gender.
‡ P value across five ethnic groups.
§ Underweight if BMI ≤ 18·5 kg/m2, normal weight if 18·5 kg/m2 < BMI < 24 kg/m2, overweight if 24 kg/m2 ≤ BMI < 28 kg/m2, obese if BMI ≥ 28 kg/m2.
Ethnic differences existed in socio-demographic and weight characteristics. Han people tended to be older (mean:33·9 years, sd:10·5 years). More Hui people belonged to the low-income group (53·3 % in Hui v. 40·6 % in Han), while Mongolians were more likely to be overweight/obese (34·3 % in Mongolians v. 24·4 % in Han).
In addition, ethnic distribution in the sample was compared with the data reported in the seventh national population census in China to check its representativeness. First, most of the minority groups across the seven provinces were included in the sample. Second, the overall proportions of Mongolian and Han ethnicities were consistent with what was reported in the census (Mongolian: 4·04 % v. 3·47 %, Han: 72·54 % v. 75·88 %), see online Supplementary Table 1 for more details.
Four eating patterns identified
Four eating patterns were identified (see Table 2): (a) ‘meat-lover’ pattern characterised by frequent consumption of dairy products and all kinds of meat (i.e. lamb, beef, pork, chicken, duck and seafood); (b) ‘indulgent’ pattern featured more frequent intakes of added salt, sugar, pickled foods and alcohol; (c) ‘diversified-eating’ pattern characterised by frequently eating out and consuming foods prepared in diverse ways (e.g. fried, steamed, raw etc.) and (d) ‘nutri-health-concerned’ pattern included behaviours that show concerns in nutritional health (e.g. frequently read nutrition labels when purchasing prepackaged food). They accounted for 43·9 % of the total variance.
Table 2. Rotated factor loading matrix for the four eating patterns among adults in West China (n 4407)

Ethnic and gender differences in eating patterns
Findings from ANOVA or χ 2 tests (see Fig. 2(a)) showed ethnic differences in eating patterns by gender, while Han was treated as the reference group. Compared with Han, Hui and Tibetans were less likely to adopt the ‘meat-lover’ and ‘diversified-eating’ pattern (P < 0·05 for men and women of Hui and Tibetan men). More Tibetan and Mongolian people, especially their men, favoured the ‘indulgent’ pattern (P < 0·01 for Tibetan and Mongolian men; P < 0·001 for Tibetan and Mongolian women). Meanwhile, Tibetans were less likely to be ‘nutri-health-concerned’ (P < 0·001 for both men and women).

Fig. 2. Eating pattern scores and frequencies of selected eating behaviours by ethnicity and gender among adults in West China (n 4407). (a) Eating pattern scores. (b) Frequency of selected eating behaviours. Selected eating behaviours frequency percentage is the proportion of ‘usually/always’. P1: P value by ethnicity among men; P2: P value by ethnicity among women. */**/*** P value by gender within each ethnic group. *P < 0·05, **P < 0·01, ***P < 0·001. ◢/◆/△ P value on ethnic differences in eating behaviour or pattern among men/women, compared with Han. ◢P < 0·05, ◆P < 0·01, △P < 0·001.
Gender differences existed within ethnic groups. Compared with women, men of Han ethnicity were more likely to have the ‘meat-lover’ (P < 0·01) or ‘indulgent’ patterns (P < 0·001) and were less likely to have the ‘diversified-eating’ (P < 0·01) or ‘nutri-health-concerned’ patterns (P < 0·001); Hui and Tibetan men were more likely to have the ‘indulgent’ pattern (P < 0·001 for Hui; P < 0·01 for Tibetan) and less likely to have the ‘diversified-eating’ (P < 0·001 for Hui; P < 0·01 for Tibetan) or ‘nutri-health-concerned’ patterns (P < 0·01 for Hui; P < 0·05 for Tibetan); Mongolian men were more likely to adopt the ‘indulgent’ pattern (P < 0·01).
Ethnic and gender differences in specific eating behaviours
Further analysis was conducted to explore ethnic differences in specific eating behaviours. The results were largely consistent with the observed ethnic difference in eating patterns. Compared with Han, Hui were more likely to eat lamb/beef (P < 0·001 for women) or add sugar when drinking tea (P < 0·001 for men), but were less likely to eat pork (P < 0·001 for both men and women) or eat out frequently (P < 0·01 for both men and women). Tibetans were less likely to drink/eat dairy products (p < 0·01 for both men and women), read nutrition labels when purchasing prepackaged food (P < 0·01 for men), eat out frequently (P < 0·01 for men) or eat chicken/duck (P < 0·01 for men). Mongolians were more likely to eat lamb/beef (P < 0·001 for both men and women) and drink/eat dairy products (P < 0·01 for women). Generally speaking, the consumption of shrimp and fish was limited, while Han people relatively consumed more than other ethnic groups (see Fig. 2(b)).
Considerable gender differences in eating behaviours existed within ethnic groups. Compared with men, women were more likely to drink/eat dairy products (P < 0·001 for Han and Hui; P < 0·01 for Tibetan), read nutrition labels (P < 0·05 for Tibetan) or eat out (P < 0·05 for Tibetan) and were less likely to eat lamb/beef (P < 0·001 for Han) or chicken/duck (P < 0·05 for Han).
Differences in eating patterns across diverse socio-demographic and weight subgroups were observed, when Q1 and Q4 of each eating pattern factor scores were compared. First, those scored higher in the ‘meat-lover’ or ‘diversified-eating’ pattern tended to be older, wealthier and have higher BMI values or probability of being overweight /obese in both genders. Second, those scored higher in the ‘indulgent’ pattern tended to be younger, wealthier in men but less good off in women. Third, people with the ‘nutri-health-concerned’ pattern were more likely to be older and wealthier in both genders (see Table 3).
Table 3. Participants’ characteristics by quartiles of eating pattern scores among adults in West China, by gender (n 4407)†

† Values are means (standard deviations) for continuous variables and n (%) for categorical variables. Differences in characteristics were compared using χ 2 tests for categorical variables and t tests/ANOVA for continuous variables.
*P < 0·05.
**P < 0·01.
***P < 0·001
Table 4 shows results from multivariate logistic regression models that examined the association between eating patterns and ethnicity by gender. After adjusting for covariates, compared with men of Han ethnicity, Hui and Tibetan men were less likely to have the ‘meat-lover’ (OR = 0·284; 95 % CI 0·203, 0·396 for Hui; OR = 0·584; 95 % CI 0·407, 0·836 for Tibetans) or ‘diversified-eating’ eating patterns (OR = 0·414; 95 % CI 0·298, 0·575 for Hui; OR = 0·530; 95 % CI 0·369, 0·760 for Tibetans). Mongolian men were more likely to have the ‘indulgent’ pattern (OR = 2·202; 95 % CI 1·232, 3·934), while Hui men were less likely to adopt such pattern (OR = 0·654; 95 % CI 0·471, 0·910). Tibetan men were less likely to have the ‘nutri-health-concerned’ pattern (OR = 0·451; 95 % CI 0·312, 0·653), while men from minority groups other than Hui, Tibetans or Mongolians were more likely to adopt such pattern (OR = 1·855; 95 % CI 1·027, 3·352).
Table 4. Multivariate ordered logistic regression models of the effect of ethnicity on eating pattern score quartiles (Q1–Q4) in West China, by gender (n 4407)†

*P < 0·05.
**P < 0·01.
***P < 0·001.
† OR (95 % CI) and P values were calculated from ordered logistic regression analysis, adjusting for age, household income and province.
The findings for women were similar. Compared with Han women, Hui women were less likely to be ‘meat-lover’ (OR = 0·328; 95 % CI 0·259, 0·416), have the ‘diversified-eating’ pattern (OR = 0·650; 95 % CI 0·514, 0·822) and were more likely to be ‘nutri-health-concerned’ (OR = 1·341; 95 % CI 1·058, 1·700). Tibetan women were less likely to be ‘meat-lover’ (OR = 0·615; 95 % CI 0·444, 0·853) or ‘nutri-helath-concerned’ (OR = 0·391; 95 % CI 0·279, 0·549). Mongolian women were more likely to be ‘indulgent’ (OR = 1·789; 95 % CI 1·185, 2·702) and less likely to have ‘diversified-eating’ pattern (OR = 0·590; 95 % CI 0·391, 0·889). Women from other ethnic groups were less likely to be ‘meat-lovers’ (OR = 0·637; 95 % CI 0·409, 0·993).
Effect of eating patterns and ethnicity on weight outcomes
Table 5 exhibits the association between the four eating patterns/ethnicity and weight outcomes. Among men, only the ‘meat-lover’ pattern was found to be positively associated with BMI (exp(β) = 1·029; 95 % CI 1·001, 1·058 for Q4 v. Q1) and risks of overweight/obesity (OR = 1·677; 95 % CI 1·129, 2·489 for Q4 v. Q1). Compared with Han, Mongolian men had higher BMI (exp(β) = 1·067; 95 % CI 1·018, 1·118) or be more likely to be overweight/obese (OR = 3·126; 95 % CI 1·688, 5·790).
Table 5. Multivariate linear and logistic regression models of the effect of eating pattern score quartiles and ethnicity on weight outcomes in West China, by gender (n 4407)†

*P < 0·05.
**P < 0·01.
***P < 0·001.
† exp(β) (95 % CI), OR (95 % CI) and P values were calculated from linear and logistic regression analysis, adjusting for age, household income and province.
‡ BMI was log-transformed due to heteroscedasticity and was later exponentiated.
§ Overweight or obese if BMI ≥ 24 kg/m2.
The findings for women were slightly different. The ‘meat-lover’ pattern was positively associated with BMI (exp(β) = 1·018; 95 % CI 1·000, 1·036 for Q4 v. Q1), while the ‘nutri-health-concerned’ pattern was inversely associated with BMI (exp(β) = 0·983; 95 % CI 0·966, 1·000 for Q2 v. Q1). No significant relationship was detected between ethnicity and weight outcomes in women.
Sensitivity analysis showed similar results, in which weight status was divided into three groups. However, none of the observed associations were statistically significant in women (online Supplementary Table 2).
Discussion
This study identified four eating patterns among a multi-ethnic adult population in West China, including (1) ‘meat-lover’ – characterised by frequent consumption of meat (e.g. pork, lamb, beef, chicken, seafood) and dairy products, (2) ‘indulgent’ – by frequent intakes of added salt, sugar, alcohol and pickled food, (3) ‘diversified-eating’ – by frequently eating out and consuming food with diversified cooking methods (e.g. fried, steamed, boiled, salad) and (4) ‘nutri-health-concerned’ – by frequent good food hygiene behaviours and reading food labels. Ethnic differences were identified in these patterns among both men and women. Compared with Han, Hui people were less likely to have the ‘meat-lover’ or ‘diversified-eating’ patterns; Tibetans were less likely to have the ‘meat-lover’ or ‘nutri-health-concerned’ patterns; while Mongolians were more likely to have the ‘indulgent’ pattern. When linked to weight outcomes, BMI and overweight/obesity were positively associated with the ‘meat-lover’ pattern in both genders and were inversely related to the ‘nutri-health-concerned’ pattern in women. After controlling for covariates, Mongolian men were triple more likely to be overweight or obese than men of Han.
To our knowledge, this is the first study in China that showed ethnic variations in eating patterns and behaviours and their associations with obesity. It revealed Mongolian people as the high-risk population for overweight/obesity, which may be associated with their ‘indulgent’ eating pattern. Such findings will provide insights for future interventions and help reduce health disparity in China.
The identified four eating patterns and their ethnic differences are consistent with some findings from previous research in China. For example, the nomadic Mongolians are known for their hospitality and enthusiasms for alcohol and milk tea, in which sugar and salt are commonly added(Reference Xiao, Sun and Zhaxi12). On the contrary, Hui people mostly believe in Islam, who put an emphasis on abstinence and consider drinking and overeating as a violation of the Islamic doctrine(Reference Gao, Yuan and Yang13). This may explain why more Mongolians were found to adopt the ‘indulgent’ pattern, while Hui tended to be less ‘indulgent’ but more ‘nutri-health-concerned’.
The observed ethnic differences in the ‘meat-lover’ pattern are controversial, as it combines the consumption of lamb, beef with pork, seafood and poultry. Religions and cultural beliefs discourage Tibetans from eating fish and Hui people from consuming pork. These two ethnic groups mostly eat beef and lamb (for Hui people, also poultry) to meet their needs for proteins(Reference Zhou, Li and Liu14,Reference Zhai, He and Wang15) . Such speculation is partially supported by the observed ethnic differences in eating behaviours, in which Mongolians were found to consume more lamb/beef and dairy products than other ethnic groups. This is because they usually live in pastoral or semi-pastoral/semi-agricultural areas and largely depend on animal husbandry. In other words, most Mongolian families raise sheep and cattle, and their diets are primarily based on lamb, beef and dairy products(Reference Sha16). Other studies have documented such eating behaviours and linked them to lack of dietary fibre intake as well as increased risks of hypertension and obesity(Reference Yu, Ning and Gao17,Reference Zhang, Zhang and Lu18) . Moreover, the weather and geographical characteristics of wide grasslands in West China make it not an ideal place for raising seafood, which is limited and mostly supplied from other areas.
Eating patterns and behaviours were different by gender, while overall patterns showed that more men tended to be ‘indulgent’ while more women tended to have ‘diversified-eating’ or ‘nutri-health-concerned’ patterns. This may be explained by gender discrepancies in ideal body image, peer influence and weight-control behaviours. Studies in China found that girls were more likely to overestimate their weight and had higher body dissatisfaction(Reference Wang, Xue and Xu19), and female migrants tended to have better diet quality than their male counterparts(Reference Sun, Li and Rahut20).
This study found that Mongolian men were more likely to be overweight/obese, consistence with a previous study(Reference Li, Wang and Yan21). It could be explained by Mongolians’ higher scores in ‘indulgent’ pattern and its association with higher BMI and risks of overweight/obesity. The traditional nomadic livelihood among Mongolians led to a high consumption of beef and lamb, while the relationship between red meat consumption and obesity has been substantiated by many studies(Reference Tang, Xiao and Chen22–Reference Torres, Robinson and Orellana24). In addition, some other studies have reported high obesity rates among indigenous or minority populations in transition from traditional to modern lifestyles(Reference Gracey and King25). This transition among minority populations was similar to the nutritional and lifestyle transition and subsequent increasing obesity among the entire Chinese population during urbanisation, as revealed by the China Health and Nutrition Survey(Reference Du, Wang and Su26). However, urbanisation among minority groups happened later and grew slower than that in Han people, a result of the lower proportion of urban residents in ethnic autonomous regions than other Han-dominated provinces in China(8).
Our previous study found an increasing and high burden of obesity and related metabolic disorders in urbanised Tibetan adults in transition from nomadic to urbanised environments, in which dietary transition was identified as a risk factor(Reference Peng, Liu and Malowany27). The low nutrition literacy among Tibetans revealed in this study, and the largely increased food availability and accessibility in urbanisation, help explain our previous findings. The inconsistency in Tibetan’s weight status reported in the previous and current studies can be explained by the demographic differences, e.g. age and socio-economic status, among participants in these two surveys. Specifically, the participants in this study were much younger, perhaps because online survey tools were used for data collection.
The emerging high obesity rates among Chinese minorities mimic findings from developed countries, where obesity and related non-communicable diseases usually disproportionately affected disadvantaged and minority populations(Reference Powell, Wada and Krauss28,Reference Cheng, Kanaya and Araneta29) . In China, similar trend was observed. For example, ours and other recent studies demonstrated higher rates of obesity and diabetes among rural than urban populations in China(Reference Wang, Zhou and Zhao30,Reference Wang, Peng and Zhao31) .
This study findings have several public health implications. The limited evidence on eating and health in ethnic minorities has impeded the development of population-specific public health policies and interventions. Diets have a significant effect on the wide gap in mortality, morbidity and life expectancy between minorities and the majority Han population, this study provided evidence for tailored dietary interventions. Among all the studied ethnic groups in West China, dietary interventions targeting Mongolians shall be a priority, as they tend to adopt an ‘indulgent’ eating pattern and are most likely to be overweight/obese. More studies are needed to understand how urbanisation and migration impact traditional eating behaviours in China.
This study has several important strengths. First, it is the first that investigated the ethnic variations in eating behaviours and their relations to obesity. These attempts will help draw attention to the vulnerable populations and promote health equity. Second, it used quantitative methods to describe dietary tradition and culture. These distal contextual determinants have influential impacts on health outcomes but were largely understudied. Findings from this study would help guide develop tailored interventions and promote public health. Third, the questionnaire was well designed, first by a Chinese Nutrition Society scientific committee, then supplemented with questions on unique eating features among minority groups in West China derived from our previous qualitative study.
Several limitations exist in this study. First, in order to enroll the hard-to-reach, especially the nomadic minorities, this study collected data based on online survey tools and voluntary response sampling, which may lead to response and selection bias. As completing this survey required a certain literacy level, respondents were more likely to have higher educational levels and were less likely to maintain a traditional dietary pattern. Second, extensive efforts have been made to increase the number of minority participants, which may lead the sampling bias towards an uncertain direction in some minorities, such as Hui. Thus, its external validation should be explained with caution. Although ethnic distribution of Han and Mongolians in this sample and the census data were comparable, there were still discrepancies in other ethnic groups. Third, the weight and height were self-reported, but validity of such measure has previously been reported(Reference Davies, Wellard-Cole and Rangan32).
In conclusion, four eating patterns were identified among a multi-ethnic adult population in West China. Large ethnic differences existed in eating patterns. Han population showed more ‘diversified-eating’; Mongolians were more likely to be ‘indulgent’; Tibetans were more likely to be ‘indulgent’ and less likely to be ‘nutri- health-concerned’; while women of Hui cared more about their nutritional health. Such ethnic variations in eating behaviours were related to weight outcomes. Being Mongolians or having the ‘meat-lover’ eating pattern were positively associated with overweight.
Acknowledgements
We thank Profs Jianjun Yang, Bao Xin, Drs. Caiqing Xi, Yao Zhao, Guolian Qi and Mei Xue for their assistance for the study and thank all the study participants.
This study was funded by the Science Promotion and Communication Fund, Chinese Nutrition Society (CNS-SCP2020-040) and Young Scientists Grants in Qinghai University, China (2020-QSY-3, 2019-kyt-02).
Y. Wu: designed research, drafted the paper and performed statistical analysis; Yanxiang Wang: performed statistical analysis and drafted the paper; Z. D.: participated in data analysis; L. T.: participated in data interpretation; Y. Z.: collected data and participated in figure preparation; Youfa Wang: designed the study and revised the paper; W. P.: designed research, drafted and revised the paper. All authors have read and approved the final manuscript.
This study was conducted according to the guidelines laid down in the Declaration of Helsinki, and all procedures involving research study participants were approved by the ethics committee of Medical College Qinghai University (No. 2020-040). Informed consent was obtained at the beginning of the online survey from all the subjects. If agreeing to participate, they would continue with the survey.
Supplementary material
For supplementary material/s referred to in this article, please visit https://doi.org/10.1017/S0007114523001745