


Children under 5 years of age are known to be vulnerable to health problem as they suffer from various disadvantages. Most deaths of children under 5 years of age worldwide are due to neonatal causes, pneumonia, diarrhoea, malaria, measles and HIV/AIDS( Reference Black, Morris and Bryce 1 ), with malnutrition being an underlying cause in about a third of these deaths( Reference Black, Allen and Bhutta 2 ). Exclusive breast-feeding for the first 6 months of life, followed by appropriate complementary feeding and continued breast-feeding from the age of 6 months to 2 years can reduce nearly 20 % of all deaths among children under 5 years of age( Reference Jones, Steketee and Black 3 ).
Considering that children aged 0–23 months offer a unique window of opportunity to shape healthier and more prosperous future, it is important to ensure appropriate feeding practices during this period. World Health Organization( 4 ) in 2010 recommends the use of fifteen indicators for monitoring optimal feeding practices of infants and young children. The core indicators centre on early initiation of breast-feeding, exclusive breast-feeding under 6 months, continued breast-feeding at 1 year, introduction of solid, semi-solid or soft foods, minimum dietary diversity, minimum meal frequency, minimum acceptable diet (i.e. breast-fed children who meet minimum dietary diversity and minimum meal frequency) and consumption of Fe-rich or Fe-fortified foods. Other indicators cover additional practices such as children ever breast-fed, continued breast-feeding at 2 years, age-appropriate breast-feeding, predominant breast-feeding under 6 months, duration of breast-feeding, bottle feeding and milk-feeding frequency for non-breast-fed children( 4 ).
Furthermore, determinants related to the social gradient are known to be mostly inversely associated with health state( Reference Wilkinson and Marmot 5 ). When poor children are exposed to disease-causing agents, they are more vulnerable due to lower disease resistance and low coverage with preventive interventions. Once they acquire a disease that requires medical treatment, they are less likely to have access to services, the quality of these services is likely to be lower, and life-saving treatments are less readily available( Reference Barros, Victora and Scherpbier 6 ). Such phenomenon is reflected in the 2010 Indonesia national data that show that the proportions of underweight and stunting in the low socio-economic status (SES) group were nearly double that of the high SES group (10·4 v. 22·7 % for underweight and 24·1 v. 43·1 % for stunting)( 7 ). These suggest that malnutrition is still a public health problem in Indonesia.
However, there is limited information about the relationship between children’s feeding practices and the socio-economic gradient in emerging economies like Indonesia. Therefore, this paper examines the feeding patterns of young children aged 12–23 months, in different socio-economic settings. This paper is part of a larger study on dietary patterns among children aged 12–59 months in various socio-economic groups in Bandung city.
Methods
This study was a cross-sectional survey among a population of apparently healthy children aged 12–23 months, conducted in forty-three villages within thirty-three sub-districts of Bandung city in year 2011. For this study, the proportion of children with adequate food intake was the main indicator used to calculate the sample size. A confidence level of 95 % and a design effect of two were employed. As data on the proportion of children with adequate intake in Bandung city were not available, the proportion of children with adequate intake in each group was assumed to be 50 % (to achieve the maximum sample size), with a maximum acceptable deviation of 10 %. The calculated sample size was 192 for each group.
Sample selection followed two stages of cluster sampling with village as the cluster unit. At the first stage, fifty villages were selected using the probability proportionate to population size (PPS) method. At the second stage, six neighbourhoods/hamlet were selected, also using the PPS method. At the third stage, a simple random selection of four children from each village was employed.
Prior to the survey, a census was taken to provide a list of eligible households that matched the children’s SES and age groups. The socio-economic categories were defined on the basis of the combination of (1) household-monthly expenditures (food and non-food as used in National Survey on SES), (2) the physical condition of its dwelling and (3) ownership of household appliances/facilities. Household-monthly expenditures were obtained from interviews using a list of food and non-food items, and the amount of Indonesian rupiah (IDR) spent on those items was then summed. This resulted in a seven-group classification (monthly expenditures in IDR A1: >3·5 million, A2: 2·5–3·5 million, B: 1·75–2·5 million, C1: 1·25–1·75 million, C2: 0·9–1·25 million, D: 0·6–0·9 million and E: <0·6 million) that was then regrouped to low (levels D and E), medium-low (C2), medium-high (C1) and high (B, A2 and A1) classes. Factors that were considered in the classification of physical condition of the dwellings included its size (A=Big to E=very small), building materials (made of high-quality materials to very low quality (sometimes made of wood)), state of maintenance (very good to in need of repair), type of housing model (such as luxurious, standard, simple, or very modest), quality of furniture and maintenance of yard (good to not maintained). Combination of these house factors resulted in five classes, ranging from A (high quality) to E (low quality).
Ownership of household appliances/facilities was based on the listed sixteen items (such as colour television, credit card, car, microwave, mobile phone, etc.). The classification was based on the total number of appliances/facilities owned. This resulted in six classes such as A (has ten or more facilities/items and must own a car and washing machine but excluding kerosene stove), B (has ten or more facilities/items and must own a car or motor cycle but excluding kerosene stove), C1 (has up to nine facilities/items and must own a telephone or video compact disc (VCD) but excluding kerosene stove), C2 (has up to eight facilities/items and must own a telephone or VCD but excluding kerosene stove), D (has a minimum of two facilities/items but excluding kerosene stove) and E (owns radio and/or kerosene stove at most).
On the basis of the SES grouping that resulted from expenditures (seven classifications), house condition (five classifications) and ownership of household items (six classifications), up to 112 possible combinations emerged. All this information was used to create the final classification of the SES used in the present study, which consisted of A, B, C1, C2 and E groups.
The study was conducted after obtaining approval from the Ethics Committee of the Faculty of Medicine, University of Indonesia (No. 88/PT02.FK/ETIK/2011). Permission was also obtained from local authorities, district health offices and Public Health Center at each respective sub-district. Primary caregivers of the children were interviewed only after they gave their consent.
A structured, pre-tested questionnaire was administered to main caregivers (mothers) to gather data on the general characteristics of the subjects, SES, income and expenditure, morbidity, hygiene and sanitation, feeding practices, and nutrition and health knowledge. The interview was conducted door to door using a structured questionnaire by trained interviewers. A quantitative 24 h recall was used to obtain data on the children’s dietary intake. To assess nutritional adequacy, a non-consecutive repeated recall was administered to thirty randomly selected caregivers in each SES category. The interval between first recall and second recall was at least 1 week. Information on the energy and nutrient contents of the consumed foods collected from the 24 h food recall was obtained from the Indonesian food composition database available in NutriSurvey for Windows, version 2004. Nutrient values of foods that were not available in this existing database were added on the basis of nutrient information on food package/label and/or values inputted from the closest similar food in the Indonesian food composition database. Local household measurements and portion sizes were converted into grams by weighing the local food and/or using information on the food label. Because the data of some nutrients were not complete (i.e. vitamin A and vitamin E, I and dietary fibre), they are not presented in this paper.
PC-SIDE (software for Intake Distribution Estimation) was used for estimating the distributions of usual food and nutrient intakes for groups. These distributions were required to determine the proportions of the group, who were at risk of inadequate intake of essential nutrients based on the estimated average requirement (EAR) cut-off( 8 ). In this study, the EAR was calculated from the 2004 Indonesian RDA divided by a conversion factor as recommended by Food and Nutrition Board, Institute of Medicine, because the EAR cut-off was not yet available( Reference Allen, De Benoist and Dary 9 ).
Indicators for assessing young children’s feeding practices were based on the eight core indicators recommended by World Health Organization( 4 ). Food intake from the 24 h recall was converted into seven food groups namely (1) grains, roots and tubers, (2) legumes and nuts, (3) dairy products (milk, yogurt and cheese), (4) flesh foods (meat, fish, poultry and liver/organ meats), (5) eggs, (6) vitamin-A rich fruits and vegetables and (7) other fruits and vegetables. To estimate the children’s dietary diversity score (DDS), an indicator of ‘minimum dietary diversity’ was defined as the proportion of children who received foods from at least four food groups the previous day( 4 ). Out of the eight core indicators, three indicators (i.e. early initiation of breast-feeding, exclusive breast-feeding under 6 months and introduction of solid, semi-solid or soft foods) should be applied to children <1 year old. As the children included in this study were all older than 1 year, those indicators were obtained using a recall method.
Anthropometric assessments including weight and length/height measurement of the children were performed using SECA® weighing scales to the nearest 0·1 kg and SHORR® length boards to the nearest 0·1 cm, respectively. Assessments were carried out by trained enumerators. To avoid a systematic error, all weighing scales were calibrated every day prior to use. To reduce intra- and inter-observer errors, all anthropometric measurements were taken in duplicate (to attain the mean value) by the same anthropometric measurer following standardised WHO procedures( 10 ). WHO Anthro 2005 software was used to analyse the children’s anthropometric data, which were then transformed to Z-scores for anthropometric indices of weight-for-age, height-for-age and weight-for-height following WHO growth standards for children aged 0–5 years. Afterwards, the children’s nutritional status was classified according to WHO criteria( 10 ).
Data checking was carried out in the field by field assistants immediately after data collection, then double checked by the field coordinators. Single data entry was made using EpiData software (EpiData Association) by five trained statistical clerks, and data cleaning was performed by the authors. Stata version 11 (StataCorp) and SPSS version 15 (SPSS Inc.) were used to perform the statistical analyses. Because cluster sampling was used, all analyses were performed on weighed data. To assess statistical differences between the SES groups, the ANOVA and χ 2 tests were used. Data were presented as medians or percentages, classified according to internationally accepted standards( Reference Lang and Secic 11 ).
Results
Table 1 summarises the characteristics of the children (n 814) by the SES group. There were no significant differences in the age of children across SES groups. The median age of children for high, medium-high, medium-low and low SES groups were 19·2, 19·5, 20·3 and 19·3 months, respectively. There were statistically significant differences in the sex of the children, house ownership and head of the household by SES group. Overall proportions of boys from the high and medium-high SES households were slightly higher than those of the medium-low and low SES households. Most of the children from the high SES group lived in their own house (47·9 %), whereas more children from the low SES group lived in shared houses (together with their grandparents or family). Even though most heads of households were fathers and others (usually grandfathers), more mothers in the low SES group were heads of household compared with other SES groups. Most of the children across SES groups lived in nuclear families.
Table 1 Characteristics of the children (n 814) by socio-economic status groups (Numbers and percentages; medians and interquartile ranges (IQR))

* Kruskal–Wallis test.
† χ 2 test (P<0·05).
Child-feeding practices based on the core indicators of the WHO guidelines by the SES group are summarised in Table 2. As the age of children being studied was >1 year, the indicators related to breast-feeding (early initiation and exclusive breast-feeding) refer to their practice when they were at 6 months of age. More than half of the children from low, medium-low and medium-high SES groups continued to breast-feed. The rate of continued breast-feeding among children from the high SES group was the lowest as compared with that of the other groups, where only 46 % of them continued to breast-feed. Nevertheless, exclusive breast-feeding at age 6 months was significantly higher among children from high and medium-low SES groups as compared with medium-high and low SES groups. The proportion of children from the high SES group who met the minimum dietary diversity was significantly higher than that of the other SES groups. Similarly, children from the high SES group performed better than those from the other SES groups in terms of minimum acceptable diet. Consumption of Fe-rich or Fe-fortified foods among children from the low SES group was the lowest as compared with the other SES groups.
Table 2 Child-feeding practices according to the WHO guidelines by socio-economic status groups (Numbers and percentages)
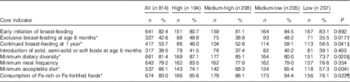
* χ 2 test (P<0·05).
† Between groups test, high v. low P=0·0236, high v. medium-low P=0·9992, high v. medium-high P=0·0576.
‡ Between groups test, high v. low P=0·0400, high v. medium-low P=0·0230, high v. medium-high P=0·2552.
§ Between groups test, high v. low P=0·0004, high v. medium-low P=0·0560, high v. medium-high P=0·5594.
|| Between groups test, high v. low P=0·0005, high v. medium-low P=0·0705, high v. medium-high P=0·2300.
¶ Between groups test, high v. low P=0·7788, high v. medium-low P=0·0086, high v. medium-high P=0·0019.
Children’s food intake by SES group is presented in Table 3. Children from the low SES group consumed more grains but fewer foods compared with other groups. Children from the high SES group consumed more legumes and nuts, dairy products, flesh food, eggs, vitamin-A rich fruits and vegetables, and other fruits as compared with the other SES groups. However, only the differences in the consumption of dairy products and other fruits/vegetables were statistically significant.
Table 3 Children’s intake based on the food groups by socio-economic status groups (Numbers and percentages)
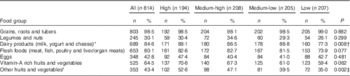
* χ 2 test (P<0·05).
† Between groups test, high v. low P=0·0042, high v. medium-low P=0·6917, high v. medium-high=0·0692.
‡ Between groups test, high v. low P=0·0003, high v. medium-low P=0·0084, high v. medium-high=0·2738.
Overall, the median intakes of energy and protein were above recommended levels. However, intakes of folic acid, Fe and Ca were below the recommended levels. There were significant differences in intakes of energy, protein, vitamins B1, B6, B12, Ca, Fe and Zn by SES groups. Generally, the nutrient intakes of the children decreased with decreasing SES groups (Table 4).
Table 4 Median of nutrient intakes of the children aged 12–23 months by socio-economic status groups

* χ 2 test (P<0·05).
† Multiple comparison test, high v. low P≤0·001, high v. medium-low P=0·016, high v. medium-high P=0·007.
‡ Multiple comparison test, high v. low P≤0·001, high v. medium-low P=0·012, high v. medium-high P=0·009.
§ Multiple comparison test, high v. low P=0·007, high v. medium-low P=0·009, high v. medium-high P=0·017.
|| Multiple comparison test, high v. low P=0·024, high v. medium-low P=0·040, high v. medium-high P=0·065.
¶ Multiple comparison test, high v. low P=0·016, high v. medium-low P=0·024, high v. medium-high P=0·039.
** Multiple comparison test, high v. low P≤0·001, high v. medium-low P<0·001, high v. medium-high P=0·133.
†† Multiple comparison test, high v. low P≤0·001, high v. medium-low P=0·034, high v. medium-high P=0·815.
‡‡ Multiple comparison test, high v. low P≤0·001, high v. medium-low P=0·038, high v. medium-high P=0·261.
Results from the multiple logistic regression (Table 5) reveal that there was not enough evidence to conclude that SES, sex of the children and family type influenced early initiation of breast-feeding and exclusive breast-feeding. Continued breast-feeding after 1 year was more likely in households with higher SES, female children and for children in extended families. SES, sex of the children and family type were not associated with the introduction of solid, semi-solid or soft foods, minimum dietary diversity, minimum meal frequency, minimum acceptable diet and consumption of Fe-rich or Fe-fortified foods at age 6 months.
Table 5 Socio-economic status’ (SES) correlates of children’s feeding practices (Odds ratios and 95 % confidence intervals)
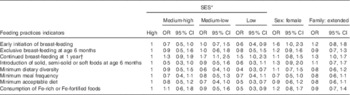
* Adjusted OR from multiple logistic regression, all OR are adjusted for children’s sex and family type.
† Significant difference.
Fig. 1 shows the proportion of children at risk of nutrient inadequacy by the SES group. The poorer the households, the higher the proportion of children at risk of nutrient inadequacy. Zn was the most-difficult-to-achieve nutrient. The proportion of children suffering from Fe inadequacy was similar across SES groups. This suggests that Fe-rich foods may be less available in the study area.
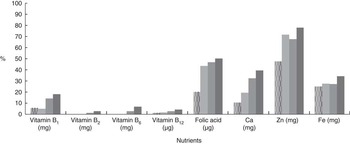
Fig. 1 Proportions of children aged 12–23 months at risk of nutrient inadequacy (intakes below estimated average requirement) by socio-economic status groups. ![]() , High;
, High; ![]() , medium-high;
, medium-high; ![]() , medium-low;
, medium-low; ![]() , low.
, low.
As illustrated in Fig. 2, fortified foods contributed to about 30 % of the micronutrient intake of the children in all SES groups. The contribution of fortified food intake among children in high SES households was higher than that among the other groups.
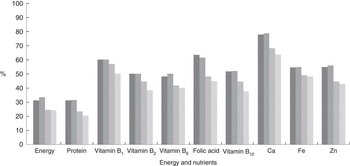
Fig. 2 Contribution of fortified food intake among children aged 12–23 months by socio-economic status (SES) groups. ![]() , High SES;
, High SES; ![]() , medium-high SES;
, medium-high SES; ![]() , medium-low SES;
, medium-low SES; ![]() , low SES.
, low SES.
Table 6 indicates that the double burden of malnutrition was emerging in this population. Undernutrition was a problem, and overnutrition had started to occur especially among the high and low SES groups. The prevalence of stunting and underweight among the low SES group (33·2 and 14·8 %, respectively) were double that of the high SES group (15·7 and 7 %, respectively, P<0·001). In addition, the highest proportion of overweight children was observed among children from the high SES group.
Table 6 Proportions of underweight, stunted, wasted and overweight children by socio-economic status (SES) groups (Percentages and 95 % confidence intervals)
* Compared with high SES (P<0·05).
Discussion
The present study describes how feeding practices of children aged 12–23 months differed across SES groups. Children from the high SES group were more likely to be exclusively breast-fed at 6 months, continue breast-feeding at 1 year, have minimum dietary diversity, achieve minimum acceptable diet and consume more Fe-rich or Fe-fortified foods. Nevertheless, these associations were not adjusted by potential confounders. After adjusting for sex and family type as confounders in the multivariate logistic regression, SES was only associated with continued breast-feeding at 1 year (Table 5). In this study, the percentage of children from the high SES group, who met the minimum dietary diversity was higher than those in the low SES group (87 v. 73·7 %, respectively, P=0·002). However, these figures were higher than the national prevalence rate, which shows that only 65 % of children aged 6–23 months meet minimum dietary diversity criteria( 12 ). The higher proportion of children who met minimum dietary diversity found in this study is possibly due to the fact that we focused only on children >1 year old, although the national data also include infants from 6 to 11 months old. The lower proportion of minimum dietary diversity among the low SES group may be explained through their consumption of more grains (which contain energy) but fewer foods from other food groups. This made their DDS lower than that of other children from the other SES groups. This is consistent with findings from another study where it was found that low SES children had unhealthy dietary habits and less-educated people on low incomes tended to consume more energy-dense food than did their higher SES counterparts who had higher fruit and vegetable intakes( Reference Konttinen, Sarlio-Lahteenkorva and Silventoinen 13 ). These observed relationships between SES and diet-quality measures suggest that SES variables may have a causal influence on diet quality and on diet cost( Reference Darmon and Drewnowski 14 ).
The present study found that the proportion of high SES children with nutrient inadequacy was significantly lower compared with children from the other SES groups. This can be explained by the fact that children from the high SES group had higher DDS as compared with the other groups (data not shown). This suggests that dietary diversity is essential for nutrient adequacy as no single food contains all required nutrients( Reference Allen, De Benoist and Dary 9 ). A previous study among non-breast-fed Filipino children showed that DDS is a significant predictor of adequate micronutrient intake( Reference Kennedy, Pedro and Seghieri 15 ). In the present study, inadequate intakes were found for folic acid, vitamin B1, Zn, Fe and Ca. These findings are consistent with another study, which showed that Fe, Zn and Ca are ‘problem nutrients’ in complementary feeding in developing countries( Reference Santika, Fahmida and Ferguson 16 ). In contrast, nutrient adequacy is also associated with the consumption of fortified food( Reference Berner, Keast and Bailey 17 ). In this study, we also found that fortified food made a large contribution to nutrient adequacy for many micronutrients in the children’s diet. This suggests that if fortified foods are omitted from the children’s diet, the proportion of children who meet nutrient recommendations will dramatically drop. Caregivers’ understanding of the significant role of fortified foods in young children’s diet needs to be strengthened. And equally important, the cost of fortified foods should be reduced so that they are affordable, especially for the lower SES groups( Reference Darmon and Drewnowski 14 ).
Undernutrition, especially stunting, was a major public health problem in the present study, particularly among children from the lower SES groups. The trend in the stunting rate across SES groups was similar to the pattern of the nutrient inadequacy, where the lower the SES group, the higher the stunting rate. Growth faltering may be the consequence of deficiency in one or several nutrients. In communities where stunting is prevalent, it is very likely that several nutrient deficiencies occur simultaneously among the stunted children( Reference Rosado 18 ). This indicates that the lower SES groups are constrained by their capacity to fulfil their needs to achieve their best health status and therefore are more vulnerable to potential shocks such as increases in food prices, unemployment, or even climate change for those dependent on agricultural livelihoods( Reference Barros, Victora and Scherpbier 6 ).
In summary, this study concludes that child-feeding practices were sub-optimal, particularly among low SES families, in Bandung city. Limitation of the study is the sample that was limited to children aged >1 year; hence, for those indicators, which should be asked to mother with children aged <1 year, are depended on recall, which are influenced by mother’s memory. The findings suggest that efforts to improve the diets and nutritional status of young children must consider the socio-economic gradient. Further research involving younger children may be worthwhile, particularly with a focus on the factors that may influence child-feeding practices in different socio-economic conditions.
Acknowledgements
The authors thank the children and mothers who were so willing to participate in this study, as well as voluntary health workers and local government of Bandung city, West Java province for their permission and cooperation.
This work was supported by PT Sarihusada Generasi Mahardhika and PT Nutricia Indonesia Sejahtera.
O. S., J. F. and I. A. contributed to the design of the study and acquisition, analysis and interpretation of the data. O. S. and J. F. drafted the initial manuscript. All authors have made substantial contributions to the manuscript’s draft. All authors have read and approved the final manuscript.
The authors declare that they have no conflicts of interests. The sponsors had no involvement in the study design, collection, analysis and interpretation of data, as well as in the writing of the manuscript and in the decision to submit it for publication.


