


Worldwide almost 300 000 patients with end-stage kidney disease are treated by peritoneal dialysis (PD). Clearance of the waste products of metabolism that accumulate in PD patients with end-stage kidney disease is achieved by transportation from capillaries in the peritoneal cavity to the peritoneal dialysate, with small solutes moving predominantly by diffusion and larger solutes and fluid by convection. The majority of PD dialysates use glucose to provide the osmotic driving force for the convective removal of water and Na. However, higher glucose concentrations in the peritoneal dialysate can lead to glucose diffusing from the peritoneal cavity back into the peritoneal capillaries. The amount of glucose potentially absorbed will depend upon the glucose concentration of the dialysates, cycle dwell time, fill volume and peritoneal transporter status(Reference Twardowski, Nolph and Khanna1). PD patients are advised to consume 146·44 kJ/kg per d (35 kcal/kg per d), although it is accepted that glucose absorption from the dialysate may provide 1674–3347 kJ/d, and this should be considered as part dietary intake(Reference Dombros, Dratwa and Feriani2,3) .
There is debate as to whether the potential glucose load from the peritoneal dialysate leads to changes in body composition. Multiple observational studies from both Northern and Southern Europe, South America and Asia have all reported no association between PD dialysate glucose exposure and increased body fat(Reference Pajek, Gucek and Kveder4–Reference Choi, Kim and Hong9), and similarly a prospective Dutch study comparing patients initiating dialysis showed no difference in weight gain between those starting haemodialysis compared with PD(Reference Jager, Merkus and Huisman10). However, studies comparing the impact of using one icodextrin exchange have reported a greater increase in weight and body fat in patients treated by continuous ambulatory PD (CAPD) prescribed only glucose dialysates compared with the icodextrin group(Reference Davies, Woodrow and Donovan11,Reference Cho, Do and Park12) .
Many of these reports came from small studies in CAPD patients which estimated glucose absorption based on the number of peritoneal glucose exchanges. As such we wished to determine whether measured glucose absorption was associated with changes in body composition measured using bioimpedance(Reference Davies and Davenport13), in a population treated by both CAPD and automated PD (APD) cyclers, after their first assessment of peritoneal membrane function, with a PD prescription designed for their peritoneal transporter status(14).
Patients and methods
We audited the results obtained when adult PD patients who had electively started PD attended for their first routine outpatient assessment of peritoneal membrane function(14), 2–3 months after catheter insertion and then when they returned 11–13 months later for a subsequent assessment of peritoneal membrane function. Prior to starting PD, all patients had attended a specialised clinic for patients with chronic kidney disease stage 4 and 5. Patients who had a delayed 1st or 2nd peritoneal membrane assessment due to PD peritonitis or an acute illness requiring hospitalisation and those prescribed chemotherapy were excluded (Fig. 1).
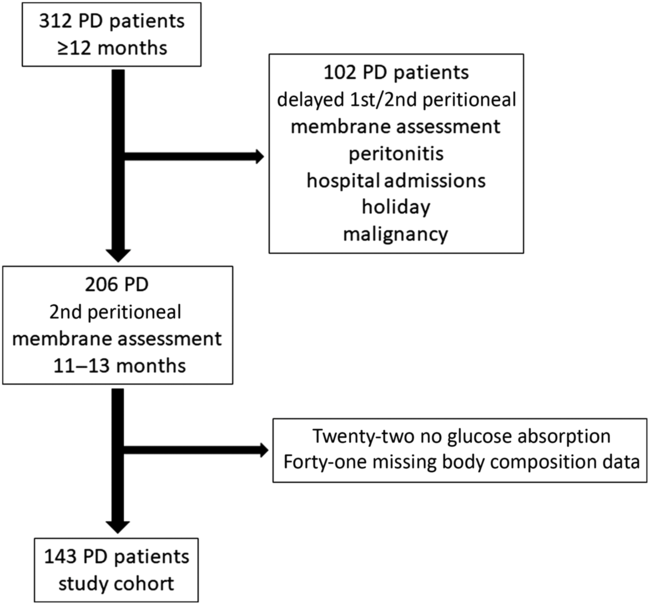
Fig. 1. CONSORT diagram showing study patient recruitment, starting with all patients who electively started peritoneal dialysis (PD) and were treated by PD for a minimum of 12 months.
Peritoneal transport assessment used a standard 2-litre 22·7 g/l dextrose exchange (Baxter Health Care), and body composition by bioimpedance was measured after drainage of peritoneal dialysate. No patient had suffered peritonitis in the 3 months prior to assessment. Patients with amputations, cardiac pacemakers or defibrillators were excluded from study as bioimpedance measurements were not made. Multifrequency bioelectrical impedance analysis used an eight-tactile electrode system, placed on both hands and both feet(Reference Davenport and Willicombe15,Reference Fürstenberg and Davenport16) . Height was measured by a standard wall-mounted measure (Sigmeas 1, Edward Doherty). PD bags were weighed pre-infusion, post-infusion and upon drainage using calibrated scales (MPSS250, Marsden).
Corresponding samples of spent dialysate effluent and serum biochemistry samples were analysed with a standard multichannel biochemical analyser, including glucose, creatinine using an enzymatic method to adjust for the potentially high glucose levels and albumin using the bromocresol green method (Roche Integra, Roche Diagnostics)(Reference Persaud, Thomas and Davenport17,Reference Rajakaruna, Caplin and Davenport18) . Twenty-four-h urine collections were analysed to determine urine volume and residual renal function and to determine weekly dialysis dose calculated as weekly Kt/Vurea and litres of creatinine cleared/1·73 m2, and normalised protein N appearance was calculated by standard methods(14,Reference Vongsanim, Salame and Eaton19) . The volume of PD dialysate used was determined by the in-flow volume recorded by APD cyclers, and for CAPD, patients were instructed to allow 15 s for the flush before fill, and we measured this volume in the sitting position, with a median volume of 90 ml, which was used to adjust for the volume of dialysate, and glucose instilled for CAPD patients. Glucose absorption was calculated by deducting the glucose drained out in the 24-h peritoneal dialysate effluent from the total instilled. Patient PD prescriptions were altered according to modality and patient transport characteristics of the first assessment of peritoneal membrane function but then maintained until the follow-up bioimpedance measurements. Glucose absorption was calculated at the time of the repeat assessment of body composition.
We used the Stoke–Davies co-morbidity and Rockwood frailty scales(Reference Davies, Phillips and Naish20,Reference Rockwood, Song and MacKnight21) .
Ethics
Our retrospective audit complied with the UK National Health Service guidelines for clinical audit and service development with all patient data anonymised and complied with UK National Institute for Clinical Excellence best practices (www.nice.org.uk/media/796/23/bestpracticeclinicalaudit.pdf).
Statistical methods
Statistical analysis used the D’Agostino Pearson test for analysis of normality, followed by χ 2 adjusted for small numbers and ANOVA or Kruskal–Wallis, with appropriate correction for multiple testing, by Tukey or Games–Howell methodology. Univariate analysis was done by Spearman’s correlation. A logistic regression model on absorption above and below the median, based on variables associated with glucose absorption of P ≤ 0·1, was constructed, with variables then excluded if not significant in a step-backwards, analysis unless they improved the model strength (SPSS version 22.0 (IBM) and GraphPad Prism version 8.1). Data are presented as mean values and standard deviations, medians and interquartile ranges, or means and 95 % CI, or as percentages.
Statistical power calculation
For our exploratory observational study of PD patients in a single centre, we reviewed the number of patients reported in earlier studies, which ranged from 20 to 85(Reference Dombros, Dratwa and Feriani2–Reference Nordfors, Heimbürger and Lönnqvist6,Reference Jager, Merkus and Huisman10) . The number of PD patients in a single centre in the UK is far less than that for haemodialysis. We aimed to include twice as many patients as the earlier studies and were able to report on 143 patients who had electively started on PD.
Results
We reviewed the results from 206 patients starting PD between April 2005 and December 2016. Sixty-three patients were excluded due to missing glucose absorption or bioimpedance data (Fig. 1). We analysed the data from 143 PD patients: eighty-nine (62·2 %) males, fifty-four (37·8 %) females, fifty-three (37·1 %) diabetics, with an average age of 61 years. The majority of patients, ninety (62·1 %) were treated by APD cyclers with a daytime icodextrin exchange and thirty-seven (25·9 %) by CAPD (Table 1). No patient was prescribed 38·6 g/l or 42·5 g/l glucose dialysates. Overall, there was an increase in fat mass and a fall in fat-free mass after a follow-up of 11–13 months from the first to the second assessment of peritoneal membrane function.
Table 1. Patient demographics†
(Numbers and percentages; medians and interquartile ranges (IQR); mean values and standard deviations)

APD, automated peritoneal dialysis; CAPD, continuous ambulatory peritoneal dialysis; Kt/V, weekly urea clearance; PD, peritoneal dialysis; UF, ultrafiltration; nPNA, normalised protein appearance rate; urine clearance, combined urinary urea and creatinine clearance; D/P, dialysate to plasma ratio; BSA, body surface area; FM, fat mass; FFM, fat-free mass; HbA1c, glycated Hb; CRP, C-reactive protein.
* P < 0·05 ** P < 0·01, *** P = 0·001 v. lower glucose absorption group.
† Patients divided according to below and above median daily glucose absorption.
Dividing patients above and below the median glucose absorption, then patients with greater glucose absorption were more likely to be male and treated by APD and have less residual renal function and with greater use of 22·7 g/l glucose dialysates and peritoneal ultrafiltration (Table 2). Those patients with greater glucose absorption had a greater increase in fat weight and loss of fat-free mass.
Table 2. Patient demographics†
(Numbers and percentages; medians and interquartile ranges (IQR); mean values and standard deviations)

APD, automated peritoneal dialysis; CAPD, continuous ambulatory peritoneal dialysis; Kt/V, weekly urea clearance; UF, ultrafiltration; nPNA, normalised protein appearance rate; urine clearance, combined urinary urea and creatinine clearance; D/P, dialysate to plasma ratio; BSA, body surface area; FM, fat mass; FFM, fat-free mass; HbA1c, glycated Hb; CRP, C-reactive protein.
* P < 0·05 ** P < 0·01, *** P = 0·001 v. APD.
† Patients divided according to peritoneal dialysis (PD) modality.
We then compared PD modality, and both patients treated by CAPD and those by APD with a daytime exchange were faster peritoneal transporters and prescribed more 2·27 g/l dialysates and icodextrin compared with those treated by overnight APD, and the APD patients had greater renal urea clearance (Kt/Vurea) (Table 2). Fat mass did not differ, but patients treated by APD with a daytime exchange had greater fat-free mass. Fat mass generally increased with all PD modalities, whereas fat-free mass fell.
Spearman univariate correlation coefficients demonstrated a significant association between glucose absorption and the prescription of 22·7 g/l PD dialysates, number of PD cycles, peritoneal urea clearance, body surface area and fat-free mass, and negative association with residual renal function, normalised protein N appearance and blood sugar (Table 3). Increasing peritoneal glucose absorption was associated with an increase in percentage body fat (r 0·214, P < 0·05) and reduction in lean BMI (r –0·231, P < 0·01). Glucose absorption was greater for males 209·4 (98·9–292·7) mmol/d compared with females 98·3 (26·3–241·6), P = 0·004, and the change in fat mass was greater for male patients (r 0·32, P = 0·002) (Fig. 2). Similarly, the loss of fat-free mass was greater for males (Fig. 3), as was soft lean mass (r –0·29, P = 0·006), compared with females (r –0·10, P = 0·46). However, for both sexes, there was an association between a gain in fat weight and loss of fat-free mass (Fig. 4). There was no association between glucose absorption, change in fat mass or lean body mass and either co-morbidity or frailty scores. Adjusting fat mass for height, then there was an association between glucose absorption and the change in fat mass index (r 0·17, P = 0·04). Comparing patients above and below the median glucose absorption, then those with higher glucose absorption had a greater increase in fat mass index (χ 2 = 6·9, P = 0·032).
Table 3. Spearman univariate analysis with daily glucose absorption as a dependent variable


Fig. 2. Spearman univariate correlation between daily glucose absorption from peritoneal dialysate and change in fat mass for both men (ρ = 0·32, P = 0·002) and women (ρ = 0·17, P = 0·22). ![]() , Female;
, Female; ![]() , male.
, male.

Fig. 3. Spearman univariate correlation between daily glucose absorption from peritoneal dialysate and change in fat-free mass for both men (ρ = –0·28, P = 0·007) and women (ρ = –0·09, P = 0·51). ![]() , Female;
, Female; ![]() , male.
, male.

Fig. 4. Spearman univariate correlation between change in fat mass and change in fat-free mass for both men (ρ = –0·40, P = 0·001) and women (ρ = –0·46, P = 0·004). ![]() , Male;
, Male; ![]() , female.
, female.
A multivariable regression model comparing patients above and below the median glucose absorption showed that higher glucose absorption was associated with increased prescription of 22·7 g/l glucose PD dialysates, greater peritoneal urea clearance, male sex and for non-diabetics (Table 4). Similarly, a greater increase in fat mass index was associated with 22·7 g/l glucose dialysates (β 0·08, seβ 0·03, standardised β 0·19, 95 % CI 0·008, 0·14) and negatively with normalised protein N appearance (β –1·35, seβ 0·61, standardised β –0·19, 95 % CI –2·56, –0·14).
Table 4. Backward logistic regression model of daily glucose absorption above and below the median*
(β-Coefficients with their standard errors; odds ratios and 95 % confidence intervals)

22·7 g/l, 22·7 g/l glucose dialysate; Kt/VPD, weekly peritoneal urea clearance.
* Nagelkerke r 2 0·68.
Discussion
PD patients aged <60 years are advised to consume 14 644 kJ/d, and those >60 years, 12 552 kJ/d, but this includes glucose absorbed from the dialysates. In clinical practice, there are now both glucose-containing and non-glucose-containing dialysates; although the median amount of glucose absorbed in our cohort was 519 kJ/d, this ranged from a net loss of glucose up to 2234 kJ/d. Many previous studies from Europe, Asia and South America have all failed to demonstrate an effect of glucose administration on increasing body fat(Reference Pajek, Gucek and Kveder4–Reference Jager, Merkus and Huisman10). One of the confounders is that patients may be uraemic prior to starting PD and malnourished, so gain weight as a consequence of the reduction in uraemic toxins and improved nutrition(Reference Choi, Kim and Hong9). In addition, assessment of peritoneal membrane function is often delayed several weeks after initiation of PD(Reference Twardowski, Nolph and Khanna1,14) , so PD prescriptions may not initially be the most appropriate for the individual patient. To reduce these confounding effects, we studied patients who had been previously reviewed in a specialist clinic preparing patients for dialysis prior to an elective initiation of PD and then waited until after their first assessment of peritoneal membrane function, so that PD prescriptions were altered for transporter status(Reference Twardowski, Nolph and Khanna1,14) , and then after approximately 12 months, when patients attended for further assessment of peritoneal membrane function. Similarly, to avoid the potential confounding effects of acute illness on body composition, we excluded patients with PD peritonitis and those with acute hospital admissions.
Previous estimates have proposed that CAPD patients using a combination of 13·6 g/l and 22·7 g/l could potentially absorb about 238 mmol glucose/d and patients using an APD cycler with all glucose exchanges, including a daytime glucose exchange 488 mmol/d(Reference Burkart22). As we used icodextrin exchanges and also took into account the flush-before fill technique, then the amount of glucose exposure was reduced in our CAPD patients compared with earlier studies which used all glucose exchanges and did not account for the flush-before fill technique(Reference Burkart22,Reference McCafferty and Fan23) . Rather than following many previous studies which simply used the amount of glucose in the dialysate prescribed(Reference Caron-Lienert, Poli-de-Figueiredo and Figueiredo7,Reference Choi, Kim and Hong9,Reference Bazanelli, Kamimura and da Silva24) , we calculated glucose absorption by measuring the 24-h peritoneal glucose balance and found that patients with greater peritoneal glucose absorption gained more fat weight and lost more fat-free mass over time. Previous studies which have used bioimpedance to assess changes in body composition have reported no increase in fat weight associated with glucose exposure(Reference Caron-Lienert, Poli-de-Figueiredo and Figueiredo7,Reference Choi, Kim and Hong9) . However, these studies included incident patients and bioimpedance measurements made with peritoneal dialysate instilled within the abdomen, which is reported to lead to inaccuracy in assessments of body composition, with an overestimation of fat weight(Reference Davenport25,Reference Davenport26) .
We report the largest cohort of PD patients starting PD electively and demonstrate that increasing intra-peritoneal glucose absorption leads to not only an increase in body fat but also a reduction in the measurements of fat-free mass and soft lean mass. This was greatest for patients with less residual renal function who required greater peritoneal urea clearance and ultrafiltration and larger-sized patients, males more than females. Larger-sized patients, typically males, and those with less residual renal function were prescribed more 22·7 g/l glucose dialysates.
On the other hand, patients with diabetes were less likely to have an increase in fat weight, as presumably higher blood glucose concentrations reduced the peritoneal to blood gradient and potentially reduced glucose absorption. Previous studies have commented on diabetic PD patients being at increased risk of increases in extracellular water, but not fat weight gain(Reference Udo, Goodlad and Davenport27,Reference Davenport and Willicombe28) .
Glucose absorption and the prescription of 22·7 g/l glucose dialysates were greater for those patients treated with APD and a daytime icodextrin exchange, and although the median increase in fat weight was higher and loss of fat-free mass greater for these patients, it was not statistically different from that of patients treated by APD and CAPD. Similarly, peritoneal transport status did not differ between patients treated by CAPD and those by APD with a daytime icodextrin exchange, and peritoneal transporter status was not a significant factor for peritoneal glucose absorption. After the first assessment of peritoneal membrane function, PD prescriptions were altered according to the peritoneal transporter status(Reference Twardowski, Nolph and Khanna1,Reference Davies and Davenport13) , such as shortening dwell times for faster transporters, and as such could have reduced the potential for greater glucose absorption.
Many previous reports failed to demonstrate an association between peritoneal glucose exposure and a gain in body fat(Reference Vasselai, Kamimura and Bazanelli8,Reference Little, Phillips and Russell29,Reference Wang, Axelsson and Nordfors30) . However, studies replacing a single 2·27 g/l PD exchange with icodextrin have demonstrated a reduction in fat weight(Reference Davies, Woodrow and Donovan11,Reference Cho, Do and Park12) , supporting a role for intraperitoneal glucose absorption and fat weight gain.
Whereas several studies which recruited incident patients reported an increase in both muscle mass and fat gain, or similar increases compared with incident haemodialysis patients(Reference Jager, Merkus and Huisman10,Reference Choi, Park and Kim31) , in our prevalent cohort, we noted that fat weight gain was associated with a reduction in muscle mass. Previous reports have suggested that PD patients have low levels of active energy expenditure(Reference El-Kateb, Sridharan and Farrington32,Reference El-Kateb, Sridharan and Farrington33) , and whether those who gain fat are less active requires further exploration.
Our male patients absorbed about an average of 37·6 g/d (209 mmol/d) of glucose, which would equate to 628 kJ/d and potentially more than 209 200 kJ in a year. Assuming an equivalent for fat gain (39 748 kJ/kg), then if patients did not change their diet or physical activity levels, then this could have led to a 5 kg increase in fat mass. However, the average fat mass gain was 2 kg, and previous studies have reported that PD patients have a blunted hunger profile compared with haemodialysis patients and healthy controls(Reference Wright, Woodrow and O’Brien34), which would potentially suggest that glucose absorption from the dialysate reduces enteral energy intake. We were unable to measure the physical activity of our patients and did not have an accurate assessment of dietary intake. However, we found no association between glucose absorption or changes in body composition compared with frailty, using the Rockwood frailty score which is based on physical capability(Reference Rockwood, Song and MacKnight21), and similarly no association with co-morbidity(Reference Davies, Phillips and Naish20). On the other hand, we noted that there was a negative association between peritoneal glucose absorption and N appearance rate, suggesting that patients reduced dietary protein intake rather than increased energy expenditure. In addition, models used to calculate changes in fat mass often do not take into account the effect of starting body composition(Reference Hall35) and have not been validated for our dialysis population.
We report an observational study in a cohort of patients electively started on PD with pre-dialysis care in a specialised chronic kidney disease clinic. By following these patients from after their first assessment of PD membrane function for approximately 12 months, and despite the high proportion of patients prescribed icodextrin and avoidance of the very hypertonic glucose PD dialysates, we have demonstrated an association between intra-peritoneal glucose absorption and fat weight gain, and also a loss of fat-free weight and other estimates of muscle mass. Increased peritoneal glucose absorption was associated with a reduction in N appearance rate, suggesting a reduced dietary protein intake. Our observational study suggests a hypothesis which will require prospective testing.
Acknowledgements
A. D. conceived the audit. A. D. applied for audit registration and approvals. S. L. collated and analysed primary data. A. D. and S. L. analysed secondary data. S. L. and A. D. contributed to and approved final manuscript draft.
The authors have no conflicts of interest.


