


Obesity is a multifactorial condition that can lead to serious health problems. It develops from complex interactions between a wide array of environmental and genetic factors, and marked individual aetiological differences justify the use of personalised interventions to prevent and treat obesity.
The control of food intake and energy balance implies a dynamic interaction between biological/physiological and behavioural/psychological factors( Reference Hopkins and Blundell 1 ). Satiation and post-ingestive satiety efficiency vary greatly between individuals. Studies show that some individuals (both non-obese and obese) have difficulty to recognise their appetite sensations before and after a substantial energetic load( Reference Barkeling, King and Näslund 2 ). This ‘low satiety phenotype’ (LSP) has been observed in approximately 10 % of obese patients consulting for weight loss in our nutrition clinic( Reference Drapeau, Hetherington and Tremblay 3 ), and has been associated with higher reported and measured energy intakes( Reference Drapeau, Blundell and Therrien 4 , Reference Drapeau, King and Hetherington 5 ). LSP individuals are characterised by a difficulty to detect changes in their appetite sensations throughout the day, a weak satiety response to a meal, and in some cases by an increase in appetite after a meal( Reference Barkeling, King and Näslund 2 , Reference Drapeau, Blundell and Gallant 6 ). In one study, higher disinhibition scores from the Three-Factor Eating Questionnaire (TFEQ), an eating behaviour trait that indicates a higher susceptibility for overconsumption on a regular basis, were also reported( Reference Barkeling, King and Näslund 2 ). Consequently, it has been hypothesised that the LSP individuals could be more vulnerable to weight gain and resistance to weight loss( Reference Drapeau, Blundell and Gallant 6 ).
Energy restriction remains largely used as the obvious approach to induce weight loss in the management of obesity. However, there is ample evidence to suggest that the long-term effects of energy-restricted diets on body weight in individuals with obesity is at best modest, and long-term weight regain is observed in the majority of individuals( Reference Langeveld and DeVries 7 ). This can be explained, in part, by some negative effects on appetite control that result from fat mass loss, such as an increase in hunger and desire to eat( Reference Gilbert, Joanisse and Chaput 8 ). Thus, there is a need to study weight control strategies that promote a spontaneous energy deficit without significantly altering hunger and satiety levels and that take into account individual differences in satiety responsiveness. One promising alternative could be the combination of multiple functional foods that are known for their satiety-enhancing properties in order to develop a ‘highly satiating’, healthy and non-restrictive diet, that could be maintained over the long term. Food properties or functional agents that may influence satiation and satiety and/or create a spontaneous decrease in energy intake include low energy density( Reference Rolls 9 ), and a higher content of protein (>20 % of energy from protein)( Reference Anderson and Moore 10 , Reference Halton and Hu 11 ), dietary fibre( Reference Dahl and Stewart 12 ), long-chain n-3 fatty acids( Reference Parra, Ramel and Bandarra 13 ), dietary Ca( Reference Gonzalez, Green and Brown 14 ) and capsaicinoids( Reference Tremblay, Arguin and Panahi 15 ).
Even though these food-related factors have been shown to help short-term appetite control under standardised laboratory conditions, it is unclear whether their combination could benefit obese individuals, including those who express low satiety responsiveness, during the weight loss process. The objective of this study was to evaluate the impact of a non-restrictive (ad libitum), highly satiating diet on body weight and composition, satiety responsiveness, eating behaviour traits and adherence in obese men displaying large variations in their satiety efficiency. We hypothesised that, compared with a non-restrictive conventional dietary plan based on the Canadian Food Guide( 16 ), the highly satiating diet would result in greater decreases in body weight and fat mass, a better satiety responsiveness, more desirable changes in eating behaviour traits and a higher adherence rate in individuals characterised by low or high satiety responsiveness.
Methods
Participants
In all, seventy-five men were recruited through physicians and media from the Quebec City area. Eligibility of the participants was first determined by a telephone interview. Inclusion criteria were: aged between 30 and 50 years, obese (BMI between 30 and 40 kg/m2), overall good health, no medications which could influence appetite sensations (hormones, tranquilisers such as chlorpromazine and benzodiazepin, lithium carbonate, ciproheptadin, antihistaminic, serotonin antagonist, sulfonylurea and glucocorticoids), no body weight variations of more than 4 kg over the last 2 months, and being sedentary to moderately active (i.e. participating in moderate to vigorous physical activity ≤3×30 min/week). Eligible participants were then invited to a screening visit to confirm the inclusion criteria and to present the details of the project. Dietary restriction was also assessed at the screening visit with the use of the TFEQ( Reference Stunkard and Messick 17 ) and restrained participants (i.e. cognitive restraint score >10) were excluded. After the screening session, six participants were excluded (three for high fasting glucose/diabetes, one for high TAG, one for hypothyroidism and one for lack of motivation). The remaining sixty-nine participants were selected to participate in the study. This study was conducted according to the guidelines laid down in the Declaration of Helsinki and all procedures involving human subjects were approved by the Laval University Ethics Committee in Health Sciences and the Quebec Heart and Lung Institute/Research Center Ethic Committee (protocol record MOP-68858). Written informed consent was obtained from all subjects. Trial registration no.: NCT03128697 (https://clinicaltrials.gov).
Experimental design
The study design consisted of two phases (weight stabilisation and weight loss) and three experimental visits (V): satiety efficiency categorisation (V1), baseline measurements (V2) and post-study measurements (V3) (Fig. 1). After the weight stabilisation phase and baseline measurements (V2), participants (n 69) were randomly assigned to either an ad libitum experimental diet (n 35) or ad libitum control diet (n 34) for a 16-week period.
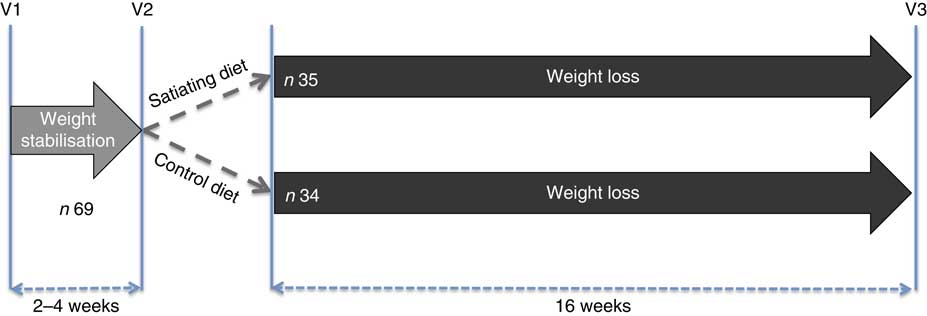
Fig. 1 Experimental design. V1, satiety efficiency categorisation; V2, baseline measurements; V3, post-tests.
Satiety efficiency categorisation (V1)
Participants arrived at the laboratory at 08.00 hours following a 12-h overnight fast and were invited to consume a standardised breakfast to evaluate their appetite sensations and determine the satiety quotient (SQ) for each appetite sensation. They had been instructed not to consume alcohol or engage in structured physical activity for at least 24 h before testing. The breakfast test meal consisted of white bread, butter, peanut butter, Cheddar cheese and orange juice, and had to be eaten within a 20-min period. The meal was designed to provide 14, 42 and 44 % of total energy as protein, fat and carbohydrate, respectively, and an energy content of 3067 kJ (733 kcal). Appetite sensations (desire to eat, hunger, fullness and prospective food consumption (PFC)) were assessed by 150 mm visual analogous scales (VAS) adapted from Hill & Blundell( Reference Hill and Blundell 18 ), before, immediately after and at 10 min intervals until 1 h after the breakfast. The last two VAS measurements were performed 90 and 120 min after the breakfast. The following questions were asked on the VAS: (1) How strong is your desire to eat? (‘very weak’ to ‘very strong’), (2) How hungry do you feel? (‘not hungry at all’ to ‘as hungry as I have ever felt’), (3) How full do you feel? (‘not full at all’ to ‘very full’), and (4) How much food do you think you could eat? (‘nothing at all’ to ‘a large amount’). VAS measurements were always performed in the same environment (i.e. alone in a quiet room, at the same table, in the same room with the same lighting that was kept free of odours and sounds as well as other potentially confounding factors (visual stimuli, individuals in the room, etc.)). Under these conditions, VAS measurements in our laboratory have been shown to be highly reliable both before and in response to a meal( Reference Arvaniti, Richard and Tremblay 19 ). The satiety efficiency of each individual (referred to as the SQ for desire to eat, hunger, fullness and PFC as well as the mean SQ) was calculated with the following equation( Reference Drapeau, Blundell and Therrien 4 ):
 $$\eqalignno{&{\rm SQ}\,\left( {{\rm mm}\,/\,418\,{\rm kJ}\,\left( {100\,{\rm kcal}} \right)} \right)\cr {\equals}&{{{\left( \displaystyle {{\rm fasting}\,{\rm appetite}\,{\rm sensations}\,\left( {{\rm mm}} \right)\,{\minus}\,{\rm mean}\,{\rm of}\,{\rm the}\,\atop\displaystyle 60{\hbox-}\!\min \,{\rm post}{\hbox-}{\rm meal}\,{\rm appetite}\,{\rm sensations}\,\left( {{\rm mm}} \right)} \right)}} \over {{\rm energy}\,{\rm content}\,{\rm of}\,{\rm the}\,{\rm test}\,{\rm meal}\,\left( {{\rm kJ}\,{\rm (kcal)}} \right)}}{\times}100.}$$
It is important to note that the SQ calculation for fullness is reversed (the mean post-meal rating – fasting rating). The theoretical range of possible SQ values is between −20·5 and 20·5 mm/418 kJ (100 kcal). A higher SQ for each of the appetite sensations represents a stronger appetite response to ingested food whereas a lower SQ represents a weaker response.
The low satiety phenotype
The mean of the SQ (mean SQ) for the four different appetite sensations was used to classify the participants according to their individual satiety efficiency (high v. low). Individuals with a mean SQ <8 mm/418 kJ (100 kcal) were classified as having a low appetite response to a meal (i.e. the LSP), whereas those with an SQ ≥8 mm/418 kJ (100 kcal) were classified as the high satiety phenotype (HSP), as previously described( Reference Drapeau, Blundell and Gallant 6 ). The reliability of the SQ as a marker of satiety efficiency has been demonstrated under controlled laboratory conditions in men( Reference Drapeau, Blundell and Gallant 6 ) and women( Reference Dalton, Hollingworth and Blundell 20 ).
Weight stabilisation phase
After the first experimental visit (V1), participants were instructed to keep their weight and lifestyle stable for the next 2–4 weeks.
Baseline measurements (V2)
After the weight stabilisation phase, participants returned to the laboratory for a second experimental visit (V2). They arrived at the laboratory at 08.00 hours following a 12-h overnight fast and had been instructed not to consume alcohol or engage in structured physical activity for at least 24 h before testing.
Anthropometric and body composition measurements
Upon arrival, height and waist circumference were measured according to standardised procedures( 21 ), and body weight and composition (fat mass, lean body mass and percent fat mass) were measured by dual-energy X-ray absorptiometry (DXA; GE Medical Systems Lunar). BMI was calculated as DXA body weight divided by height squared (kg/m2). Of note, for each DXA measurement, participants arrived in the same condition (i.e. being fasted, rested and well-hydrated).
Eating behaviour traits assessment
Participants completed a French version of the fifty-one-item TFEQ( Reference Stunkard and Messick 17 ). This questionnaire measures the three following dimensions of human eating behaviours: cognitive dietary restraint (intent to control food intake), disinhibition (overconsumption of food in response to cognitive or emotional cues) and susceptibility to hunger (food intake in response to feelings and perceptions of hunger). It is also possible to distinguish two types of cognitive dietary restraint behaviours: flexible control and rigid control of eating( Reference Westenhoefer, Stunkard and Pudel 22 ). The TFEQ is a reproducible and valid tool( Reference Stunkard and Messick 17 , Reference Laessle, Tuschl and Kotthaus 23 ) and the French version has been previously validated( Reference Lluch 24 ).
Satiety responsiveness measurement
A standardised breakfast was served at 08.30 hours (see the ‘Satiety efficiency categorization (V1)’ for a complete description of the procedure). The purpose of this standardised breakfast was to assess the baseline satiety responsiveness of participants (SQ for desire to eat, hunger, fullness, PFC as well as the mean SQ).
Weight loss phase
Dietary interventions
No energetic restriction was prescribed in either of the diets. The experimental diet was designed to be highly satiating and induce a spontaneous energy deficit. This diet was characterised as follows: low energy density, high micronutrient density, particularly Ca, moderate in fat (30–35 % of total energy intake, mainly PUFA), high in fibre (>25 g/d), high in protein (20–25 % of total energy intake) and included 45–50 % energy as carbohydrate mainly provided by non-processed foods with a low glycaemic index (Table 1). Participants received a specific listing of highly satiating foods in order to help them with their food choices (Table 2). They were instructed to choose the majority of their daily food items from this food list. In order to facilitate diet adherence to the prescribed diet and preparation of healthy satiating meals, one main course per day (lunch or dinner) was provided to each subject on a weekly basis. These meals were served in large portions (four servings per meal) in order to let the participants eat until satiation was reached. They were low energy density (<6·3 kJ/g (<1·5 kcal/g)), made with mostly low glycaemic index foods (glycaemic index factor ≤55( Reference Foster-Powell, Holt and Brand-Miller 25 )), and contained capsaicin (red chili pepper). One serving of each meal provided <2092 kJ (<500 kcal), >25 % energy from proteins, <25 % energy from lipids (mainly PUFA and MUFA) and >8 g of fibres (see e.g. satiating meal( Reference Poortvliet, Bérubé-Parent and Drapeau 26 )). Participants were encouraged to consume this satiating diet until satiety for a 16-week period even if a resistance to weight loss was observed during the protocol. The control diet (Table 1) provided 10–15 %, 55–60 and 30 % energy as protein, carbohydrate and lipid, respectively. Food was self-selected with the help of nutritional guidelines based on the Canadian Food Guide( 16 ) and under supervision of the nutritionist. Participants were not aware that the guidelines were coming from the Canadian Food Guide. In both groups, individual follow-up visits (every 2 weeks) with a nutritionist were provided and permitted the assessment of compliance and dietary intakes. Of note, neither of the diets were restrained in carbohydrates (both diets were >45 % carbohydrates) and there were no acute changes in the diet composition throughout the study (i.e. participants followed the same diet for a 16-week period). Moreover, no exercise prescription was included in this intervention and participants were asked to maintain their same low physical activity level.
Table 1 Description of the control and the satiating diets
Table 2 Dietary guidelines and examples of portion size for the satiating diet
Post-study measurements (V3)
Anthropometric measures and body composition, eating behaviour traits and satiety responsiveness were reassessed immediately after the 16-week intervention period.
Statistical analyses
The sample size was originally calculated based on the main outcome of this study (i.e. to induce a significant weight loss after 16 weeks on a highly satiating diet) and revealed that for an α ≤0·05 and a 1-β of 95 %, a total of only forty-seven participants would be needed in order to detect a 3·5 kg difference between the pre and post intervention with a sd of 1·5. Based on our previous studies, a dropout rate of 30 % was anticipated increasing the number of participants to sixty-eight participants. The sample size of sixty-nine participants, 35 in the intervention and 34 in the control group, offered about 94 % power to detect an effect size of 0·25 in continuous outcomes (e.g. body weight) and an α≤0·05 two-sided type I error rate.
Baseline characteristics were obtained for all participants. Statistical analysis of differences between the groups was performed using a two-factor mixed ANOVA for independent groups. A student t test was used to compare baseline characteristics between completers and dropouts. A paired t test was used to compare baseline and post-intervention values within the groups. A two-factor mixed ANOVA for independent groups was used to evaluate the effect of diet (control diet v. satiating diet), satiety phenotype (LSP v. HSP) and the diet×SP interaction on changes in body weight, body composition, energy intake and SQ following the dietary interventions. These analyses were adjusted for baseline values for each variable. Data were expressed as means and standard deviations and statistical significance was set to a P<0·05. All statistical analyses were performed using the JMP software version 12.0 (SAS Institute, Cary, NC, USA).
Results
Baseline characteristics
Baseline characteristics of all participants are presented in Table 3. There were no significant differences in anthropometric measures. As expected, the SQ for each appetite sensation and the mean SQ were significantly different between the satiety phenotype subgroups (LSP v. HSP). With the exception of the disinhibition score, which was significantly higher in the satiating diet group (P=0·004), there were no differences between groups for eating behaviour traits.
Table 3 Baseline characteristics of the participants (Mean values and standard deviations)
LSP, low satiety phenotype; HSP, high satiety phenotype; SP, satiety phenotype; SQ, satiety quotient; PFC, prospective food consumption.
Adherence
Of the sixty-nine men who were randomised into the diet groups, fifty-one completed the study (control diet: n 19; satiating diet: n 32). Dropout rates were higher in the control diet (44·1 %) compared with the satiating diet (8·6 %). Six LSP and nine HSP individuals dropped out of the control diet, whereas two LSP and one HSP individual dropped out of the satiating diet. In the control group, the reasons for dropping out were: lack of availability or time (5/15), lack of motivation (4/15), dissatisfaction with the diet (1/15) or the nutritional follow-up (1/15), wanting to start the Atkin’s diet (1/15), wanting to enroll in a physical activity programme (1/15), job loss and emotional shock (1/15), and no longer responding (1/15). In the satiating group, the reasons for dropping out were: dissatisfaction with the prepared meals (1/3), lack of time (1/3) and no longer responding (1/3).
Table 4 compares the baseline characteristics between the completers and dropouts, irrespective of the diet group. Percent fat mass, which was significantly higher in the dropouts than the completers (P=0·021), was the only difference. Further comparisons of baseline characteristics between completers (n 19) and dropouts (n 15) inside the control group were done. Percent fat mass was higher in the dropouts than the completers (P=0·006, results not shown) and there was a tendency for the dropout participants to show higher rigid control than the completers (P=0·058, results not shown).
Table 4 Comparison of the baseline characteristics of the completers and dropouts (both diet groups) (Mean values and standard deviations)
SQ, satiety quotient; PFC, prospective food consumption.
Comparison between baseline and post-intervention values
Table 5 compares baseline and post-intervention values within each subgroup and shows an effect of diet, satiety phenotype and their interaction following the intervention.
Table 5 Changes in anthropometric measures, satiety responsiveness and eating behaviour traits in the completers (Mean values and standard deviations)
LSP, low satiety phenotype; HSP, high satiety phenotype; SP, satiety phenotype; SQ, satiety quotient; PFC, prospective food consumption.
Post-intervention values were significantly different from baseline values: * P<0·05, ** P<0·01, *** P<0·001, † P between 0·05 and 0·095.
Changes in anthropometric variables
Significant decreases in body weight, BMI and waist circumference were observed in all diet subgroups. Fat mass and lean body mass significantly decreased in the satiating diet (both LSP and HSP subgroups) and in the control group (HSP subgroups only). Lean body mass also decreased in the LSP-control subgroup (P=0·05). Percent fat mass was significantly reduced following the satiating diet only (LSP and HSP subgroups). After adjustment for baseline values, the analyses revealed a significant effect of diet on the changes in % fat mass, with greater decreases observed in both LSP and HSP individuals in the satiating compared with the control group (P=0·034; see Fig. 2). There was an effect of satiety phenotype on the changes in body weight and lean body mass, irrespective of diet allocation. The LSP individuals have lost significantly less weight (P=0·048) and lean body mass (P=0·033) than their HSP counterparts.
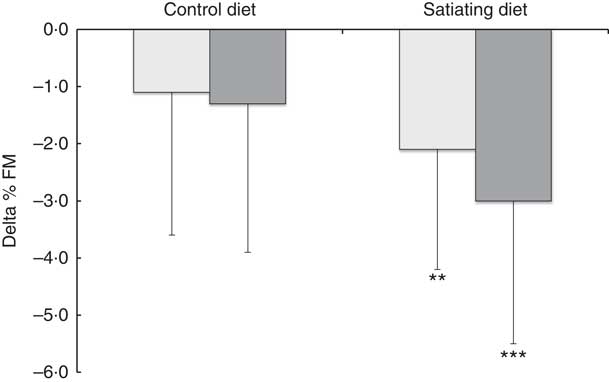
Fig. 2 Changes in percent fat mass (% FM) in the satiety phenotype subgroups following the weight loss programme. Values are means, with their standard deviations represented by vertical bars. ![]() , low satiety phenotype (LSP);
, low satiety phenotype (LSP); ![]() , high satiety phenotype (HSP). Percent fat mass significantly reduced following the satiating diet only (** P<0·01, *** P<0·001). There was a significant effect of diet on the changes in % FM, with greater decreases observed in both LSP and HSP individuals in the satiating compared with the control group (P=0·034). The effect of the satiety phenotype (P=0·42) and the interaction between diet and satiety phenotype (P=0·54) were not statistically significant.
, high satiety phenotype (HSP). Percent fat mass significantly reduced following the satiating diet only (** P<0·01, *** P<0·001). There was a significant effect of diet on the changes in % FM, with greater decreases observed in both LSP and HSP individuals in the satiating compared with the control group (P=0·034). The effect of the satiety phenotype (P=0·42) and the interaction between diet and satiety phenotype (P=0·54) were not statistically significant.
Changes in satiety responsiveness
Significant increases from baseline in satiety responsiveness (all SQ variables) for the LSP in the satiating diet were observed (all P<0·01). SQ hunger also significantly increased for the HSP individuals in the satiating diet (P<0·05). SQ PFC tended to decrease in the HSP-control subgroup (P=0·0504). There were no other significant changes in satiety responsiveness in the control group. After adjustment for baseline variables, there was a significant effect of diet for the changes in SQ hunger, fullness, PFC and mean SQ (all P<0·05), with greater increases in SQ for the satiating diet.
Changes in eating behaviour traits
The HSP individuals in the satiating diet showed significant increases in cognitive dietary restraint, flexible control and rigid control scores, and significant decreases in disinhibition and susceptibility to hunger scores. The HSP individuals in the control diet showed significant increases in cognitive dietary restraint, as well as tendencies for an increase in rigid control (P=0·0812) and a decrease in susceptibility to hunger (P=0·0925). The LSP individuals in the satiating diet showed a significant increase in cognitive dietary restraint and a decrease in disinhibition, as well as tendencies for an increase in flexible control (P=0·0864) and decrease in susceptibility to hunger (P=0·0691). The LSP individuals in the control diet showed tendencies for increases in cognitive dietary restraint (P=0·0565) and flexible control (P=0·0564), as well as a significant increase in rigid control and significant decreases in disinhibition and susceptibility to hunger. There was no significant effect of diet, SP or their interaction on the changes in eating behaviour traits.
Discussion
A major concern regarding conventional energy restriction approaches for the treatment of obesity is the lack of consideration for inter-individual differences in appetite control. Consequently, adherence to restrictive diets and weight management may become difficult. In this regard, the main objective of this study was to evaluate the impact of a non-restrictive (ad libitum), highly satiating diet on body weight and composition, satiety responsiveness, eating behaviour traits and adherence in obese men characterised by low or high satiety responsiveness.
Body weight and BMI were significantly reduced in the control and satiating diets. Not surprisingly, greater reductions in body weight were observed in HSP men (−5·4 to −6·6 % of initial body weight) compared with LSP men (−3·3 to −4·3 % of initial body weight), irrespective of treatment allocation. As a weight reduction of 5–10 % of initial body weight has been shown to have important health benefits( Reference Brown, Buscemi and Milsom 27 ), this may lead to positive overall health outcomes. Furthermore, the significant decrease in waist circumference observed in all subgroups also suggests that some loss of abdominal adipose tissue was obtained( Reference Villeneuve, Pelletier-Beaumont and Nazare 28 ), a reduction also predictive of improvements in the metabolic profile and cardiovascular health( Reference Despres, Lemieux and Bergeron 29 ).
The lower body weight loss observed in the LSP could be explained by their different behavioural and psychological characteristics. Accordingly, it has been shown that the LSP is associated with a higher disinhibition trait( Reference Barkeling, King and Näslund 2 , Reference Dalton, Hollingworth and Blundell 20 ), higher susceptibility for hunger and anxiety traits( Reference Drapeau, Blundell and Gallant 6 ) compared with the normal/HSP, which could increase their risk of overeating. Moreover, it has also been shown that these individuals present greater wanting for high-fat foods and express lower control over food cravings( Reference Dalton, Hollingworth and Blundell 20 ). Together, these observations suggest that the LSP could present more difficulties in following a weight loss diet intervention over time, resulting in lower body weight loss compared with the HSP. However, even though the LSP lost less body weight than the HSP, their body composition improved to the same extent as the HSP under the high satiating diet.
Interestingly, although absolute fat mass was not significantly decreased in the LSP individuals on the control diet, they displayed a significant reduction in their lean body mass. Moreover, there was a tendency (P=0·085) for significant loss in fat mass on the satiating diet compared with the control diet. As a result, significant decreases in % fat mass were observed in LSP (−2·1 %) and HSP (−3·0 %) individuals on the satiating diet only, who lost approximately two times more % fat mass than their LSP (−1·1 %) and HSP (−1·3 %) counterparts in the control group. This may be explained by the greater protein content of the satiating (20–25 %) compared with the control diet (10–15 %). In fact, evidence suggests that high intakes of total dietary protein (1·2–1·5 g/kg per d) may help preserve lean mass and improve body composition during weight loss in young, middle-aged, and older adults when compared with normal protein intakes (0·8 g/kg per d)( Reference Leidy, Carnell and Mattes 30 – Reference Wycherley, Moran and Clifton 32 ).
Both diets promoted a significant spontaneous energy deficit; however, only the satiating diet had a beneficial influence on satiety responsiveness. In the control diet, SQ did not change or tended to decrease (i.e. satiety responsiveness remained similar), irrespective of the satiety phenotype. This agrees with a previous study reporting that, after a weight loss programme, the decrease in body fat mass was associated with an increase in the desire to eat and a decrease in the sensation of fullness( Reference Gilbert, Drapeau and Astrup 33 ). In the satiating diet, however, significant increases in satiety responsiveness were observed in both LSP and HSP individuals, despite significant decreases in body weight (more in HSP) and % fat mass. Of note, significant increases in all SQ (SQ desire to eat, SQ hunger, SQ fullness, SQ PFC and SQ mean) were found in LSP individuals (+3·6 (sd 4·1) to +5·6 (sd 4·0) mm/418 kJ (100 kcal); all P<0·01), whereas SQ hunger also increased significantly in HSP individuals (+2·4 (sd 4·4) mm/418 kJ (100 kcal); P<0·05). This suggests that, even under conditions of body weight and fat mass loss, not only could satiety responsiveness be globally improved in individuals lacking satiety efficiency, but it may also be further improved in individuals who already have a normal/high satiety efficiency.
Such differences in satiety responsiveness between the satiating and control diets (as well as differences in adherence rates) may be explained by the combination of different satiety-enhancing foods in the experimental diet. First, the low energy density (energy per unit weight) of the highly satiating diet could explain the effect on satiety responsiveness and body weight. Accordingly, it has been shown that because individuals tend to eat a consistent weight of food, reducing the energy density will spontaneously reduce the energy intake of the meal( Reference Rolls 9 ). With respect to satiety, low energy dense foods have been successfully used to reduce energy intake at a subsequent meal( Reference Flood and Rolls 34 – Reference Williams, Roe and Rolls 36 ). Furthermore, strong and consistent evidence in the adult population indicates that dietary patterns relatively low in energy density improve weight loss and weight maintenance( Reference Pérez-Escamilla, Obbagy and Altman 37 ). Variations in energy density can be easily achieved by manipulating the proportion of fat, fruits and vegetables or water in a meal( Reference Williams, Roe and Rolls 38 ). The mechanisms underlying the response to variations in energy density are not well understood but could involve sensory factors related to food volume which influence gastric distension and gastric emptying rate( Reference Rolls 9 ), or cognitive factors, such as beliefs about the satiating capacity of different foods( Reference Arguin, Gagnon-Sweeney and Pigeon 39 ).
Second, the higher protein content of the satiating diet could also be involved in this effect. Accordingly, evidence suggests that high-protein diets (>20 % of energy from protein) are more satiating and have a higher thermogenic effect than normal protein diets (<20 % of energy from protein) over the short and long term( Reference Anderson and Moore 10 , Reference Clifton, Keogh and Noakes 40 , Reference Yang, Liu and Yang 41 ), and could be an effective strategy to prevent weight regain( Reference Larsen, Dalskov and van Baak 42 ). The effect of protein on satiety is nutrient-specific (different proteins cause different effects)( Reference Mikkelsen, Toubro and Astrup 43 ) and seems to be due to increased diet-induced thermogenesis, specifically with animal protein, and to their influence on meal-induced anorexic gut peptides (glucagon-like peptide-1 and peptide YY release)( Reference Martens and Westerterp-Plantenga 44 , Reference Veldhorst, Smeets and Soenen 45 ).
Next, the glycaemic index and fibre content of the satiating diet could also explain the results. Short-term studies have shown that the ingestion of low glycaemic index foods can acutely increase satiety and reduce subsequent energy intake( Reference Krog-Mikkelsen, Sloth and Dimitrov 46 , Reference Roberts 47 ). The consumption of a low glycaemic index diet could also help long-term weight maintenance after energetic restriction( Reference Larsen, Dalskov and van Baak 42 ). Although, more recently, the role of glycemic index per se in appetite control and weight loss has been questioned( Reference Carreiro, Dhillon and Gordon 48 ), it is believed that many unprocessed, low glycaemic index foods are high in fibre and proteins and have a low energy density( Reference Foster-Powell, Holt and Brand-Miller 25 ); factors which are known to contribute to appetite and body weight control. Epidemiological and longitudinal studies consistently show that diets higher in dietary fibre or an increase in dietary fibre is associated with lower body weights( Reference Dahl and Stewart 12 ) and small but significant reduction in weight gain over time( Reference Ye, Chacko and Chou 49 ). In line with this, short-term intervention trials have shown that consumption of fibre results in modest improvements of satiety and body weight( Reference Wanders, van den Borne and de Graaf 50 ). These effects can be explained by different mechanisms such as a reduction in nutrient absorption by the intestine, a decrease in energy density of foods( Reference Blundell and Halford 51 ), an increase in mastication allowing more time for satiety signals to reach the brain( Reference Blundell and Halford 51 ) as well as an increase in stomach distention by water absorption which in turn triggers afferent vagal signals of fullness( Reference de Graaf, Blom and Smeets 52 ). Other functional nutrients that were added to the satiating diet and that may influence satiation and satiety and/or create a spontaneous decrease in energy intake include long-chain n-3 fatty acids( Reference Golub, Geba and Mousa 53 ), Ca( Reference Gonzalez, Green and Brown 14 ) as well as capsaicinoids( Reference Tremblay, Arguin and Panahi 15 ). Thus, the many food properties and food composition of the highly satiating diet could have significantly influenced satiation and satiety, energy intake and body weight.
Finally, recent evidence suggests that the pre-ingestive appraisal of a food’s satiating power, based on factors like its sensory profile or appearance, can alter the actual satiety responses to that specific food( Reference Chambers, McCrickerd and Yeomans 54 ). One of our previous studies have shown that satiety responses and appreciation towards a meal can be significantly modulated by a ‘satiating context effect’. In this study, false suggestive information and cues (either verbal and visual) given to the participants about the ‘highly satiating power’ of that meal induced higher satiety responses and appreciation after the meal compared with no suggestive information and cues of the same meal( Reference Arguin, Gagnon-Sweeney and Pigeon 39 ). Assuming that the two diets differed in their sensory profile and appearance (in part due to the presence of prepared meals in the satiating diet group), it is not excluded that satiety expectations could also have influenced satiation and satiety, as well as energy intake throughout the present study. However, we believe that such an effect in this context was minimised because participants were never informed about the satiating potential of the diets. Moreover, as mentioned by Chambers et al.( Reference Chambers, McCrickerd and Yeomans 54 ), satiety expectations have mostly been studied in isolation, and no studies have examined whether these effects on satiety persist with repeated consumption. Studies are thus needed to confirm if satiety expectations can play a role during long-term weight loss protocols.
Interestingly, in the present study, there were no baseline differences in any of the TFEQ scores between LSP and HSP individuals. This observation is concordant with previous studies that showed no relationship between the LSP and TFEQ eating behaviour traits in obese men( Reference Drapeau, King and Hetherington 5 , Reference Drapeau, Blundell and Gallant 6 ). In women, low satiety responsiveness was associated with high disinhibition( Reference Dalton, Hollingworth and Blundell 20 ), which reflects the tendency for opportunistic eating( Reference Bryant, King and Blundell 55 ) and has been associated with an increase in spontaneous energy intake( Reference Ouwens, van Strien and van der Staak 56 ) and weight gain( Reference Carr, Lin and Fletcher 57 ). It has been hypothesised that these sex discrepancies could be explained by the use of exclusion criteria regarding eating behaviours (such as high restraint eating scores) and the multifactorial control over appetite and eating behaviours( Reference Drapeau, Blundell and Gallant 6 ).
Despite higher body weight loss in the HSP and higher % fat mass loss for the high satiating diet, our results showed no effect of the diet or the satiety phenotype for any of the measured behavioural variables. Globally, LSP and HSP individuals in both diets showed similar mean increases in cognitive dietary restraint, flexible control and rigid control, as well as mean decreases in disinhibition and susceptibility to hunger. Furthermore, despite similar fat mass and % fat mass decreases within each diet group, the changes in eating behaviour traits (desirable or not) were comparable between LSP and HSP individuals. This result could be explained by the non-restrictive (ad libitum) nature of both diets. Therefore, the absence of planned, conscious energy restriction may counteract, at least partially, the undesirable impact of weight loss on eating behaviour traits in LSP individuals.
The difference in adherence rates between the satiating (91·4 %) and control (55·9 %) diets was also an important finding in the present study. Evidence suggests that the overall adherence rate in weight lost interventions is about 60·5 %( Reference Rogers, Lemstra and Bird 58 ). The higher adherence rate that was observed in the experimental diet could be explained by factors related to some elements of the study design. For example, balanced/conventional and low-fat diets, because of their lower protein content, may be associated with cravings( Reference Johnston, Kanters and Bandayrel 59 ). The experimental diet may have counteracted this issue by providing sufficient protein intake to maintain an acceptable level of satiety throughout the day. Another explanation could be the offering of ready-to-eat meals (one per day) that were palatable and time-convenient. The main reasons given by the participants at the time of dropping out were a lack of motivation, availability or time (60 and 33·3 % of the dropouts in the control and the satiating diet, respectively) and dissatisfaction with the diet or nutritional follow-up (13·3 and 33·3 % in the control and satiating diet, respectively). Even if not clearly stated by the participants who dropped out, the absence or presence of prepared meals could have partly influenced their level of motivation or satisfaction toward both diets. However, the nutritional follow-up was the same for both groups, suggesting that characteristics of the diets per se may have been major contributing factors for the differences in adherence rates. Below than expected weight loss may also have contributed to the lack of motivation and lack of adherence to the diet and could explain, at least partially, why more participants dropped out in the control group. Moreover, one can argue that differences in baseline eating behavioural traits of the participants could have played a role in compliance toward both diets. Our analyses showed significantly higher disinhibition scores for the individuals in the satiating diet group, irrespective of their satiety phenotype. This observation is surprising because it has been demonstrated that disinhibition is predictive of poorer success at weight loss( Reference Bryant, King and Blundell 55 ), and therefore one would expect more dropout or poorer outcomes in the satiating diet group. Comparisons of completers and dropouts (from both groups) showed no difference in their satiety responsiveness or eating behaviour traits, but further comparisons of completers and dropouts from the control group only demonstrated a tendency for the dropout participants to show higher rigid control than the completers (P=0·058, results not shown). Like disinhibition, rigid dietary control strategies have been inversely related to dieting success( Reference Meule, Westenhöfer and Kübler 60 ), and this result could suggest that this control diet was not suitable for high restrainers. Taken together, these observations demonstrate that the satiating diet succeeded to promote adherence in LSP and HSP, as well as in individuals demonstrating higher disinhibition, beyond what would be expected with a more traditional diet based on general healthy eating guidelines.
This study is not without some limitations. First, subjects were middle-aged men and the results could differ in other populations. Second, due to the high dropout rate observed in the control diet group, the final sample was smaller than what was expected and results should be interpreted as trends. It should also be kept in mind that participants in the control diet group, contrary to those in the satiating diet group, were not provided with the main course of the lunch or dinner on a weekly basis. In the informed consent, participants were told that only one of the two diet groups would receive these prepared meals. This information could have influenced the motivation or satisfaction toward the diet. However, the close individual supervision that was offered throughout the study was intended to minimise such dropouts. As discussed above, we did not collect data regarding the satiety expectations towards both diets, which could have given valuable additional information.
Finally, even though the present study focuses on inter-individual differences in appetite responses and how to support individuals with LSP and HSP, it did not allow the quantification of true individual response differences. To quantify true individual response differences (i.e. not explained by random within-subject variation and the regression to the mean), Atkinson & Batterham( Reference Atkinson and Batterham 61 ) suggest to compare the standard deviations of changes between intervention and comparator (no intervention) arms. When these standard deviations are similar, true individual response differences are clinically unimportant. In the present study, standard deviation comparisons were not possible because of the absence of a non-intervention comparator arm and relatively small samples. Nevertheless, as highlighted by Atkinson & Batterham, very few researchers have compared these standard deviations before drawing conclusions and extrapolating their results. Even though appetite sensation measurements have shown good short-term reproducibility( Reference Arvaniti, Richard and Tremblay 19 ), we cannot exclude the possibility that differences in response found between the groups are the result of random within-subject variation, especially when there is considerable time (3–6 months) between baseline and follow-up measurements( Reference Bayer, Krüger and von Kries 62 , Reference Atkinson and Nevill 63 ). Future studies should use appropriate designs and analysis approaches for quantifying this true inter-individual variations in satiety responses.
Conclusion
Despite higher overall body weight loss in the HSP compared with LSP groups, the ad libitum highly satiating diet resulted in twice the decrease in % fat mass in both LSP and HSP obese men compared with a control healthy diet. This was combined with an improved satiety responsiveness, irrespective of the satiety phenotype. The highly satiating diet also favoured an exceptionally good adherence rate and, despite higher body fat loss, was not associated with more important changes in eating behaviour traits in obese individuals compared with a control diet based on general healthy eating guidelines. These results suggest that a non-restrictive satiating diet is useful to improve body composition and satiety responsiveness in LSP and HSP individuals. More studies are needed to assess the long-term effects of a non-restrictive highly satiating diet on weight maintenance in LSP individuals.
Acknowledgements
The authors would like to thank Christian Couture for his important contribution to the statistical analyses and Shirin Panahi for English proofreading. A special thanks to the men who participated in the project.
This work was supported by the Canadian Institute of Health Research (A. T., grant no. MOP-68858). The Canadian Institute of Health Research had no role in the design, analysis or writing of this article.
V. D., A. T., J.-P. D., D. R., B. L. and J. E. B. formulated the research question, conceived the study design and obtained funding for the study. V. D. supervised the study. H. A. and V. D. contributed to the statistical analyses and H. A. drafted the manuscript. All authors participated in data interpretation, critically reviewed the manuscript and approved the final version.
The authors have no potential conflicts of interests to disclose.


