


Exposure to a typical Western diet increases the risk of metabolic disorders throughout the course of one's life, creating an intergenerational cycle of metabolic disease. In Western countries, this epidemic has coincided with a marked increase in the intake of n-6 PUFA, leading to suggestions that the two may be causally related( Reference Muhlhausler and Ailhaud 1 ). In contrast, diets rich in n-3 PUFA reduce the rates of all-cause mortality, in particular, cardiac arrest, sudden death or stroke, due to their positive effects on cholesterol, fasting insulin and TAG contents( Reference Wang, Harris and Chung 2 , Reference Calder 3 ). Evidence from several studies supports the premise that increasing the intake of n-3 long-chain (>C18, LC) PUFA from fish oil affects tissue lipid composition, in particular, cell membrane fatty acids, and derived lipid mediator production, resulting in clinical benefits( Reference Calder, Ahluwalia and Brouns 4 ). Such mediators derived from EPA (20 : 5n-3) and DHA (22 : 6n-3) are anti-inflammatory, while those derived from the most prevalent n-6 LC-PUFA, arachidonic acid (AA, 20 : 4n-6), are, in general, pro-inflammatory or exhibit other pathophysiological effects( Reference Schmitz and Ecker 5 ). Contrarily to the well-known inflammatory diseases, only more recently has chronic low-grade inflammation been recognised to be involved in obesity, type 2 diabetes mellitus, the metabolic syndrome and CVD( Reference Calder, Ahluwalia and Brouns 4 ), with the concentrations of systemic inflammatory markers, namely leptin, TNF-α, IL-1β and IL-6, being increased. In contrast, adiponectin exerts anti-inflammatory and insulin-sensitising effects with beneficial outcomes on cardiovascular and metabolic disorders( Reference Robinson, Prins and Venkatesh 6 – Reference Lin, Tian and Lam 8 ).
Sardine is a pelagic species and one of the main halieutic resources of the Portuguese coast with regard to the total annual catch( 9 ). This species is an excellent source of n-3 LC-PUFA, in particular, EPA and DHA( Reference Bandarra, Batista and Nunes 10 ). In addition, canned products are convenient and ready-to-use food products that are a good source of digestible protein with a high content of LC-PUFA( Reference Usydus, Szlinder-Richert and Polak-Juszczak 11 ). The current nutritional recommendations for EPA+DHA intake are based on a clear inverse relationship between EPA+DHA intake and the risk of fatal and non-fatal CVD. Due to the low efficiency of the conversion of α-linolenic acid into EPA and DHA in certain tissues, their maximum beneficial effect can only be achieved by direct dietary intake( Reference Komprda 12 ). For individuals with asymptomatic heart diseases, the American Heart Association recommends for primary prevention the consumption of at least two fishmeals per week (preferably oily fish), which would provide an average of 500 mg/d of EPA+DHA. For secondary prevention, aiming to reduce the risk of death from CVD, the American Heart Association recommends about 1000 mg/d of EPA+DHA( Reference Kris-Etherton, Harris and Appel 13 ).
The present study aimed to determine which dosage of canned sardines, 11 and 22 % (w/w), is best to achieve a preventive effect on CVD by means of beneficially influencing inflammatory markers in the Wistar rat model. An additional goal of the present study was to explore in which way these sardine dosages modulate the fatty acid profiles of key metabolic tissues (liver, muscle, adipose tissue and brain) and affect erythrocyte fatty acid composition and, therefore, the omega-3 index, a recognised marker for the evaluation of cardiovascular risk.
Experimental methods
Experimental diets
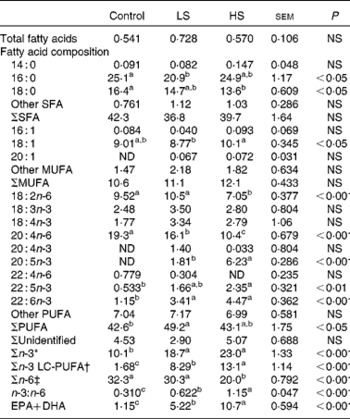
Canned sardines from the same lot were purchased from COFACO/CORESA (Lisbon, Portugal), and the experimental diets were manufactured by Sparos, Lda (Faro, Portugal). The composition of the granules was based on the commercial formula of the AIN-93G diet and lipid and protein levels were adjusted to obtain isoenergetic diets. After disposing the oil from cans, sardines were minced and mixed with other food ingredients to obtain a maximum incorporation of 22 g of sardines per 100 g of diet. In addition to the high-sardine (HS) diet (22 %, w/w), another diet with half the amount of sardines, 11 % (w/w) (low sardine; LS), was prepared. The proportion of EPA+DHA in the three experimental diets was as follows: 0 % in the control diet; 7·7 % in the LS diet; 19·2 % in the HS diet. The proximate chemical composition of the diets was determined according to the AOAC( 14 ), and the fatty acid composition was assessed as described by Bandarra et al. ( Reference Bandarra, Batista and Nunes 15 ) (Table 1).
Table 1 Chemical and fatty acid composition of the experimental diets

Control, 0 % (w/w) of canned sardines in the diet; LS, low sardine, 11 % (w/w) of canned sardines in the diet; HS, high sardine, 22 % (w/w) of canned sardines in the diet; TBHQ, tertiary butyl hydroquinone; ND, not detected.
Animals and sample collection
A total of twenty-seven male Wistar rats (Harlan Interfauna Iberica SL), aged 28 d, were housed individually under a 12 h light–12 h dark cycle and at a temperature of 22–25°C. After an adaptation period of 1 week, the rats were fed one of the three experimental diets (nine animals per group). Body weight and feed intake were recorded twice a week. At the end of 10 weeks, the rats were fasted for 12 h and killed by decapitation, under light isoflurane anaesthesia. The trunk blood was collected in lithium heparin tubes and was left to stand for 30 min. Plasma was obtained after centrifugation at 1500 g for 10 min. Erythrocytes were obtained after washing the pellet twice with 0·9 % NaCl and centrifuging at 1500 g for 15 min. Erythrocyte aliquots were flash-frozen in liquid N2 and stored at − 80°C for further analysis. After the collection of blood samples, liver, longissimus dorsi (LD) muscle, retroperitoneal adipose tissue and brain were removed, weighed and stored at − 80°C for fatty acid determination.
The experimental procedure was reviewed by the Ethics Commission of CIISA/FMV and approved by the Animal Care Committee of the National Veterinary Authority (Direcção-Geral de Veterinária, Portugal), following the appropriate European Union guidelines (2010/63/EU Directive).
Plasma biochemical assays
The plasma concentrations of total cholesterol, HDL-cholesterol, LDL-cholesterol, TAG, glucose, creatinine, urea, aspartate aminotransferase (AST) and alanine aminotransferase (ALT) were determined using standard diagnostic test kits obtained from Roche Diagnostics (Mannheim, Germany) in the Modular Hitachi Analytical System (Roche Diagnostics). The concentrations of VLDL-cholesterol and total lipids were calculated according to the Friedewald et al. ( Reference Friedewald, Levy and Fredrickson 16 ) and Covaci et al. ( Reference Covaci, Voorspoels and Thomsen 17 ) formulas, respectively. The serum/plasma concentrations of adipokines were determined using a LINCOplex kit (RADPK-81K; Linco Research) with the Luminex xMAP technology (Lincoplex 200; Linco Research), which allowed the simultaneous determination of the concentrations of insulin, leptin, IL-1β, IL-6, TNF-α, monocyte chemoattractant protein-1 and plasminogen activator inhibitor-1. The concentrations of adiponectin were measured using a commercial ELISA kit (EZRADP-62K; Linco Research). The degree of insulin resistance was calculated by the homeostasis model assessment using the insulin resistance index (HOMA-IR)( Reference Matthews, Hosker and Rudenski 18 ):
 $$\begin{eqnarray} Fasting\,serum\ glucose\ (mmol/l)\times fasting\,serum\,insulin\,(mU/l)/22\cdot 5. \end{eqnarray}$$
Analysis of fatty acid composition of erythrocytes and tissues
The fatty acid composition of the erythrocytes, liver, LD muscle, retroperitoneal adipose tissue and brain was analysed. Fatty acid methyl esters (FAME) were prepared according to the method of Bandarra et al. ( Reference Bandarra, Batista and Nunes 10 ). The samples were lyophilised ( − 60°C and 2·0 hPa) to a constant weight. FAME were obtained through the addition of 1 ml of anhydrous methanol and 0·5 ml of sodium methoxide (1 mol/l in methanol), swirling for 5 min and 1 h reaction in the dark under the conditions described by Christie( Reference Christie 19 ). Layer separation was improved by placing the contents in an ultrasonic bath for 10 min and centrifuging at 1500 g for 5 min. The n-hexane layer was collected and the aqueous phase re-extracted with 2·5 ml of n-hexane and centrifuged again. FAME were concentrated to a final volume of 25 μl in n-heptane, and 2 μl of the sample were injected on a capillary DB-Wax capillary column (30 m, 0·25 mm internal diameter and 0·25 μm film thickness; J&W Scientific/Agilent) in a Varian CP-3800 gas chromatograph equipped with a flame ionisation detector (Varian). The temperature of the injector and detector was set at 250°C. The adequate separation of FAME was achieved over a 40 min period, with 5 min at 180°C, followed by an increase of 4°C/min until 220°C, and keeping the sample at this temperature for 25 min. The quantification of total fatty acids was based on the internal standard technique, using the heneicosanoic acid (21 : 0). Total fatty acids and individual fatty acids are expressed as a percentage of tissue dry weight and a percentage of total fatty acids, respectively.
Calculation of the tissue contents and deposition ratios of EPA and DHA
The contents of EPA and DHA in the tissues were calculated as mg/g of dry weight. The deposition ratios of the same fatty acids were calculated by dividing the percentage of each fatty acid by the percentage in the feed as described by Berge et al. ( Reference Berge, Ruyter and Asgard 20 ). A deposition ratio of 1 corresponds to a fatty acid being deposited in tissue lipids at the same rate as the fatty acid supplied in the lipids of the feed. A value < 1 corresponds to a relative depletion of the fatty acid and a value >1 corresponds to a relative synthesis of the fatty acid.
Statistical analysis
Statistical analysis was carried out using the Statistical Analysis Systems (SAS) software package, version 9.1 (SAS Institute). All data were checked for normal distribution and variance homogeneity and reported as means with their standard errors. The generalised linear model procedure was used to carry out variance analysis and differences between the groups were calculated using Tukey's post hoc test at P< 0·05.
Results
Animal body composition
As shown in Table 2, the consumption of the LS and HS diets did not affect the daily feed intake, growth parameters or final body and tissue (liver, muscle, and epididymal and retroperitoneal fats) weights of the rats (P>0·05).
Table 2 Body composition parameters and plasma metabolite values

Control group, 0 % (w/w) of canned sardines in the diet; LS, low-sardine group, 11 % (w/w) of canned sardines in the diet; HS, high-sardine group, 22 % (w/w) of canned sardines in the diet; LD, longissimus dorsi; HOMA-IR, homeostasis model assessment of insulin resistance index; AST, aspartate aminotransferase; ALT, alanine aminotransferase; MCP-1, monocyte chemoattractant protein-1; PAI-1, plasminogen activator inhibitor-1.
a,b,cMean values within a row with unlike superscript letters were significantly different (P< 0·05; Tukey's post hoc test).
* VLDL-cholesterol = 1/5 (TAG).
† Total lipids = (total cholesterol) × 1·12+(TAG) × 1·33+148.
‡ HOMA-IR = (fasting serum glucose) × (fasting serum insulin)/22·5.
Plasma metabolite profiles
The plasma metabolite values of each dietary treatment group are also given in Table 2. Rats fed the canned sardine-supplemented diets had consistently lower concentrations of total cholesterol and LDL-cholesterol (P< 0·001). The HS group had the lowest concentration of HDL-cholesterol than the other two experimental groups (P< 0·001). However, these changes resulted in a lower total cholesterol:HDL-cholesterol ratio in the LS and HS groups in relation to the control group (P< 0·05). Moreover, the dietary treatments did not induce any significant change in TAG, total lipid, glucose, insulin, creatinine, and urea concentrations and HOMA-IR values (P>0·05). Higher concentrations of circulating ALT were found in both the sardine-supplemented groups than in the control group (P< 0·05). However, the AST:ALT ratio did not differ among the three dietary treatment groups (P>0·05, data not shown).
Regarding the most important cytokines mainly produced by the adipose tissue, sardine supplementation did not affect the concentrations of leptin (P>0·05), but increased those of adiponectin (P< 0·01). Nevertheless, the LS and HS groups had similar concentrations of adiponectin, and the leptin:adiponectin ratio in these two groups was lower than that in the control group (P< 0·05). The concentrations of pro-inflammatory markers IL-1β, IL-6, TNF-α, monocyte chemoattractant protein-1 and plasminogen activator inhibitor-1 are also summarised in Table 2. IL-1β was the only IL the concentration of which was significantly affected by sardine supplementation, with the HS group having a higher concentration than the control and LS groups (P< 0·05).
Fatty acid composition of erythrocytes and tissues
The total fatty acid composition of erythrocytes and tissues was not altered by the dietary treatments (P>0·05), except for that of the retroperitoneal adipose tissue, with the HS group having higher values than the control and LS groups (P< 0·01) (Tables 3–7).
Table 3 Total fatty acids (percentage of dry weight) and fatty acid composition (percentage of total fatty acids) of the erythrocytes
Control group, 0 % (w/w) of canned sardines in the diet; LS, low-sardine group, 11 % (w/w) of canned sardines in the diet; HS, high-sardine group, 22 % (w/w) of canned sardines in the diet; ND, not detected; LC-PUFA, long-chain PUFA.
a,b,cMean values within a row with unlike superscript letters were significantly different (P< 0·05; Tukey's post hoc test).
* Σn-3 = Σ(18 : 3n-3, 18 : 4n-3, 20 : 4n-3, 20 : 5n-3, 22 : 5n-3, 22 : 6n-3).
† Σn-3 LC-PUFA = Σ(20 : 4n-3, 20 : 5n-3, 22 : 5n-3, 22 : 6n-3).
‡ Σn-6 = Σ(18 : 2n-6, 20 : 4n-6, 22 : 4n-6).
Table 4 Total fatty acids (percentage of dry weight) and fatty acid composition (percentage of total fatty acids) of the liver

Control group, 0 % (w/w) of canned sardines in the diet; LS, low-sardine group, 11 % (w/w) of canned sardines in the diet; HS, high-sardine group, 22 % (w/w) of canned sardines in the diet; LC-PUFA, long-chain PUFA.
a,b,cMean values within a row with unlike superscript letters were significantly different (P< 0·05; Tukey's post hoc test).
* Σn-3 = Σ(18 : 3n-3, 18 : 4n-3, 20 : 4n-3, 20 : 5n-3, 22 : 5n-3, 22 : 6n-3).
† Σn-3 LC-PUFA = Σ(20 : 4n-3, 20 : 5n-3, 22 : 5n-3, 22 : 6n-3).
‡ Σn-6 = Σ(18 : 2n-6, 20 : 4n-6, 22 : 4n-6).
Table 5 Total fatty acids (percentage of dry weight) and fatty acid composition (percentage of total fatty acids) of the longissimus dorsi muscle

Control group, 0 % (w/w) of canned sardines in the diet; LS, low-sardine group, 11 % (w/w) of canned sardines in the diet; HS, high-sardine group, 22 % (w/w) of canned sardines in the diet; ND, not detected; LC-PUFA, long-chain PUFA.
a,b,cMean values within a row with unlike superscript letters were significantly different (P< 0·05; Tukey's post hoc test).
* Σn-3 = Σ(18 : 3n-3, 18 : 4n-3, 20 : 4n-3, 20 : 5n-3, 22 : 5n-3, 22 : 6n-3).
† Σn-3 LC-PUFA = Σ(20 : 4n-3, 20 : 5n-3, 22 : 5n-3, 22 : 6n-3).
‡ Σn-6 = Σ(18 : 2n-6, 20 : 4n-6, 22 : 4n-6).
Table 6 Total fatty acids (percentage of dry weight) and fatty acid composition (percentage of total fatty acids) of the retroperitoneal adipose tissue

Control group, 0 % (w/w) of canned sardines in the diet; LS, low-sardine group, 11 % (w/w) of canned sardines in the diet; HS, high-sardine group, 22 % (w/w) of canned sardines in the diet; LC-PUFA, long-chain PUFA.
a,b,cMean values within a row with unlike superscript letters were significantly different (P< 0·05; Tukey's post hoc test).
* Σn-3 = Σ(18 : 3n-3, 18 : 4n-3, 20 : 4n-3, 20 : 5n-3, 22 : 5n-3, 22 : 6n-3).
† Σn-3 LC-PUFA = Σ(20 : 4n-3, 20 : 5n-3, 22 : 5n-3, 22 : 6n-3).
‡ Σn-6 = Σ(18 : 2n-6, 20 : 4n-6, 22 : 4n-6).
Table 7 Total fatty acids (percentage of dry weight) and fatty acid composition (percentage of total fatty acids) of the brain

Control group, 0 % (w/w) of canned sardines in the diet; LS, low-sardine group, 11 % (w/w) of canned sardines in the diet; HS, high-sardine group, 22 % (w/w) of canned sardines in the diet; ND, not detected; LC-PUFA, long-chain PUFA.
a,b,cMean values within a row with unlike superscript letters were significantly different (P< 0·05; Tukey's post hoc test).
* Σn-3 = Σ(18 : 3n-3, 18 : 4n-3, 20 : 4n-3, 20 : 5n-3, 22 : 5n-3, 22 : 6n-3).
† Σn-3 LC-PUFA = Σ(20 : 4n-3, 20 : 5n-3, 22 : 5n-3, 22 : 6n-3).
‡ Σn-6 = Σ(18 : 2n-6, 20 : 4n-6, 22 : 4n-6).
The relative percentage of FAME in erythrocytes is summarised in Table 3. Contrarily to those of total SFA and MUFA, the percentage of total PUFA was affected by the dietary treatments, with the LS group having higher values than the control group (P< 0·05). While the percentage of n-6 PUFA, such as linoleic acid (LA, 18 : 2n-6) and AA, decreased with sardine supplementation (P< 0·05), that of n-3 PUFA increased, especially the sum of n-3 LC-PUFA (P< 0·05). The percentage of EPA was significantly higher in the HS group than in the LS group (P< 0·001). However, the percentage of DHA in the LS and HS groups was similar, but was significantly higher than that in the control group (P< 0·001). With an increase in sardine intake, the percentage of EPA+DHA in erythrocytes increased 4·5-fold between the control and LS groups and 2·1-fold between the LS and HS groups (P< 0·001).
The fatty acid profile of the liver is summarised in Table 4. The percentage of total SFA did not change (P>0·05), but that of total MUFA in the LS group was lower than that in the HS group, mainly due to 16 : 1 and 18 : 1 fatty acids (P< 0·001). A significant increase in the percentages of the major n-3 LC-PUFA, EPA, 22 : 5n-3 and DHA (P< 0·001), and a significant decrease in the percentages of the main n-6 PUFA, LA and AA (P< 0·001), were observed. The percentage of EPA+DHA increased 3·6-fold between the control and LS groups and 1·6-fold between the LS and HS groups.
There were significant differences in the percentages of the majority of fatty acids identified in the LD muscle among the dietary treatment groups (Table 5). The percentage of total SFA, and particularly 14 : 0 and 16 : 0 fatty acids, was significantly higher in the LS and HS groups than in the control group (P< 0·001). In relation to that of total MUFA, there was no difference in the percentage of 18 : 1 fatty acid, the major MUFA, among the dietary treatment groups (P>0·05). Conversely, there was a significant decrease in the percentage of total PUFA with an increase in sardine content in the diet (P< 0·001). The percentage of n-3 PUFA increased (P< 0·001), whereas that of n-6 PUFA decreased (P< 0·001), resulting in a significant increase in the n-3:n-6 ratio with sardine intake (P< 0·001). There was a decrease in the percentages of LA and AA in the LS and HS groups with respect to those in the control group (P< 0·001). The sardine-supplemented diets altered the relative proportions of EPA and DHA (P< 0·001). The percentage of EPA+DHA increased 2·2-fold between the control and LS groups and 1·7-fold between the LS and HS groups.
The fatty acid profile of the retroperitoneal adipose tissue is summarised in Table 6. The HF and LF groups had significantly higher percentages of SFA and MUFA than the control group, except for 18 : 1 fatty acid, which was present at similar values in the LS and control groups (P< 0·001). The percentage of LA, the most prevalent PUFA in retroperitoneal fat cells, decreased dramatically with sardine intake (P< 0·001). There were no variations in the percentage of AA between the LS and HS groups, but the percentage was significantly lower than that in the control group (P< 0·001). The percentage of n-3 PUFA (α-linolenic acid, 20 : 4n-3, EPA, 22 : 5n-3 and DHA) was higher in the sardine-supplemented groups (P< 0·001). Interestingly, the percentage of stearidonic acid (18 : 4n-3) was lower in the LS and HS groups than in the control group (P< 0·001). As the percentage of n-3 PUFA increased and that of n-6 PUFA decreased, the n-3:n-6 ratio increased progressively (P< 0·001). The percentage of EPA+DHA increased 22·1-fold between the control and LS groups and 3·9-fold between the LS and HS groups.
The fatty acid profile of the brain is summarised in Table 7. The SFA 16 : 0 was the only fatty acid that exhibited an increase in its percentage in the HS group compared with that in the control group (P< 0·05). In fact, the percentage of total SFA did not differ among the three dietary treatment groups (P>0·05). With regard to MUFA, the highest percentage of 20 : 1 fatty acid was observed in the control group (P< 0·001). However, the percentages of 16 : 1 and 18 : 1 fatty acids were much higher in the HS group than in the LS or control group (P< 0·01). The same trend was observed for the percentage of total MUFA (P< 0·01). In addition, the lowest percentages of LA, AA, 22 : 4n-6 and total n-6 PUFA were observed in the HS group (P< 0·001). Moreover, there was no significant change in the sum of n-3 PUFA (P>0·05). Furthermore, α-linolenic acid (18 : 3n-3) and 20 : 4n-3 were not detected in the brain. Interestingly, EPA was the only n-3 PUFA that exhibited an increase in its percentage in the dietary treatment groups fed the sardine-supplemented diets, while DHA did not exhibit any change in its percentage. In fact, the n-3:n-6 ratio increased significantly (P< 0·001), but there was no change in the sum of EPA+DHA contents (P>0·05).
Tissue contents and deposition ratios of EPA and DHA
In general, the increase in canned sardine intake from 11 % (LS diet) to 22 % (HS diet) led to an effective increase in tissue EPA and DHA contents (Fig. 1). However, the DHA contents of the erythrocytes, muscle and brain were similar in both the LS and HS groups (P>0·05). In comparative terms, the brain was richer in DHA than in EPA, among the tissues. The increases in EPA and DHA contents were significantly higher in the liver and retroperitoneal adipose tissue when comparing the LS and HS groups (P< 0·05).

Fig. 1 Tissue contents (mg/g dry weight) of EPA and DHA in the erythrocytes, liver, longissimus dorsi muscle, retroperitoneal adipose tissue and brain of Wistar rats fed graded levels of canned sardines: low sardine (LS, 11 % (w/w)) and high sardine (HS, 22 % (w/w)). Values are means, with their standard errors represented by vertical bars. a,b,cFor EPA, mean values with unlike letters were significantly different among the control, LS and HS groups (P< 0·05; Tukey's post hoc test). A,B,CFor DHA, mean values with unlike letters were significantly different among the control, LS and HS groups (P< 0·05; Tukey's post hoc test). □, EPA – control group; ![]() , EPA – LS group; ■, EPA – HS group;
, EPA – LS group; ■, EPA – HS group; ![]() , DHA – control group;
, DHA – control group; ![]() , DHA – LS group;
, DHA – LS group; ![]() , DHA – HS group.
, DHA – HS group.
In Fig. 2, the deposition ratios of EPA and DHA in the tissues are shown. Overall, EPA was deposited at lower rates ( < 1) in each tissue. In contrast, the values of EPA deposition ratio in the erythrocytes and liver were much higher than those observed in other tissues. The values of EPA deposition ratio in the erythrocytes and liver were similar in both the LS and HS groups (P>0·05); however, in the LD muscle, retroperitoneal adipose tissue and brain, the values were slightly increased with a higher dosage of sardine (P< 0·05). The deposition ratio of DHA was greater than 1 in the liver, LD muscle and brain. The increase in dietary sardine content did not reflect an increase in the tissue deposition ratio, except for the retroperitoneal adipose tissue. In the latter, the deposition ratio of DHA was higher in the HS group than in the LS group (P< 0·05).
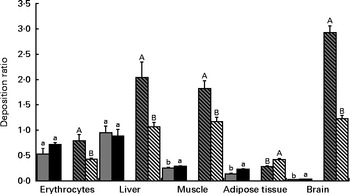
Fig. 2 Deposition ratios of EPA and DHA in the erythrocytes, liver, longissimus dorsi muscle, retroperitoneal adipose tissue and brain of Wistar rats fed graded levels of canned sardines: low sardine (LS, 11 % (w/w) in the diet) and high sardine (HS, 22 % (w/w) in the diet). Values are means, with their standard errors represented by vertical bars. a,bFor EPA, mean values with unlike letters were significantly different between the LS and HS groups (P< 0·05; Tukey's post hoc test). A,BFor DHA, mean values with unlike letters were significantly different between the LS and HS groups (P< 0·05; Tukey's post hoc test). ![]() , EPA – LS group; ■, EPA – HS group;
, EPA – LS group; ■, EPA – HS group; ![]() , DHA – LS group;
, DHA – LS group; ![]() , DHA – HS group.
, DHA – HS group.
Discussion
Based on the n-3 LC-PUFA dietary recommendations made by the American Heart Association for the primary and secondary prevention of CVD( Reference Kris-Etherton, Harris and Appel 13 ) and taking into account that the average of energy provided per day should be about 8374 kJ (2000 kcal) for humans v. 1256 kJ (300 kcal) for rats, the EPA and DHA dietary intakes were extrapolated to the rat model. The values calculated were found to be 76 and 151 mg/d of EPA+DHA and were very similar to the amounts of EPA+DHA used in the present study, 70 and 152 mg/d of EPA+DHA, corresponding to diets with 11 % (w/w) of canned sardines (LS) and 22 % (w/w) of canned sardines (HS), respectively.
In the present study, the consumption of both LS and HS diets by Wistar rats modified the profiles of systemic metabolites. The 11 % dosage of canned sardines was sufficient to decrease total cholesterol and LDL-cholesterol concentrations and total cholesterol:HDL-cholesterol ratio, as well as to increase adiponectin concentrations, thus reducing cardiovascular risk factors. In comparative terms, an additional decrease in lipid parameters was observed with the higher dosage of canned sardines. Bandarra et al. ( Reference Bandarra, Batista and Nunes 10 ) also observed a reduction in total cholesterol concentrations in Wistar rats fed sardine oil-enriched diets. The mechanism by which EPA and DHA decrease plasma cholesterol concentrations is not well established and contradictory results have been reported by epidemiological studies( Reference Komprda 12 ). It has been shown that n-3 LC-PUFA serve as PPAR-α and PPAR-γ ligands( Reference Komprda 12 ). Therefore, a possible explanation for our findings is that n-3 LC-PUFA may lead to PPAR-α stimulation, decreasing the expression of the active nuclear form of sterol regulatory element-binding protein-1( Reference Kim, Takahashi and Ezaki 21 ) and increasing the activity of LDL receptor( Reference Roach, Kambouris and Trimble 22 ).
Dietary EPA and DHA can also decrease plasma TAG concentrations by inhibiting the activity of enzymes associated with fatty acid synthesis or through the reduction of fatty acid synthesis in the liver, thus decreasing the secretion of TAG into the bloodstream( Reference Ikeda, Kumamaru and Nakatani 23 , Reference Shearer, Savinova and Harris 24 ). In addition, Qiao et al. ( Reference Qiao, Zou and van der Westhuyzen 25 ) have suggested that adiponectin decreases plasma TAG concentrations by increasing skeletal muscle lipoprotein lipase and VLDL removal from the blood. We found that the 11 % (w/w) canned sardine diet was able to increase adiponectin concentrations in the plasma of rats, although no changes in plasma TAG concentrations were observed in both the sardine-supplemented groups. Neschen et al. ( Reference Neschen, Morino and Rossbacher 26 ) have shown that supplementation with menhaden fish oil, although at a higher dosage (27 % (w/w) of fish oil in the diet), increases plasma adiponectin concentrations in mice as well. Similar to the results obtained for plasma glucose and insulin concentrations, the HOMA-IR index was identical across the dietary treatment groups, without evidence of insulin resistance, suggesting that high plasma adiponectin concentrations enhance insulin sensitivity and play an important role in glucose and lipid metabolism and homeostasis( Reference Tschritter, Fritsche and Thamer 27 , Reference Berg and Scherer 28 ). In a similar manner, canned sardines supplementation did not alter creatinine and urea concentrations, thus indicating unaffected renal function( Reference Kaneko, Harvey and Bruss 29 ). Apart from these valid explanations, our findings regarding the non-variation in the profiles of some plasma metabolites may have resulted due to the composition of the basal (control) diet, which could have limited the occurrence of further reductions.
Considering the prudent and plausible utilisation of n-3 LC-PUFA in the prevention of CVD, it is necessary to guarantee that their intake leads to no undesirable side effects. In parallel with the aforementioned beneficial changes in plasma metabolite profiles, our experimental data indicated that the consumption of the 22 % (w/w) canned sardine diet increased the circulating concentrations of IL-1β, a pro-inflammatory marker. Despite the well-recognised anti-inflammatory role of n-3 LC-PUFA in human studies( Reference Simopoulos 30 ), their action can be mediated by different signalling pathways. It has recently been reported that IL-1β production can be modulated by dietary fatty acids. While palmitic acid (16 : 0) has been shown to be associated with an increase in the concentrations of IL-1β, DHA has been demonstrated to have an inverse effect on the secretion of this IL( Reference Snodgrass, Huang and Choi 31 ). Interestingly, the sum of SFA, mainly 16 : 0, was increased in the muscle and adipose tissue in the HS group when compared with that in the LS group. This could have led to the activation of Toll-like receptors, inducing inflammasome-mediated IL-1β production( Reference Snodgrass, Huang and Choi 31 ). The underlying justification for this negative finding may be directly associated with the amounts of SFA and DHA available in the HS diet. The contribution of these fatty acids and their putative interplay to pro- or anti-inflammatory final events remains unclear.
Recently, a study using Wistar rats has shown both positive and negative effects after menhaden fish oil supplementation( Reference Shirazi, Taleban and Abadi 32 ). The diet used by Shirazi et al. ( Reference Shirazi, Taleban and Abadi 32 ), with 15·9 % of energy as fish oil, decreased total cholesterol and LDL-cholesterol concentrations, but induced fatty liver (steatosis) and the formation of atherogenic lesions, in contrast to the present results. In accordance with this, plasminogen activator inhibitor-1 and monocyte chemoattractant protein-1 concentrations were similar among the dietary treatment groups of the present study. Although the fat supplementation dosage was similar to the value used in the experimental diets (14·7 % of diet energy), the values of both liver weight and total fatty acid percentages were not affected, thus excluding the possibility of hepatic lipotoxicity. The enzymes AST and ALT have been accepted as the markers of liver injury; the activity of ALT is more indicative of hepatic diseases than that of AST. Despite the increase in ALT activity at both dosages of canned sardines, it is worth noting that the levels were still within the reference values for rats, which are 35·1 (SD 13·3) U/l( Reference Kaneko, Harvey and Bruss 29 ), and the AST:ALT ratio did not vary among the three dietary treatment groups.
The sum of EPA and DHA contents in erythrocyte membranes, expressed as a percentage of total fatty acids, is known as the omega-3 index( Reference Harris and von Schacky 33 ). It appears to be a good biomarker of EPA+DHA intake( Reference Harris and von Schacky 33 ). In fact, it can be perceived as a new surrogate risk factor that is associated with dietary fatty acids and morbidity and mortality associated with CVD( Reference Harris and von Schacky 33 ). Harris & von Schacky( Reference Harris and von Schacky 33 ) observed that an omega-3 index value >8 % is associated with the greatest cardioprotection, whereas values < 4 % have the least protective capacity. In the present study, changes in erythrocyte fatty acid composition were directly related to sardine supplementation, with omega-3 index values of 5 and 11 % being found in the LS and HS groups, respectively.
The liver has a pivotal function in the regulation of lipid and lipoprotein metabolism. The present results indicated that the fatty acid composition of the liver is very susceptible to diets with graded levels of canned sardines, with an almost 2-fold increase in the tissue contents of EPA and DHA. However, the deposition ratio of DHA was not proportional to the correspondent levels of sardine supplementation. The skeletal muscle is mainly involved in lipid oxidation to produce chemical energy. Although DHA was incorporated at amounts (in absolute values) higher than those of EPA, only the deposition ratio of EPA increased with an increase in sardine content in the diet. In addition, the retroperitoneal adipose tissue under study was a visceral fat depot closely associated with the metabolic syndrome, which is largely due to its immune response potential and lower number of insulin receptors( Reference Capurso and Capurso 34 ). The incorporation of both EPA and DHA in this tissue was highly significant, resulting in a proportional increase in the deposition ratio. This is probably the result of the ability of adipose tissue to accumulate dietary fatty acids in cell membranes and cytosolic lipid droplets, given its nature as an energy storage organ( Reference Barceló-Coblijn, Collison and Jolly 35 ).
The fatty acid composition of the brain was less affected by the dietary treatments when compared with that of other tissues. This finding has previously been reported in rats administered DHA( Reference Taniguchi, Suzuki and Takita 36 , Reference Saito, Ueno and Kubo 37 ). In fact, Suzuki et al. ( Reference Suzuki, Manabe and Wada 38 ) suggested that DHA intake increases per se the DHA content in brain membranes more rapidly than the intake of associated precursors in rats fed a low-n-3 LC-PUFA diet. In the present study, EPA and DHA contents were increased by the graded levels of canned sardines, although the small magnitude of the increment reveals that the fatty acid composition of the brain is tightly regulated and probably more selective towards DHA uptake from the bloodstream. It is important to note that, even without sardine supplementation, the brain had the highest DHA content among all the tissues studied. The accumulation of DHA in the brain is in line with the results reported by Barceló-Coblijn et al. ( Reference Barceló-Coblijn and Murphy 39 ) and Rapoport et al. ( Reference Rapoport, Chang and Spector 40 ).
Interestingly, EPA and DHA had distinct deposition ratios in the various tissues studied, suggesting unequal metabolic regulation. The lower deposition ratios of EPA may reflect a different degree of depletion of this fatty acid in all the tissues. The 22 % (w/w) dosage of canned sardines was able to increase EPA deposition in the muscle, retroperitoneal adipose tissue and brain. Conversely, DHA deposition was not enhanced by the LS and HS diets, except in the retroperitoneal adipose tissue. This is probably the consequence of dividing the tissue content by a higher value of sardine incorporation in the diet. The same trend was observed in the liver and muscle. Notwithstanding this, DHA had the highest deposition ratio in both the muscle and liver compared with EPA, regardless of the dietary treatment. This is probably due to the longest acyl chain length and the highest degree of unsaturation of DHA, which together could lead to stereoisomeric difficulties and, consequently, to β-oxidation resistance( Reference Bandarra, Rema and Batista 41 ). Alternatively, it may also be the result of a higher specificity of fatty acyl transferase for this fatty acid( Reference Bandarra, Rema and Batista 41 ).
Conclusions
The present study reports as novel findings the different responses of the fatty acid metabolism in different tissues to two different dosages of canned sardines. After a 10-week period of 11 and 22 % (w/w) of canned sardine supplementation in Wistar rats, each tissue had a specific fatty acid composition reflecting different EPA and DHA deposition ratios, and all these ratios were distinct from that of erythrocytes. The fatty acid composition was influenced in a dose-dependent manner by n-3 LC-PUFA and the profiles were tissue specific. The brain seemed to be the most conservative and the least responsive organ, while the adipose tissue was the most sensitive to EPA and DHA dietary intake.
At the systemic level, the consumption of the 11 % (w/w) canned sardine diet improved blood lipid and lipoprotein profiles and adiponectin concentrations, suggesting that this dietary approach may be a cost-effective and feasible option for the primary prevention of CVD. In addition, the higher dosage of canned sardines (22 % (w/w) in the diet), which mimics a secondary prevention approach for CVD, resulted in a higher omega-3 index value. Besides the unexpected increase in plasma IL-1β concentrations observed in rats fed the HS diet, the absence of an association of IL-1β with other pro-inflammatory biomarkers, insulin resistance, and liver and renal dysfunctions is a finding that deserves further pathophysiological understanding.
Acknowledgements
The authors thank Clínica Médica e Diagnóstico Dr Joaquim Chaves (Algés, Portugal) and Arium – Sistemas de Diagnóstico, Lda (Lisbon, Portugal) for technical assistance and support regarding plasma metabolite determination.
The present study was supported by Fundação para a Ciência e a Tecnologia (FCT) through the grant PTDC-SAU/OSM/2006/70560 (principal investigator: P. O. R). S. V. M. is the recipient of a FCT individual fellowship SFRH/BPD/2009/63019 and P. A. L. is a researcher involved in the FCT programme ‘Ciência 2008’.
The authors’ contributions are as follows: S. V. M., P. A. L. and C. M. A. conducted the animal experiment; S. V. M., P. A. L., C. R., S. M., R. M. A. P. and P. B. conducted the laboratory work; S. V. M., P. A. L., P. O. R. and N. M. B. prepared the manuscript; P. O. R., I. B., N. M. B. and J. A. M. P. were responsible for the experimental design, interpretation of the results and final version of the manuscript. All authors read and approved the findings of the study.
None of the authors has any conflicts of interest to declare.


