


Malnutrition due to starvation, disease or ageing can be defined as ‘a state resulting from lack of uptake or intake of nutrition leading to altered body composition (decreased fat-free mass) and body cell mass leading to diminished physical and mental function and impaired clinical outcome from disease’ (p. 335)( Reference Cederholm, Bosaeus and Barazzoni 1 ). The condition is highly prevalent among older adults (≥65 years old) admitted to hospital – 23–39 % are malnourished and 43–46 % are at risk of malnutrition( Reference Guigoz 2 – Reference Vanderwee, Clays and Bocquaert 4 ) according to the screening instrument Mini Nutritional Assessment (MNA). A large number of older adults are already malnourished when admitted to hospital( Reference Rasmussen, Holst and Kondrup 5 ), and the condition is associated with a markedly increased morbidity( Reference Larsson, Andersson and Askelof 6 ), impaired functional ability( Reference Amaral, Matos and Teixeira 7 ) and a lower quality of life( Reference Rasheed and Woods 8 ). In addition, malnourished individuals and individuals at risk of malnutrition have a higher mortality compared with well-nourished individuals – that is, they die preterm( Reference Dent, Visvanathan and Piantadosi 9 ). Even though up to 86 % of older adults admitted to hospital are at nutritional risk (malnourished or at risk of malnutrition)( Reference Kaiser, Bauer and Ramsch 3 ), and the consequences are severe, nutritional screening is still not performed as a routine in European hospitals and patients at risk of malnutrition may go undetected and untreated( Reference Correia, Hegazi and Higashiguchi 10 , Reference Johansson, Larsson and Rothenberg 11 ).
To promote nutritional screening, the European Society of Clinical Nutrition and Metabolism (ESPEN) has published guidelines for nutritional screening, and the MNA instrument is recommended specifically to screen older adults for malnutrition( Reference Kondrup, Allison and Elia 12 ), regardless of setting. According to the diagnostic criteria for malnutrition published by ESPEN in 2015, individuals identified by screening as at risk of malnutrition with, for example, the MNA, the diagnosis of malnutrition should be based on either a low BMI (<18·5 kg/m2) or on the combined finding of weight loss together with either reduced BMI (BMI <20 kg/m2 if <70 years of age, or <22 kg/m2 if >70 years of age) or a low fat-free mass index using sex-specific cut-off points( Reference Cederholm, Bosaeus and Barazzoni 1 ).
We recently conducted a 4-year follow-up study, in which we screened 1771 older adults (≥65 years of age) for malnutrition with the MNA, as well as examined all-cause mortality. At the time of planning the study and conducting the baseline recruitment for this study (in 2008–2009), these diagnostic criteria for malnutrition did not exist. Therefore, the original MNA was used to estimate the prevalence of malnutrition( Reference Vellas, Guigoz and Garry 13 ). At follow-up after 4 years, we found that the risk of death was almost four times higher in malnourished compared with well-nourished older adults( Reference Soderstrom, Rosenblad and Adolfsson 14 ). This raised the question whether malnourished older adults with certain diseases are more likely to die compared with well-nourished people.
Only one previous study has examined the relationship between malnutrition and cause-specific mortality, categorised as cardiovascular, cancer or respiratory mortality( Reference Cereda, Pedrolli and Zagami 15 ). In that study, 358 people (mean age 84·6 years old) in long-term care settings were screened with the MNA and the Geriatric Nutritional Risk Index (GNRI). At follow-up after 6·5 years, there was no association between malnutrition assessed with the MNA and cause-specific mortality; only the association between nutritional risk assessed by the GNRI and cardiovascular mortality was significant( Reference Cereda, Pedrolli and Zagami 15 ). However, in that study, malnutrition was not associated with other causes of death.
Thus, knowledge whether the malnourishment identified with the MNA instrument has any clinical importance in terms of cause-specific mortality has not yet been thoroughly established( Reference Cereda, Pedrolli and Zagami 15 ). Investigating different causes of death related to malnutrition could be used to examine whether the underlying disease – for example, cancer or CVD is decisive for predicting a preterm death – or whether the nutritional state (malnourished, at risk of malnutrition, well nourished) is more important than the underlying medical condition. Such knowledge could strengthen the decision to screen for malnutrition in clinical practice. If individuals at risk of malnutrition are detected before the condition is manifest, preventive nutritional interventions could be initiated. The present prospective cohort study was undertaken to clarify whether malnutrition is associated with cause-specific mortality in older adults.
Methods
Study design and setting
In this prospective cohort study, nutritional screening was performed in patients aged ≥65 years admitted to a medium-sized Swedish hospital during the 15 months from March 2008 to May 2009. Cause-specific mortality was followed up until 31 December 2013.
Study population
Fig. 1. describes the patient’s recruitment and reasons for exclusions and loss to follow-up.
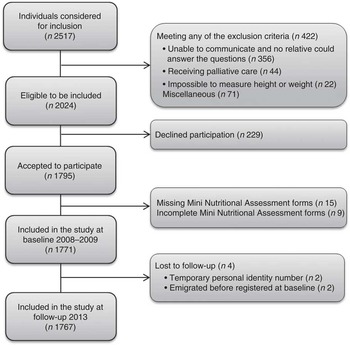
Fig. 1 Flow chart describing participant recruitment from admission to a medium-sized hospital in Central Sweden at the baseline in 2008–2009 to 5-year follow-up in 2013.
The baseline sample comprised 1771 patients. Of these, 706 (40 %) were admitted to two internal medicine wards, 681 to two surgical wards (38 %) and 384 (22 %) to one orthopaedic ward. After a median follow-up of 5·1 years, the final cohort comprised 1767 patients, of which 928 were still alive and 839 participants were deceased.
A sample size calculation was performed on the basis of studies that evaluated malnutrition and mortality in older adults in hospital( Reference Compan, di Castri and Plaze 16 – Reference Persson, Brismar and Katzarski 19 ). The expected mortality during the 3 years of follow-up was 24 % among the well-nourished patients and 35 % among the malnourished patients; that is, a difference of 11 percentage points, with a minimum prevalence of 17 % well-nourished patients and 16 % malnourished patients. To obtain a power (1−β) of 80 % at a two-sided significance level of α=0·05 with a Z test for difference in proportions with an expected difference in mortality of 11 percentage points using these prevalences, a total study population of 1682 participants would be needed. To take into account expected dropouts, non-responses and missing values, the aim was to recruit 2080 participants. As the dropout rate was lower than expected, a decision was made to end recruitment when nutritional screening had been performed in 1795 patients in the study.
Data collection at baseline
The data collected consecutively at baseline included the following clinical characteristics: age (years), female sex (yes/no), BMI (kg/m2), current smoking (yes/no), number of medications taken, overnight fast >11 h (yes/no), eating episodes <4 (yes/no), independent cooking (yes/no), living situation (living alone, cohabiting or in a nursing home), country of birth (Sweden or another country) and diagnoses. Primary and secondary medical diagnoses according to the International Statistical Classification of Diseases and Related Health Problems, 10th Revision (ICD-10), were collected at discharge. These were categorised into the twenty main diagnosis groups of the ICD-10 classification system by registering a ‘yes’ for each patient who had a primary or secondary diagnosis with an ICD-10 code belonging to the diagnosis group in question, and otherwise registering a ‘no’. The participants were asked about the usual length of their overnight fast. The length of their overnight fast was defined as the period between the last eating episode in the evening and the first eating episode the following morning. The number of eating episodes per day was recorded as how often the patient usually ate breakfast, lunch, dinner and between-meal and evening snacks. A detailed description of the baseline survey has been published previously( Reference Soderstrom, Thors Adolfsson and Rosenblad 20 ). To evaluate the cumulative burden of co-morbidity, the Charlson co-morbidity index( Reference Charlson, Pompei and Ales 21 ) was constructed in the same way, using ICD-10 coding according to Quan et al.( Reference Quan, Sundararajan and Halfon 22 ) and weights from Charlson et al.( Reference Charlson, Pompei and Ales 21 ).
Nutritional screening
Nutritional screening was performed with the original eighteen-item MNA instrument that categorises patients into well-nourished (score 24–30), at risk of malnutrition (score 17–23·5) or malnourished (score <17) groups. BMI was calculated using the standard formula of weight (kg)/height squared (m2). Weight was measured with a calibrated chair or mobile lift scale (n 21) to the nearest kg after the patient had emptied the bladder and with the patient wearing a light hospital robe. Height was measured to the nearest centimetre with a stadiometer. Participants unable to stand upright were measured using a sliding calliper (n 345) or, as a last resort, by calculating their height from half the arm span (demi-span) (n 18) using the following formula: (1·40×demi-span (cm))+57·8 for men and (1·35×demi-span (cm))+60·1 for women( Reference Bassey 23 ).
MNA is a validated screening instrument( Reference Vellas, Guigoz and Garry 13 ) developed to provide an easy, reliable way to screen for malnutrition in adults aged ≥65 years. The instrument comprises eighteen weighted items and takes about 15 min to complete. The nutritional screening was performed during the first few days of the patient’s stay at the hospital. In total, eighteen personnel collected the data (two to four registered nurses, assistant nurses or registered dietitians in each ward). The researchers responsible for the study provided training to the personnel in the interpretation of the questions in the MNA and obtaining measurements.
Data collection at follow-up
To analyse the relationship between malnutrition and cause-specific mortality, the participants were followed up through the Swedish Cause of Death Register, which is managed by the Swedish National Board of Health and Welfare( 24 ). Data were also retrieved through the Swedish Population Register to identify emigrated individuals( Reference Ludvigsson, Otterblad-Olausson and Pettersson 25 ). Causes of death were coded and tabulated according to ICD-10( 26 ). In this analysis, cause-specific mortality was determined using all causes of death documented on the death certificate, rather than just the single underlying cause of death( 26 ). This resulted in some individuals being counted in more than one category of cause-specific mortality. The main diagnostic groups were analysed according to the ICD-10 or subcategories of these with ≥50 deaths, which resulted in twenty different causes of death being analysed.
Ethical considerations
The Regional Uppsala Ethical Review Board approved the study (approval no.: 2007–323). Before the patients entered the study, all of them provided their written informed consent. For patients who were unable to communicate, a next-of-kin was asked whether there was any objection to the patient’s participation in the study (n 23), and this person assisted in answering the questions in the MNA. Malnourished participants received only routine interventions at the hospital, and no additional interventions were included in the study. However, the participants received information about their risk of malnutrition, which gave them the opportunity to consider whether they needed or wanted to take further actions, such as consulting a dietitian. If the participant was unable to communicate, the relative was informed of the patient’s nutritional risk.
Statistical analysis
For descriptive statistics, categorical data are presented as frequencies and percentages. Discrete and continuous data are given as medians and interquartile ranges (25th–75th percentile) or as mean values and standard deviations. Differences between the three nutritional screening groups were analysed using Pearson’s χ 2 test for categorical data, the Kruskal–Wallis test for discrete data and ANOVA for continuous data.
For analysis of cause-specific death, survival was calculated from the date of the MNA assessment to the date of cause-specific death or to the date of censoring. Dates of emigration, end of follow-up and death from other causes were used as censoring dates. Multiple causes of death were analysed (i.e. all conditions mentioned on a death certificate)( 26 ). Consequently, if an individual had three causes of death registered on the death certificate, the patient could be included as an event in up to three different Cox regression analyses.
Kaplan–Meier curves were created, and associated log-rank tests were calculated. In addition, simple and multiple Cox proportional hazards regression models were used. In the regression analyses, nutritional screening groups were entered as a categorical variable with three levels: well nourished, at risk of malnutrition or malnourished, with well nourished used as reference category.
Separate multivariate Cox regression models were constructed, with cause-specific death as the outcome in each of the models. All multivariate Cox regression models were adjusted for the same variables to ensure that the models are comparable with each other – age, sex, BMI, BMI×BMI, current smoking, number of medications, overnight fast >11 h and living situation (lives alone, cohabits or in a nursing home). Each model was adjusted for the specific diagnosis at baseline – that is, if the outcome was death from cancer, the model was adjusted for presence of cancer at baseline. Further, the models were adjusted for the cumulative burden of co-morbidity according to the Charlson co-morbidity index( Reference Charlson, Pompei and Ales 21 ). For all statistical tests, a two-sided P< 0·05 was considered significant. All data were analysed using IBM SPSS Statistics 22.
Results
Participant characteristics
A total of 1767 participants were followed up in the present prospective cohort study: 628 (35·5 %) were well nourished, 973 (55·1 %) were at risk of malnutrition and 166 (9·4 %) were malnourished at baseline. The mean age of the participants was 78·1 (sd 7·8) years at baseline, and most of them were women (56·0 %). Almost all the participants lived at home (95·1 %) before their admission to hospital, and a minority lived in a nursing home (4·9 %).
Table 1 lists the participants’ characteristics. All the baseline characteristics differed between the participants’ nutritional screening groups except for sex distribution. At baseline, differences in nutritional screening groups were found for the ICD-10 diagnoses infectious diseases (A00–B99) (P<0·004), mental and behavioural disorders (F00–F99) (P<0·001), heart failure (I50) (P<0·008) and chronic obstructive pulmonary disease (J44) (P<0·019) (not in table).
Table 1 Baseline characteristics in relation to nutritional screening groups (well nourished, at risk of malnutrition or malnourished), derived from the Mini Nutritional Assessment instrument among 1767 older adults (Mean values and standard deviations and percentages)

NA, not applicable.
* ANOVA for continuous variables, the Kruskal–Wallis test for discrete variables and the χ2 test for categorical variables.
† Multiple answers allowed.
Cause-specific mortality
During a median follow-up of 5·1 (Q1 4·9; Q3 5·6) years, 839 participants (47·5 %) died. Most died in hospital (53·4 %) or in a nursing home (36·0 %), and only a minority (9·6 %) passed away at home. The place of death was unknown for 1 %. The mean age at death was 82·8 (sd 7·8) years (range: 65–102 years).
The most frequent causes of death were diseases of the circulatory system (62·6 %): heart failure, (29·4 %), ischaemic heart disease (19·8 %) and cerebrovascular disease (15·6 %). The next most common cause was neoplasms (35·9 %): neoplasms of the digestive organs (16·6 %).
Table 2 displays the causes of death in relation to the number of deceased individuals (n 839) and to the nutritional screening groups at baseline (n 1767) among older adults. The survival rate was significantly related to nutritional screening groups at baseline for all the registered causes of death (all log-rank tests P<0·05). Fig. 2(a) and (b) show the Kaplan–Meier curves for the cumulative survival of older adults with neoplasms (Fig. 2(a)) and diseases of the circulatory system (Fig. 2(b)) in relation to the nutritional screening groups at baseline.

Fig. 2 Kaplan–Meier survival curves according to the nutritional screening groups defined by the Mini Nutritional Assessment. Survival for participants with (a) neoplasms and (b) diseases of the circulatory system differed significantly between the nutritional screening groups (log-rank test P<0·001). ![]() , Well nourished;
, Well nourished; ![]() , risk of malnutrition;
, risk of malnutrition; ![]() , malnourished.
, malnourished.
Table 2 Causes of death in relation to the number of deceased individuals (n 839) and to nutritional screening groups among 1767 older adults (Numbers and percentages)

ICD-10, International Statistical Classification of Diseases and Related Health Problems, Tenth Revision; COPD, chronic obstructive pulmonary disease.
* Main diagnostic groups according to the ICD-10; subcategories are marked with a bullet.
† Multiple causes of death were analysed; therefore, the column percentage exceeds 100.
‡ Log-rank test between nutritional screening groups.
Table 3 displays the unadjusted and adjusted hazard ratios (HR) for cause-specific mortality. The univariate Cox regression showed a significant association between malnutrition and death from all of the twenty examined causes of death. For participants at risk of malnutrition, a significant association was found for fourteen out of twenty examined causes of death. After adjusting for possible confounding variables in the multivariate Cox regression model, malnutrition or risk of malnutrition was still associated with seventeen out of twenty examined causes of death (Table 3).
Table 3 Cause-specific mortality in relation to nutritional screening groups in 1767 older adults (Hazard ratios (HR) and 95 % confidence intervals)

COPD, chronic obstructive pulmonary disease.
* Reference category is well nourished (n 628).
† Adjusted for age, sex, BMI, BMI×BMI, current smoking, number of medications, overnight fast >11 h, living situation (lives alone, cohabits or nursing home), diagnoses at baseline and the Charlson co-morbidity index.
‡ Main diagnostic groups according to the International Statistical Classification of Diseases and Related Health Problems, Tenth Revision; subcategories are marked with a bullet. Multiple causes of death were analysed.
§ Adjusted HR with significant associations.
For the main diagnostic groups, there was a significant association between malnutrition and risk of malnutrition and death due to neoplasms (HR 2·43 and 1·32, respectively); mental or behavioural disorders (HR 5·73 and 5·44, respectively); diseases of the nervous system (HR 4·39 and 2·08, respectively), circulatory system (HR 1·95 and 1·57, respectively) and respiratory system (HR 2·19 and 1·49, respectively); and symptoms, signs and abnormal clinical and laboratory findings, not elsewhere classified (HR 2·23 and 1·43, respectively)·
Discussion
Main results
The important results of the present prospective cohort study were that malnourished older adults and those at risk of malnutrition had a consistently higher risk of death compared with well-nourished older adults regardless of the cause of death. These results remained significant after controlling for baseline characteristics, diagnoses and the Charlson co-morbidity index. These data show that malnutrition and risk of malnutrition per se are important prognostic factors for adults aged ≥65 years, regardless of the cause of death.
Strengths and limitations of the study
The major strengths of the present study were its sample size and the length of follow-up. This is the only study so far to examine the relationship between three nutritional screening groups defined by the MNA and cause-specific mortality among older adults admitted to hospital. The prospective study design made it possible to control for a number of co-morbidities and several other participant characteristics recorded at baseline. Furthermore, in the present study, multiple causes of death were analysed – that is, all conditions mentioned on a death certificate, which included both the terminal cause of death and the underlying cause of death( 26 ). By contrast, the majority of previous studies have analysed the underlying cause of death in relation to malnutrition( Reference Cereda, Pedrolli and Zagami 15 ) or BMI( Reference Breeze, Clarke and Shipley 27 ). However, older adults may have a complex disease history, and multiple diseases may contribute to the cause of death( 26 ). For this reason, all conditions specified on a death certificate were analysed, which is considered a strength of the present study.
The limitation with the Swedish Cause of Death Register is that only a minority of deaths are examined by autopsy, which is the most reliable method to confirm the cause of death( 24 ). In the present study, an autopsy was found to be performed on 6·3 % of the deceased. The least reliable method to examine cause of death is an external examination of the corpse. Fortunately, this was performed only in 11·7 % of the deceased. The majority (80·3 %) had been examined before they passed away, and the cause-of-death statement was based on this examination. However, in a small percentage of the deceased, the examination for determining cause of death was not stated (1·7 %). Another limitation of the present study was that no information was available about when malnutrition had occurred. Hence, it is difficult to know whether the diseases had led to malnutrition or whether malnutrition preceded the diseases. However, the multivariate Cox regression analyses remained significant after controlling for the diagnoses and the Charlson co-morbidity index at baseline. After adjustment for potential confounders, the association between malnutrition and death due to certain infectious and parasitic diseases, heart failure, cerebrovascular disease and disease of digestive system disappeared. Given the strong reduction in the magnitude of the effect estimates, it is likely that some of the confounding factors included in the adjusted regression models explain this effect.
Comparison with other studies
This is the first study to demonstrate an association between malnutrition defined by the MNA and cause-specific mortality among older adults. Previous studies have investigated the relationship between malnutrition and all-cause mortality( Reference Dent, Visvanathan and Piantadosi 9 ), and have concluded that malnutrition can predict preterm death( Reference Soderstrom, Rosenblad and Adolfsson 14 ). An Italian study found an association between malnutrition according to the screening instrument GNRI and cardiovascular mortality in older adults in long-term care settings (mean age of 84·6 years)( Reference Cereda, Pedrolli and Zagami 15 ), which was slightly older than the population of the present study. However, no association between malnutrition assessed with the MNA and cause-specific mortality was found. One possible explanation for the differences between these two studies is that our study had a higher number of deceased participants (n 839) compared with the Italian study (n 297), and consequently more events in the other causes of death categories.
BMI is included as an item when screening for malnutrition with the MNA( Reference Guigoz 2 , Reference Vellas, Guigoz and Garry 13 ), and a low BMI (<22 kg/m2) could be an indicator of malnutrition. Previous studies have found a U-shaped relationship between BMI and all-cause mortality( Reference Soderstrom, Rosenblad and Adolfsson 14 , Reference Flegal, Kit and Orpana 28 ), with an optimal BMI of 29·6 kg/m2 for overall survival( Reference Soderstrom, Rosenblad and Adolfsson 14 ).
However, the ESPEN guidelines for nutritional screening do not recommend the use of only a low BMI to detect malnutrition and survival prospects, because it could lead to massive underdiagnosis, as the BMI in all populations worldwide is increasing as a result of the obesity epidemic( Reference Cederholm, Bosaeus and Barazzoni 1 , Reference Kondrup, Allison and Elia 12 ). In the present study, 19·7 % of the 1771 participants had a BMI <22 kg/m2, which is considerable fewer than the 55·1 % who were assessed as risk of malnutrition with the MNA. To assess risk of malnutrition in older adults, ESPEN guidelines state that BMI in combination with weight loss and decreased food intake should be included in all screening instruments( Reference Kondrup, Allison and Elia 12 ).
The results of the present study that malnourished participants had double the risk of respiratory disease mortality is supported by a study from the UK, which examined cause-specific mortality in older adults according to BMI in 4862 old- and middle-aged (40–69 years) male civil servants. Those with the lowest BMI (<22·7 kg/m2) had double the risk of respiratory disease mortality( Reference Breeze, Clarke and Shipley 27 ). Further, in the present study, malnourished individuals (mean BMI 21·2 kg/m2) had double the risk of cardiovascular mortality. On the contrary, in the UK study, those with the highest BMI (>26·1 kg/m2) had double the risk of cardiovascular mortality( Reference Breeze, Clarke and Shipley 27 ). This difference could be explained by the different populations examined. The present study included unhealthy older adults, where a high BMI could have a cardioprotective effect( Reference Hansel, Roussel and Elbez 29 ). On the contrary, the UK population included healthy middle-aged people( Reference Breeze, Clarke and Shipley 27 ), and in this population obesity is associated with higher risk of CVD( Reference Hubert, Feinleib and McNamara 30 ). Previous studies support the premise that once a chronic disease of some kind is present, overweight and even obesity have a protective effect against mortality. A prospective cohort study of patients with or at high risk of atherosclerosis (n 54 285) found that underweight patients (BMI<18 kg/m2) had the highest risk of both all-cause and cardiovascular mortality, whereas obese patients (BMI>35 kg/m2) had the lowest mortality risk at follow-up after 4 years( Reference Hansel, Roussel and Elbez 29 ). However, also in healthy older adults (mean age 72 years old), those with a BMI corresponding to overweight (BMI 25·0–29·9 kg/m2) had the lowest risk of both all-cause mortality and respiratory, cardiovascular and cancer mortality( Reference Flicker, McCaul and Hankey 31 ). This is in line with the present study, demonstrating increased mortality in all the aforementioned causes of death in malnourished individuals.
In summary, the present study found an association between malnutrition and cardiovascular, respiratory and cancer mortality and further that the association with malnutrition extends to most causes of death in older adults. These results are supported by previous studies that have found an association between nutritional risk and cardiovascular mortality( Reference Cereda, Pedrolli and Zagami 15 ) and a low BMI and respiratory disease mortality( Reference Breeze, Clarke and Shipley 27 , Reference Flicker, McCaul and Hankey 31 ), cardiovascular mortality( Reference Hansel, Roussel and Elbez 29 , Reference Flicker, McCaul and Hankey 31 ) and cancer mortality( Reference Flicker, McCaul and Hankey 31 ).
Conclusion and clinical implications
The results from the survival analyses clearly demonstrate that, irrespective of the underlying diseases the individuals have, malnutrition and risk of malnutrition have profound effects on survival. The MNA screening instrument could identify those with worse survival prospects related to malnutrition and risk of malnutrition, which suggests that this instrument is useful in clinical practice. Therefore, nutritional screening should be performed as a routine in all older adults to identify those who may require nutritional support in order to help avoid preterm death. Even though it is not yet established which nutritional intervention is most efficient to prevent or treat malnutrition, and to whom these interventions should be targeted( Reference Baldwin and Weekes 32 , Reference Milne, Potter and Vivanti 33 ), the present study clearly demonstrates that it is important that these individuals are identified. These results may support further studies to establish effective interventions against malnutrition in older adults.
Acknowledgements
The authors thank all the study participants as well as all the personnel being helpful in collecting data. A special thanks to our co-worker Hanna Frid.
The study was financed with grants from the Swedish National Board of Health and Welfare (grant no. 11132/2011) and the County Council of Västmanland, Sweden (grant no. LTV-379571). The sponsors had no involvement in the study design, data collection, statistical analyses, data interpretation and writing of the paper or in the decision to submit the paper for publication.
L. S., A. R., E. T. A. and L. B. participated in the conception and design of the study, interpreted the results and edited the manuscript; L. S. carried out the study; L. S. and A. R. performed the statistical analyses; and L. S. wrote the first draft. All the authors read and approved the final version of the manuscript.
None of the authors has any conflicts of interest to declare.


