


Vitamin D deficiency is recognised as a public health problem globally. However, there is little information on the prevalence and predictors of vitamin D deficiency among indigenous Australians, namely Aboriginal people (indigenous people from all parts of Australia, except for the Torres Strait Islands) and Torres Strait Islander people (indigenous people of the Torres Strait Islands, Queensland, Australia). Most studies have involved small numbers of participants, and no study has used an assay that is certified to the reference measurement procedures (RMP) developed by the National Institute of Standards and Technology, Ghent University and the US Centers for Disease Control and Prevention(Reference Sempos, Vesper and Phinney1,Reference Mineva, Schleicher and Chaudhary-Webb2) . Non-certified assays may be subject to analytical bias(Reference Lai, Lucas and Banks3–Reference Binkley, Krueger and Morgan5). Among Aboriginal and Torres Strait Islander adults, the prevalence of deficiency has been shown to range from 31 to 62 %, depending on latitude of residence and definition of deficiency (serum 25-hydroxyvitamin D (25(OH)D) <50 and ≤60 nmol/l, respectively)(Reference Maple-Brown, Hughes and Lu6,Reference Vanlint, Morris and Newbury7) . In pregnant Aboriginal and Torres Strait Islander women, the prevalence of vitamin D deficiency has been reported as ranging from 0 to 56 %, depending on latitude of residence and stage of pregnancy(Reference Binks, Smith-Vaughan and Marsh8–Reference Willix, Rasmussen and Evans10).
Aboriginal and Torres Strait Islander people are potentially at high risk of vitamin D deficiency: most vitamin D is obtained through cutaneous synthesis from sun exposure and those with darker skin pigmentation require a greater dose of UVB radiation than those with paler skin to synthesise adequate amounts of vitamin D(Reference Clemens, Adams and Henderson11). Indeed, there is a high prevalence of chronic musculoskeletal pain – one of the main symptoms of vitamin D deficiency(Reference Plotnikoff and Quigley12,Reference de Torrente de la Jara, Pecoud and Favrat13) – among Aboriginal people(Reference Benson, Wilson and Stocks14,Reference Vindigni, Griffen and Perkins15) . Vitamin D deficiency is potentially an important consideration for the health of Aboriginal and Torres Strait Islander people, since low vitamin D status has been associated with many of the acute and chronic health problems prevalent in the Aboriginal and Torres Strait Islander population, including acute lower respiratory infection(Reference Binks, Smith-Vaughan and Marsh8), non-infectious skin disease(Reference Heyes, Tait and Toholka16,Reference Soleymani, Hung and Soung17) , chronic kidney disease(18,Reference Lips, Goldsmith and de Jongh19) , type 2 diabetes(Reference Maple-Brown, Hughes and Lu6) and adverse cardio-metabolic risk profile(Reference Maple-Brown, Hughes and Lu6), although causal links have not been established.
The 2011–2013 Australian Aboriginal and Torres Strait Islander Health Survey (AATSIHS) is the first survey to quantify serum 25(OH)D concentrations in a nationally representative sample of Aboriginal and Torres Strait Islander people. The AATSIHS used a liquid chromatography-tandem MS method that is certified to the RMP(Reference Lai, Lucas and Banks3,Reference Black, Anderson and Clarke4) . Using data from the AATSIHS, we investigated the prevalence of vitamin D deficiency and identified its predictors in Aboriginal and Torres Strait Islander adults aged ≥18 years.
Methods
Study design and population
The 2012–2013 AATSIHS comprises the National Aboriginal and Torres Strait Islander Health Survey, the National Aboriginal and Torres Strait Islander Nutrition and Physical Activity Survey and the National Aboriginal and Torres Strait Islander Health Measures Survey (NATSIHMS). Detailed methodology of the AATSIHS can be found elsewhere(20).
In brief, all individuals participating in the AATSIHS (n 13 400) provided core information (e.g. general household and demographic data, self-reported health and smoking status) and information on selected health conditions; BMI was calculated from measured weight (kg) and height (m) (weight/height2). The AATSIHS was designed to provide reliable Aboriginal and Torres Strait Islander estimates for the whole of Australia and for remote and non-remote areas(20). The Aboriginal and Torres Strait Islander population was divided (as far as possible) into two groups: the ‘community frame’ (persons residing in discrete Aboriginal and Torres Strait Islander communities in remote areas) and the ‘non-community frame’ (the remainder of the Aboriginal and Torres Strait Islander population)(20). Samples were drawn from both the community frame and the non-community frame using different sample designs, due to operational and sampling issues. Data were collected by trained Australian Bureau of Statistics interviewers through face-to-face interviews. All participants in the AATSIHS aged ≥18 years were invited to participate in the NATSIHMS, which involved collection of blood for measurement of biomarkers. For those who agreed to participate in the NATSIHMS (n 3300), qualified phlebotomists collected blood samples for measurement of biomarkers, including serum 25(OH)D concentration(20).
The present study includes data on adults aged ≥18 years who participated in the NATSIHMS and had complete data for all potential predictors investigated. Of the 3293 adults participating in the NATSIHMS, forty-three had missing data for serum 25(OH)D concentration, leaving 3250 participants for the current analysis (40 % men, 60 % women).
The study was conducted in accordance with the Declaration of Helsinki. The interview components of the AATSIHS were conducted under the Census and Statistics Act 1905. The biomedical component (NATSIHMS) was collected under the Privacy Act 1988 and was subject to ethics approval. NATSIHMS was approved by the Australian Government Department of Health and Ageing’s Departmental Ethics Committee, and at a jurisdictional level for New South Wales (Aboriginal Health and Medical Research Council Ethics Committee), South Australia (Aboriginal Health Research Ethics Committee), Western Australia (Western Australian Aboriginal Health Ethics Committee; Western Australia Country Health Service Research Ethics Committee), Northern Territory (Central Australian Human Research Ethics Committee; Human Research Ethics Committee of the Northern Territory Department of Health; Menzies School of Health Research) and Queensland (several Human Research Ethics Committees of Queensland Government Hospital and Health Services districts). All participants in the NATSIHMS signed written informed consent prior to participation.
Serum 25-hydroxyvitamin D concentration
Blood samples (fasting was not required) were stored at –80°C before analysis using a liquid chromatography-tandem MS method that is certified to the RMP (Douglass Hanly Moir Pathology)(Reference Sempos, Vesper and Phinney1). Vitamin D deficiency was defined as serum 25(OH)D concentration <50 nmol/l (with moderate/severe deficiency <30 nmol/l), the preferred cut-points used in Australia(Reference Nowson, McGrath and Ebeling21,22) . These cut-points align with those of the Institute of Medicine, although the definition varies: the Institute of Medicine defines vitamin D deficiency as <30 nmol/l, while practically all persons are sufficient at serum 25(OH)D concentrations of 50 nmol/l and above(23). To align with previous reports on the prevalence of vitamin D deficiency in the Australian population(Reference Malacova, Cheang and Dunlop24–Reference Horton-French, Dunlop and Lucas26), we have also reported the proportion of the population with serum 25(OH)D concentration <75 and ≥75 nmol/l. Finally, we report the proportion of the population with serum 25(OH)D concentration >125 nmol/l, considered by the Institute of Medicine to be the cut-point above which the potential for harm increases(23). Due to small numbers, the Australian Bureau of Statistics reported all values at or below 15 nmol/l as 15 nmol/l, and all values at or above 130 nmol/l as 130 nmol/l. To account for any lower and higher concentrations, we assigned all values of 15 nmol/l as 7·5 nmol/l and all values of 130 nmol/l as 165 nmol/l.
Potential predictors of vitamin D deficiency
We categorised age as 18–24, 25–34, 35–44, 45–54, 55–64 or ≥65 years. Region of residence was categorised as ‘remote’ or ‘non-remote’. ‘Remote’ is referred to as the aggregation of the Australian Statistical Geography Standard Remoteness Areas of ‘Remote Australia’ and ‘Very Remote Australia’, defined from Statistical Area Level 1(20). State/territory recruitment sites were New South Wales (32 °S), Victoria (37 °S), Queensland (21 °S), South Australia (30 °S), Western Australia (26 °S), Tasmania (42 °S), Northern Territory (19 °S) and Australian Capital Territory (35 °S). Tasmania (42 °S) and Australian Capital Territory (35 °S) were combined by the Australian Bureau of Statistics. Due to confidentiality concerns, we could not combine data for both state and remoteness, but remoteness occurs at all latitudes(27).
The 2011 Index of Relative Socio-economic Disadvantage was used to describe socio-economic status. The Index of Relative Socio-economic Disadvantage is a socio-economic index for the general Australian population that summarises information relating to the social and economic resources of people and households within an area, with scores ranging from low to high. A low score indicates relatively greater overall disadvantage. Scores were categorised into quintiles. Educational attainment was described as ‘High/primary/no school’ (high school or less), ‘Certificate/diploma’ (technical and further education) or ‘University’. Smoking status was defined as ‘current smoker’ or ‘ex/non-smoker’. BMI was categorised as underweight (<18·5 kg/m2), healthy weight (18·5–24·9 kg/m2), overweight (25·0–29·9 kg/m2) or obese (≥30·0 kg/m2)(28). Due to small numbers of underweight participants, we grouped underweight and healthy weight together. Month of blood collection was categorised by season in order to provide a proxy measure of differences in UV radiation intensity across the year. We used the standard definition of Australian seasons: ‘spring (September–November)’, ‘summer (December–February)’, ‘autumn (March–May)’ or ‘winter (June–August)’. However, we acknowledge that the categorisation and understanding of seasons for Aboriginal Australians are distinct and vary by cultural group. Unfortunately, the available data precluded a comprehensive examination of outcomes by Aboriginal seasons across all applicable regions.
Statistical analyses
Data were weighted to the Australian Aboriginal and Torres Strait Islander estimated resident population living in private dwellings in Australia at 30 June 2011, based on the 2011 Census of Population and Housing(20). Survey-weighted characteristics of participants, stratified by sex, were summarised using numbers and proportions. We reported prevalence of vitamin D deficiency (serum 25(OH)D concentration <50 nmol/l), <75 and ≥75 nmol/l, stratified by sex and age group, and also stratified by state/territory. We reported mean serum 25(OH)D concentration by sex and month of blood collection.
Survey-weighted logistic regression models were used to determine the independent predictors of vitamin D deficiency in men and women. All variables were entered into the same regression models to provide adjusted OR (aOR). Predictor variables were subject to non-response, with regression models based on participants with complete data. The final, adjusted models included complete data for 1207 (of 1300) males and 1786 (of 1950) females, with incomplete cases the result of not having valid data for BMI (204 participants) and/or educational attainment (sixty-five participants). The characteristics of participants with missing data (sex, age, season, remoteness area, smoking and socio-economic status) were similar to complete cases (data not shown), precluding any need for multiple imputation. The model accounted for the stratification and clustering of the complex sample design through use of the Taylor series linearisation method. Households were weighted using analytic weights provided by the AATSIHS. We undertook sensitivity analyses to assess whether the inclusion of underweight participants in the ‘healthy weight’ category of BMI (main analyses) produced different results to a model with healthy weight participants only (online Supplementary Table S1). All analyses were conducted using SAS version 9.4 (SAS Institute).
Results
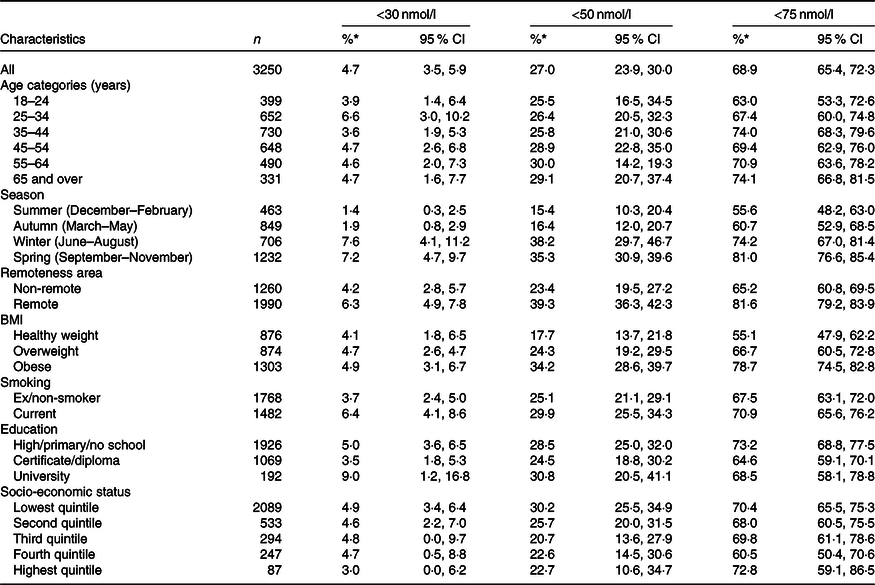
Most (78 %) participants were living in non-remote areas (Table 1). Approximately 70 % of participants were overweight or obese; 42 % of men and 36 % of women were current smokers; 4 % of men and 9 % of women had university level education; and 50 % of participants were in the lowest quintile of socio-economic status.
Table 1. Descriptive characteristics of Australian Aboriginal adults aged ≥18 years (n 3250) included in the present study
(Percentages and 95 % confidence intervals)

* Percentages and 95 % CI weighted to the Australian Aboriginal and Torres Strait Islander estimated resident population living in private dwellings of Australia at 30 June 2011, based on the 2011 Census of Population and Housing.
The inter-quartile range of serum 25(OH)D concentrations among participants was 27 nmol/l. In total, 27 % of participants (26 % men, 28 % women) were classified as vitamin D deficient, including 5 % of participants with moderate/severe vitamin D deficiency (Tables 2 and 3). Only 1 % of participants had a serum 25(OH)D concentration above 125 nmol/l. The prevalence of vitamin D deficiency ranged from 22 to 35 % across the sex and age groups, with the highest prevalence in woman aged 45–54 years (Table 3). By state/territory, the prevalence of vitamin D deficiency ranged from 21 % (Queensland) to 49 % (South Australia) (Fig. 1). The mean serum 25(OH)D concentration was lower in winter–spring (June–September) than in summer–autumn (December–March) (Fig. 2). The prevalence of vitamin D deficiency was 39 % in remote areas, compared with 23 % in non-remote areas.
Table 2. Survey-weighted prevalence of serum 25-hydroxyvitamin D concentrations <30, <50 and <75 nmol/l in Australian Aboriginal adults aged ≥18 years participating in the 2012–2013 Australian Aboriginal and Torres Strait Islander Health Survey and included in the present study (n 3250)
(Percentages and 95 % confidence intervals)
* Percentages and 95 % CI weighted to the Australian Aboriginal and Torres Strait Islander estimated resident population living in private dwellings of Australia at 30 June 2011, based on the 2011 Census of Population and Housing.
Table 3. Survey-weighted prevalence of serum 25-hydroxyvitamin D concentrations <30, <50 and <75 nmol/l in Australian Aboriginal adults aged ≥18 years participating in the 2012–2013 Australian Aboriginal and Torres Strait Islander Health Survey and included in the present study, stratified by sex (men, n 1300; women, n 1950)
(Percentages and 95 % confidence intervals)
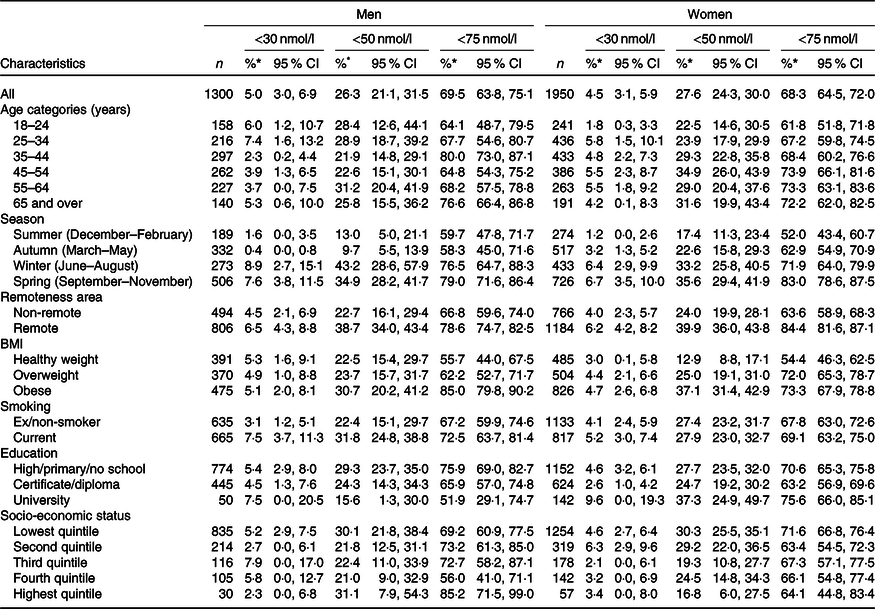
* Percentages and 95 % CI weighted to the Australian Aboriginal and Torres Strait Islander estimated resident population living in private dwellings of Australia at 30 June 2011, based on the 2011 Census of Population and Housing.

Fig. 1. Prevalence (95 % confidence intervals as error bars) of serum 25-hydroxyvitamin D concentrations <50 nmol/l (![]() ) and <75 nmol/l (
) and <75 nmol/l (![]() ) by state/territory in adults (n 3250) who participated in the 2012 National Aboriginal and Torres Strait Islander Health Survey and National Health Measures Survey (weighted to the Australian Aboriginal and Torres Strait Islander estimated resident population in 2011). NSW, New South Wales; NT, Northern Territory; QLD, Queensland; SA, South Australia; TAS, Tasmania; ACT, Australian Capital Territory; VIC, Victoria; WA, Western Australia.
) by state/territory in adults (n 3250) who participated in the 2012 National Aboriginal and Torres Strait Islander Health Survey and National Health Measures Survey (weighted to the Australian Aboriginal and Torres Strait Islander estimated resident population in 2011). NSW, New South Wales; NT, Northern Territory; QLD, Queensland; SA, South Australia; TAS, Tasmania; ACT, Australian Capital Territory; VIC, Victoria; WA, Western Australia.
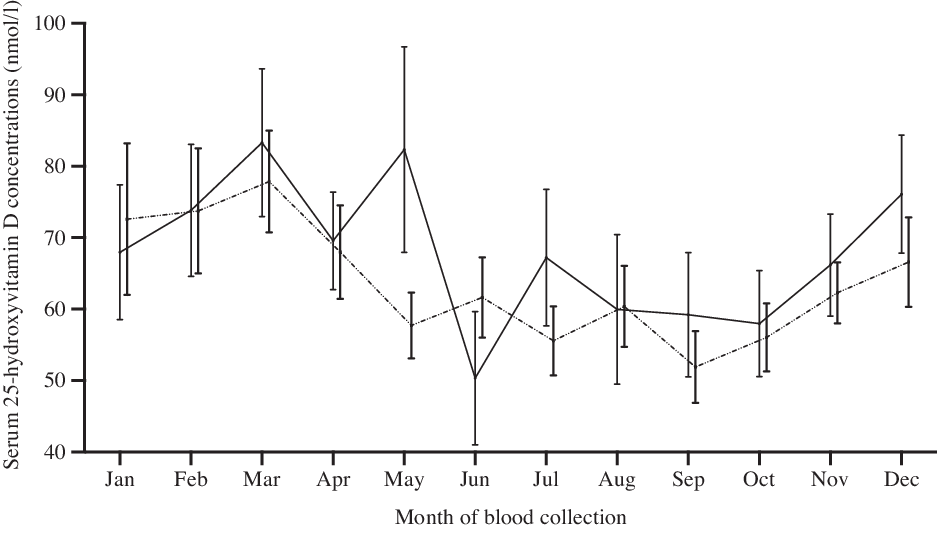
Fig. 2. Mean adjusted* serum 25-hydroxyvitamin D concentrations (with 95 % confidence intervals) in men and women aged ≥18 years who participated in the 2012 National Aboriginal and Torres Strait Islander Health Survey and National Health Measures Survey (n 1300 men, 1950 women), by month of the year (spring (September–November), summer (December–February), autumn (March–May) and winter (June–August)). ![]() , Men;
, Men; ![]() , women. * Adjusted for age group, remoteness area, BMI, smoking, education and socio-economic status.
, women. * Adjusted for age group, remoteness area, BMI, smoking, education and socio-economic status.
Independent predictors of vitamin D deficiency included being assessed during winter (men, aOR 5·6; 95 % CI 2·2, 14·6; women, aOR 2·2; 95 % CI 1·3, 3·8) and spring (men, aOR 3·3; 95 % CI 1·4, 7·6; women, aOR 2·6; 95 % CI 1·5, 4·5) compared with summer, and being categorised as obese (men, aOR 2·6; 95 % CI 1·2, 5·4; women, aOR 4·2; 95 % CI 2·7, 6·6) compared with being a healthy weight (Table 4). Statistically significant associations were also evident for current smokers (men only, aOR 2·1; 95 % CI 1·2, 3·5), persons living in remote areas (women only, aOR 2·0; 95 % CI 1·3, 2·9) and those with a university education (women only, aOR 2·4; 95 % CI 1·2, 4·5). There were no statistically significant associations between age group or socio-economic status and vitamin D deficiency. Further, there were only slight changes to these effects in sensitivity analyses that excluded underweight participants from the healthy weight category of the measure of BMI (online Supplementary Table S1).
Table 4. Unadjusted and adjusted survey-weighted logistic regression models investigating predictors of vitamin D deficiency (serum 25-hydroxyvitamin D concentrations <50 nmol/l) in Australian Aboriginal adults aged ≥18 years participating in the 2012–2013 Australian Aboriginal and Torres Strait Islander Health Survey and included in the present study, stratified by sex (men, n 1207; women, n 1786)
(Odds ratios and 95 % confidence intervals)

Ref, reference.
* Adjusted for all other variables.
Discussion
A total of 27 % of Aboriginal and Torres Strait Islander adults participating in the 2011–2013 AATSIHS were vitamin D deficient, of whom 5 % had moderate/severe vitamin D deficiency. The prevalence was 23 % in non-remote areas, increasing to 39 % in remote areas. As expected, given the higher latitude, vitamin D deficiency was most prevalent in the southern states of South Australia and Tasmania.
The high prevalence of vitamin D deficiency in the Aboriginal and Torres Strait Islander population, particularly in remote areas, such as the Northern Territory, may be a result of changes in diet and lifestyle post-colonisation. Clothing and the structure and use of housing have changed since colonisation and may have contributed to decreases in sun exposure and the amount of time spent outdoors. Traditional diets, consisting of bush tucker (hunted and foraged foods), would likely have been high in vitamin D due to the consumption of organ meat and, in coastal and river communities, fish(Reference Kouris-Blazos and Wahlqvist29). Fish is a good source of vitamin D(Reference Dunlop, Cunningham and Sherriff30), while organ meats, such as liver and kidney, tend to contain more vitamin D than muscle meat(Reference Schmid and Walther31,32) . In contrast, contemporary diets in remote communities consist largely of energy-dense, non-nutritious foods, reflecting food availability in local stores(Reference Pollard, Landrigan and Ellies33–35). Such foods are almost certainly devoid of vitamin D, which is found naturally in fish, meat, eggs and small amounts in dairy.
There are very few vitamin D-fortified foods in Australia, other than margarine, which is fortified on a mandatory basis(36). Manufacturers may voluntarily add vitamin D to a limited range of foods(36); however, it is not common practice and generally occurs in only a small selection of dairy products and dairy alternatives, breakfast cereals and powdered drink formulations. Given the small range of vitamin D-fortified foods on the market, these are unlikely to contribute substantially to vitamin D status among Aboriginal and Torres Strait Islander people. Furthermore, due to a lack of comprehensive and reliable vitamin D food composition data for Australian foods, there are no accurate estimates of vitamin D intakes in the Australian population. Previous estimates of 2–4 μg/d(Reference Nowson, Margerison and Nowson37,Reference Liu, Arcot and Cunningham38) in the general Australian population were based on a very limited number of foods and/or used vitamin D food composition data determined by analytical methodology that is now considered unreliable for measuring vitamin D. Hence, it is not possible to assess the contribution of dietary vitamin D intake to vitamin D status in the Aboriginal and Torres Strait Islander population.
Prior to the AATSIHS, the largest study on vitamin D status in Aboriginal and Torres Strait Islander people was conducted between 2007 and 2011 by Maple-Brown and colleagues in 592 adults from the Northern Territory, Far North Queensland and Western Australia(Reference Maple-Brown, Hughes and Lu6). Despite living at a low latitude (median latitude 16·4 °S for Aboriginal and 10·6 °S for Torres Strait Islander people), almost a third (31 %) of participants were vitamin D deficient (25(OH)D < 50 nmol/l). Another study at a higher latitude in South Australia (between latitudes 31 and 35 °S) found that 62 % of Aboriginal and Torres Strait Islander adults recruited between 2008 and 2009 had serum 25(OH)D concentrations ≤60 nmol/l(Reference Vanlint, Morris and Newbury7).
Similar to other studies, including the general Australian population(Reference Malacova, Cheang and Dunlop24) and in Aboriginal and Torres Strait Islander populations(Reference Vanlint, Morris and Newbury7,Reference Willix, Rasmussen and Evans10) , the prevalence of vitamin D deficiency was higher among those assessed during winter and spring, compared with those assessed during summer. Due to the elliptical orbit of Earth (further from the sun in winter in the Southern Hemisphere), and the tilt of Earth’s axis, lower UV irradiance in winter reduces the potential for cutaneous synthesis of vitamin D. Cloud cover also reduces the cutaneous synthesis of vitamin D(Reference Kimlin39).
Age was not a significant predictor of vitamin D deficiency in Aboriginal and Torres Strait Islander adults, which conflicts with findings in the general population. We have previously shown that the highest prevalence of vitamin D deficiency in the general Australian adult population was in younger adults(Reference Malacova, Cheang and Dunlop24), which may reflect the higher use of vitamin D supplements in older adults. Although the prevalence of single vitamin D supplement use in Australia is generally low, it is higher in older adults than younger adults and higher in women than men(Reference Black, Jacoby and Nowson40). Although information on supplement use was not available for our Aboriginal and Torres Strait Islander study population, supplement use data were collected in the National Aboriginal and Torres Strait Islander Nutrition and Physical Activity Survey. One in eight (12 %) Aboriginal people reported taking at least one dietary supplement(41), which is substantially lower than the general Australian population (29 %)(42). Sunscreen use is another factor that may vary according to age. While a recent review found that use of low-sun protection factor sunscreens did not appear to negatively affect 25(OH)D concentration, the effect of higher-sun protection factor sunscreens, which are commonly available and recommended for use in Australia, remains unclear(Reference Neale, Khan and Lucas43). Recent analysis of data from National Sun Protection Surveys from 2010 to 2011, 2013 to 2014 and 2016 to 2017 showed that older Australians were more likely than younger Australians to be concerned about their vitamin D status and less likely than younger Australians to use sunscreen(Reference Tabbakh, Wakefield and Dobbinson44). Although the sample for each study year was found to be representative of the general Australian population with regard to skin type(Reference Tabbakh, Wakefield and Dobbinson44), these findings may not represent sunscreen use practices in the Aboriginal and Torres Strait Islander population. To our knowledge, there are no data on sunscreen use in the Aboriginal and Torres Strait Islander population. Similar to the general Australian population(Reference Malacova, Cheang and Dunlop24), socio-economic status was not associated with vitamin D deficiency.
Strengths of our study include the use of a nationally representative sample of the adult Aboriginal population and the use of a National Institute of Standards and Technology-Ghent-US Centers for Disease Control and Prevention certified method for measuring serum 25(OH)D concentrations. Our finding that 78 % of AATSIHS participants resided in non-remote areas corresponds with statistics from the 2011 Census, which found that 79 % of Aboriginal and Torres Strait Islander respondents lived in non-remote areas(45). The AATSIHS collected comprehensive data on demographic and lifestyle characteristics, allowing us to investigate a number of potential predictors of vitamin D deficiency. However, we were not able to consider the effects of supplements, diet or sun exposure on vitamin D deficiency, as these data were not available for the full study population of the AATSIHS. Physical activity was not assessed in remote-dwelling participants; hence, it was not included in our analyses. Furthermore, due to confidentiality issues relating to small sample sizes, we were not able to compare the prevalence of vitamin D deficiency across both remoteness and state/territory.
The 2012–2013 AATSIHS provides the first estimate of the prevalence of vitamin D deficiency in a nationally representative sample of Aboriginal adults. The prevalence of vitamin D deficiency among Aboriginal adults was 23 % in non-remote areas and 39 % in remote areas; the latter is far higher than the prevalence of deficiency seen in the general Australian adult population (23 %). Similar to the general Australian population, predictors of vitamin D deficiency included being assessed during winter or spring, being obese and smoking. However, unlike the general Australian population, age group was not associated with the prevalence of vitamin D deficiency. Given the high prevalence of vitamin D deficiency among Aboriginal adults, particularly those in remote areas, there is a need to develop and promote strategies to maintain adequate vitamin D status through safe sun exposure and dietary approaches.
Acknowledgements
The Australian Aboriginal and Torres Strait Islander Health Survey (AATSIHS) was conducted by the Australian Bureau of Statistics (ABS) in 2012–2013 with funding provided through the ABS health survey programme, the Australian Government Department of Health and the National Heart Foundation of Australia. We thank the AATSIHS participants for their time and contribution to the survey.
R. M. L. is supported by an Australian National Health and Medical Research Council Senior Research Fellowship. L. J. B. is supported by a Multiple Sclerosis Research Australia Postdoctoral Fellowship and a Curtin University Research Fellowship. E. D. would like to acknowledge the Australian Government Research Training Program Scholarship in supporting this research.
R. M. L. and L. J. B. designed the study; C. C. J. S. analysed and interpreted the data; L. J. B. wrote the paper; E. D., R. M. L., C. C. J. S., B. F. and G. P. provided critical revision of the manuscript for important intellectual content; L. J. B. had primary responsibility for the final content. All the authors read and approved the final version of the manuscript.
The authors declare that there are no conflicts of interest.
Supplementary material
For supplementary material referred to in this article, please visit https://doi.org/10.1017/S0007114520003931


