


Age-related decline in muscle mass and strength (sarcopenia) is associated with impaired independence and poor quality of life, as well as increased morbidity and all-cause mortality risk( Reference Guralnik, Simonsick and Ferrucci 1 – Reference Beaudart, Reginster and Petermans 5 ). The mechanisms of sarcopenia are most likely multi-factorial, in which low protein intake is among the suggested underlying causes( Reference Houston, Nicklas and Ding 6 – Reference Isanejad, Mursu and Sirola 11 ).
High-quality proteins contain branched-chain amino acids (BCAA; leucine, isoleucine and valine), which are not synthesised in the human body. A postprandial increase in BCAA has been observed, leading to a rapid increase of plasma BCAA and uptake into muscle tissue( Reference Wahren, Felig and Hagenfeldt 12 – Reference Nishioka, Imaizumi and Ando 15 ). Intramuscular concentration of BCAA, particularly leucine, stimulates the muscle protein synthesis, as well as decreases muscle protein breakdown, and an anabolic response occurs when the synthesis exceeds the breakdown( Reference Forslund, El-Khoury and Olsson 16 – Reference Baum, Kim and Wolfe 22 ). Increased availability of amino acids when ingested, infused or from increased protein intake has been shown to stimulate the muscle protein synthesis, and a positive linear relationship between essential amino acids intake and the anabolic response has been suggested( Reference Deutz and Wolfe 20 , Reference Baum, Kim and Wolfe 22 – Reference Wolfe 24 ). In addition, positive associations between serum concentrations of leucine, isoleucine and valine, and other metabolites of BCAA and both thigh muscle cross-sectional area and fat-free mass index, have been observed in functionally limited older adults( Reference Lustgarten, Price and Chale 25 ). Further, plasma concentrations of the BCAA have been shown to be elevated 12 h after a high- v. low-protein meal( Reference Nishioka, Imaizumi and Ando 15 ). Available data on blood concentration of BCAA in relation to sarcopenia are limited.
In a systematic review including forty-six studies among community-dwelling older adults (mean age ≥65 years), in which twenty-one studies were national nutrition surveys, it was shown that 10–12 % did not meet the estimated average requirement for protein of 0·66 g/kg body weight (BW) per d( Reference ter Borg, Verlaan and Mijnarends 26 ). Little is known about the protein intake among sarcopenic subjects( Reference Verlaan, Aspray and Bauer 4 , Reference Ter Borg, de Groot and Mijnarends 9 , Reference Park, Ham and Lee 27 ). The aim of the present study was to compare the non-fasting plasma concentrations of the BCAA and the dietary protein intake between sarcopenic and non-sarcopenic home-dwelling older adults.
Methods
Participants
The present study was conducted from August 2014 to July 2015 at Oslo and Akershus University College of Applied Sciences, Norway. Invitation letters were sent to men and women (≥70 years) living in the area of Skedsmo, Norway, and listed in the National Population Register. It was stated in the invitation letter that all subjects should meet for one visit, and they were informed that eligible subjects could be asked to participate in another study, a randomised trial (RCT) that aimed to study the effect of protein-enriched milk on muscle mass and strength. Thus, the present cross-sectional study also served as a screening visit for the RCT (Clinicaltrials.gov, ID no. NCT02218333)( Reference Ottestad 28 ). There were no other exclusion criteria for participation than age. A total of 2820 subjects were invited, 477 (17 %) responded to the invitation and 438 (16 %) met for participation. One subject withdrew the informed consent and body composition was not assessed in twenty subjects, mainly owing to the use of pacemaker. Thus, 417 subjects were included in this cross-sectional study. The flow chart for recruitment and inclusion in the final analysis is shown in Fig. 1. This study was conducted according to the guidelines laid down in the Declaration of Helsinki, and all procedures involving human subjects were approved by the Regional Committees for Medical and Health Research Ethics, Health Region South East, Norway (2014/150/REK). Written informed consent was obtained from all participants. Extracts from the National Population Registry were used according to, and with approval from, the Norwegian Tax Administration.
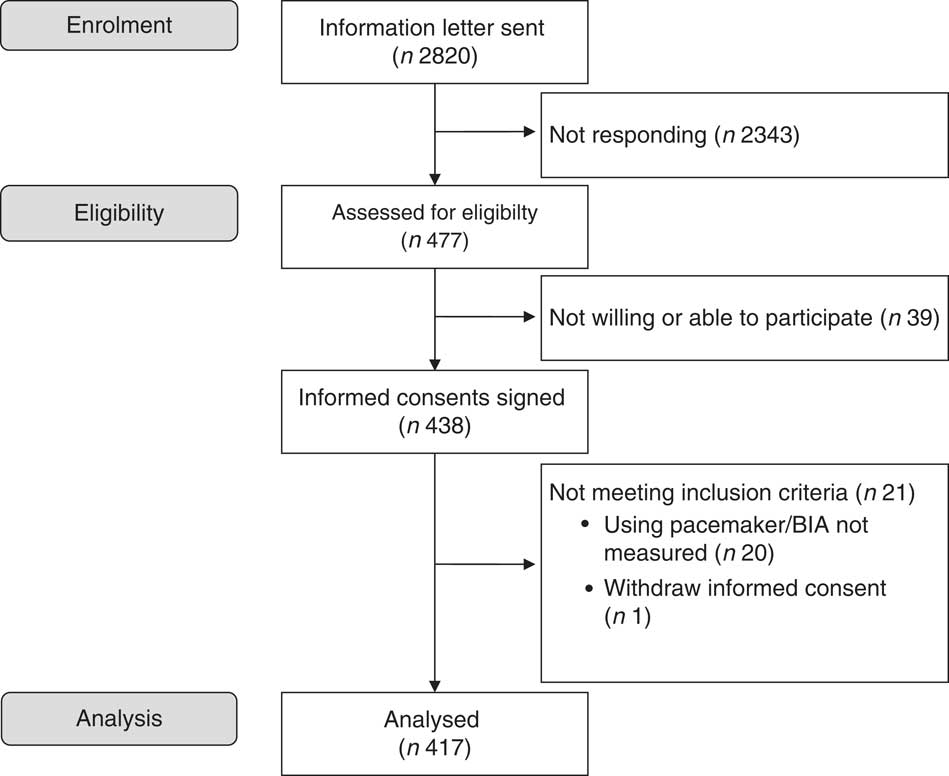
Fig. 1 Flow chart of the study participants. BIA, bioimpedance analyser.
Assessment of sarcopenia, cognitive health and malnutrition
The suggested diagnostic criteria and cut-off points by the European Working Group on Sarcopenia in Older People (EWGSOP) were used to identify subjects with both low muscle mass and low muscle strength and/or physical performance (sarcopenia)( Reference Cruz-Jentoft, Baeyens and Bauer 7 ). Height (cm) was measured using the Harpenden Stadiometer (Holtain Ltd). A Tanita 100 bioimpedance analyser (BIA) (BC-418; Tanita Corp.) and the regression equation by Janssen et al. were used to assess skeletal muscle (SM) mass (SM=((Ht2/R×0·401)+(sex×3·825)+(age×−0·71))+5·102, where Ht is height (cm), R is BIA resistance (Ω), for sex, men=1 and women=0, and age in years were used( Reference Janssen, Heymsfield and Baumgartner 29 ). Further, skeletal muscle mass index (SMI) was defined as SM (kg)/height (m2), and was used to identify subjects with reduced muscle mass( Reference Cruz-Jentoft, Baeyens and Bauer 7 ). According to EWGSOP, subjects with SMI<8·87 kg/m2 and <6·42 kg/m2 in men and women, respectively, were categorised as subjects with reduced muscle mass( Reference Cruz-Jentoft, Baeyens and Bauer 7 ). Between-day CV% (sd/mean) of the BIA measurement of fat-free mass was calculated in a subgroup (n 46). Each subject was measured twice, on separate days. The between-day CV% was 1·8.
Handgrip strength of both hands was measured, using a digital handheld dynamometer (KE-MAP80K1; Kern Map). The maximum handgrip strength of three measurements from each hand was registered, and reduced handgrip strength was defined as <20 kg in women and <30 kg in men( Reference Cruz-Jentoft, Baeyens and Bauer 7 ). The between-day CV% for handgrip strength of the dominant hand was calculated from three measurements on two separate days (n 47). The between-day CV% was 5·0.
Furthermore, a four-metre gait speed test was conducted, which was prepared according to the protocol of the Short Physical Performance Battery (SPPB) test( Reference Cavazzini, Conti and Bandinelli 30 ). Subjects with gait speed <0·8 m/s were characterised as subjects with reduced functional performance( Reference Cruz-Jentoft, Baeyens and Bauer 7 ).
Subjects with reduced SMI, but with normal muscle strength and functional performance, were defined as non-sarcopenic subjects. Subjects with reduced SMI and with reduced handgrip strength and/or reduced gait speed were categorised as sarcopenic( Reference Cruz-Jentoft, Baeyens and Bauer 7 ).
Cognitive function was measured by the Mini-Mental State Examination (MMSE) form( Reference Tombaugh and McIntyre 31 ) and the Mini Nutritional Assessment form (MNA)® was used to identify subjects with malnutrition.
Plasma concentrations of amino acids and other metabolites
Non-fasting venous blood samples were collected between 09.00 and 13.00 hours. Average time from the last meal was 2 h and 24 min among sarcopenic subjects and 2 h and 18 min among non-sarcopenic subjects. Plasma EDTA was prepared according to standardised protocols, aliquoted and frozen (−80°C). NMR spectroscopy was used to quantify plasma concentrations of non-fasting amino acids (essential amino acids: leucine, valine, isoleucine, phenylalanine, tyrosine and histidine, and non-essential amino acids: alanine and glutamine), and the plasma concentrations of glycolysis-related metabolites (lactate and citrate), and ketone bodies (acetate and 3-hydroxybutyrate). The NMR platform used (Nightingale Health; www.brainshake.fi) has been applied in other human studies( Reference Fischer, Kettunen and Wurtz 32 , Reference Inouye, Kettunen and Soininen 33 ), and the experimental protocol, sample preparation and spectroscopy method are described elsewhere( Reference Soininen, Kangas and Wurtz 34 ). The CV% for the BCAA and other amino acids measured was <3·5 and <10, respectively, and ≤10 and <6 for glycolysis-related metabolites and ketone bodies, respectively( Reference Kettunen, Demirkan and Wurtz 35 ). Routine serum and whole blood samples were prepared according to standardised protocols and analysed at an accredited medical laboratory (Fürst Medical Laboratory).
Dietary assessment
A dietitian performed two 24-h dietary recalls in eligible subjects using a personal computer-assisted face-to-face interview and an unannounced telephone interview after >14 d. Only subjects with an MMSE score≥24 (the maximal score is 30) were interviewed. We lack dietary data from twenty subjects with MMSE score lower than 24 points, and from eight subjects who did not complete two 24-h recall interviews owing to different reasons; for example we were not able to reach the participant for a telephone interview. The interviews were conducted in a three-step process as described in detail elsewhere( Reference Myhre, Loken and Wandel 36 ). Briefly, the first step involved a review of the foods and drinks consumed the previous day. Second, detailed information about the food and portion sizes was collected. The third step involved a checklist with foods and snacks that are easily forgotten, such as fruits, pastries, chocolate and dietary supplements. Food quantities were assessed by use of the Norwegian food quantification booklet with photographs of foods in different portion sizes. At the first interview, the participants received the Norwegian food quantification booklet. During the second (telephone) interview, the participants quantified the portion sizes by using the same food quantification booklet with photographs. When couples met for a visit, the partner was asked to clarify details if necessary. All 24-h recall interviews were checked for errors in coding by a second nutritionist, and the highest and lowest energy and nutrient intakes were checked for plausibility. Dietary supplements were included in the analyses. The interviews were conducted between Monday and Friday. An in-house data program (KBS version 7.0) linked to the Norwegian Food Composition Table from 2006, which was supplied with additional food items from reliable sources, was used to calculate the nutrient intake.
Statistical analyses
On the basis of previous findings in the literature, a priori power calculation was performed. We hypothesised that the correlation between protein intake and SM mass is 0·27. With the power of 80 %, we need to include 105 participants to show that such a correlation is significantly higher than 0 at the significance level of 5 %. In order to be able to adjust the association for covariates of relevance (13 altogether) in a multiple linear regression model, 131 participants were required. The present study served as a screening visit for an RCT where a large number of subjects were assessed for eligibility (twenty-eight). Thus, the number of participants included in this cross-sectional study became larger than suggested by the power calculation.
For continuous variables, independent-samples t tests and Mann–Whitney U tests were used in normally distributed and not normally distributed data, respectively. For categorical variables, the χ 2 test was used, whereas Fischer’s exact test was used for small groups. All normally distributed continuous data, such as the plasma concentration of the BCAA, are presented as means (standard deviation), not normally distributed data are presented as median (interquartile range) and categorical data as count (%). Using plasma amino acids concentrations and nutrient intakes as dependent variables, linear regression analyses were used to investigate differences between sarcopenic and non-sarcopenic subjects when adjusted for sex. Level of significance was defined as P<0·05, and all tests were two-sided. All analyses were performed using SPSS for Windows (version 22.0; SPSS, Inc.).
Results
Characteristics of the study population
A total of 417 community-dwelling older women (n 218, 52 %) and men (n 199, 48 %) were included in this study. In total, 22 % (n 90) of the subjects were classified as sarcopenic, and more women (17 %) than men (5 %) were sarcopenic (P<0·0001). The sarcopenic subjects were significantly older, and they were characterised by significantly lower total MMSE, MNA and SPPB score (P<0·05). The descriptive statistics for the study population are further outlined in Tables 1 and 2.
Table 1 Characteristics of the study population (Mean values and standard deviations; medians and 25th–75th percentiles; numbers and percentages)

MMSE, Mini-Mental State Examination; MNA, Mini Nutritional Assessment; SPPB, Short Physical Performance Battery; 25-OD-vitamin D, 25-hydroxyvitamin D; HbA1c, glycosylated Hb.
* Three missing.
† Two missing.
‡ Twenty-one missing.
§ Twenty-three missing.
‖ Thirteen missing.
¶ Fifteen missing.
Table 2 Anthropometry, physical strength and muscular function in sarcopenic v. non-sarcopenic subjects (Mean values and standard deviations; numbers and percentages)

* Between sarcopenic and non-sarcopenic men.
† Between sarcopenic and non-sarcopenic women.
‡ Two missing.
Plasma amino acids and other metabolites
The sarcopenic subjects had significantly lower non-fasting plasma concentration of leucine (P<0·0001), isoleucine (P=0·004) and valine (P<0·008) when compared with the non-sarcopenic subjects (Table 3). The non-fasting plasma concentrations of other essential and non-essential amino acids, and of glycolysis-related metabolites and ketone bodies, were similar between the groups (P>0·05). After sex adjustment, non-fasting plasma concentrations of leucine and isoleucine, but not valine, remained significantly different between sarcopenic and non-sarcopenic subjects (P=0·003, P=0·026 and P=0·053, respectively). We also investigated whether there were differences in the ratio of blood concentrations of the BCAA to BW (BCAA (mmol/l)/BW (kg)) between sarcopenic and non-sarcopenic subjects. No significant differences between the groups were observed for blood concentrations of leucine and isoleucine when adjusted for BW (P=0·82 and P=0·24, respectively). Valine was significantly higher among subjects with sarcopenia (P=0·010). Very strong positive correlations (r>0·8) between leucine and isoleucine and valine were observed (P<0·0001 for both) (online Supplementary Table S1), and moderate to strong positive correlations (0·4<r<0·8) were observed between leucine and phenylalanine, tyrosine and histidine (P<0·0001 for all). Finally, in a linear regression analysis where sex and leucine were included as independent variables, non-fasting leucine concentration was significantly correlating with SM/height (R=0·82, R 2=0·67, P<0·0001) and with handgrip strength (R=0·80, R 2=0·64, P=0·030).
Table 3 Plasma concentrations (mmol/l) of amino acids (Mean values and standard deviations)

BCAA, branched-chain amino acids.
* Between sarcopenic and non-sarcopenic subjects.
† Between sarcopenic and non-sarcopenic subjects when adjusted for sex.
Dietary intake
The absolute protein intake calculated from the 2×24-h recall interview showed a significantly lower intake among the sarcopenic compared with non-sarcopenic subjects (66·8 (sd 21·4) v. 80·3 (sd 28·2) g proteins/d, P<0·0001, respectively), which remained significantly different after sex adjustments (P=0·003) (Table 4). No significant difference in absolute intake of protein was observed for breakfast, lunch or dinner after sex adjustment between the two groups (Table 4). Among both sarcopenic and non-sarcopenic subjects, a significantly higher intake of protein was observed for dinner when compared with lunch and breakfast (P<0·0001 for all comparisons) (Table 4). When the absolute intake of protein was adjusted for BW and sex, a similar protein intake was observed between sarcopenic and non-sarcopenic subjects (1·1 g protein/kg BW per d; P=0·63). Intake of other macronutrients was similar between the two groups (Table 4), but the energy intake remained significantly lower among the sarcopenic subjects after sex adjustment (P=0·003). A linear relationship was observed between energy (kJ (kcal)) intake and absolute intake of protein (g/d) when sex and sarcopenia were included in the model (R=0·68, R 2=0·46, P<0·0001). Intakes of micronutrients in sarcopenic and non-sarcopenic subjects are shown in the online Supplementary Table S2. After sex adjustment, intake of Ca, Mg and K was significantly lower in sarcopenic compared with non-sarcopenic subjects. The intake of Ca, Mg and K was significantly lower in sarcopenic and non-sarcopenic subjects when compared with dietary recommendations in older adults( 37 ). Regular use of dietary supplements was reported in 83 and 74 % of the sarcopenic and non-sarcopenic subjects, respectively. The most frequently used dietary supplement was cod liver oil/fish oil supplements, which were used among 68 and 57 % of the sarcopenic and non-sarcopenic subjects, respectively.
Table 4 Dietary intake from 2×24-h recalls of the study population

* Between sarcopenic and non-sarcopenic subjects.
† Between sarcopenic and non-sarcopenic subjects when adjusted for sex.
‡ Within-group comparisons between dinner v. lunch and dinner v. breakfast (P<0·001 for all comparisons).
§ n 369.
‖ n 294.
¶ n 74.
** n 235.
†† n 194.
‡‡ n 44.
§§ n 369.
‖‖ n 271.
¶¶ n 67.
*** n 161 subjects reported intake of alcohol (128 among the non-sarcopenic and thirty-three among the sarcopenic subjects).
Discussion
In the present study, we observed that sarcopenia among community-dwelling older adults, characterised by the EWGSOP criteria, is associated with lower non-fasting plasma concentrations of the BCAA leucine and isoleucine, and a lower absolute intake of protein compared with non-sarcopenic subjects. This study suggests that postprandial amino acids kinetics and metabolism should be further investigated to elucidate the clinical relevance of lower non-fasting plasma concentrations of BCAA in sarcopenic older adults.
In a cross-over study in healthy adult men, intake of a high v. normal protein meal in the evening (116 g of protein, 40 of energy intake (E%) v. 35 g of protein, 15 % E%, respectively) showed an increased plasma concentration of BCAA the next morning, 12 h after intake( Reference Nishioka, Imaizumi and Ando 15 ). Postprandial plasma concentrations of amino acids (including leucine) and basal muscle protein synthesis response were similar over 5 h in healthy older men (approximately 62 years) after intake of 25 g of whey protein, where a habitual low v. high protein intake (0·7 v. 1·5 g protein/kg BW per d, respectively) was followed for 14 d in advance of the test meal( Reference Gorissen, Horstman and Franssen 38 ). The authors suggest reduced postprandial splanchnic amino acid retention in subjects with low habitual protein intake( Reference Gorissen, Horstman and Franssen 38 ). This is in line with findings in previous studies that have suggested that essential amino acids can be retained in the gut, and temporarily stored( Reference Wahren, Felig and Hagenfeldt 12 , Reference Deutz and Wolfe 20 , Reference Soeters, de Jong and Deutz 39 ). In the present study, the total daily amount of protein was significantly lower among the sarcopenic subjects. Whether a lower daily intake of protein over time leads to lower non-fasting plasma concentration of the BCAA, in particular, needs to be further investigated. In addition, we are unable to elucidate whether the plasma concentration of BCAA could be related to protein intake in certain meals. However, prospective long-term follow-up studies have shown that older adults have reduced ability to maintain muscle mass and functional performance from a low protein intake, similar to ≤0·8 g/kg BW per d( Reference Houston, Nicklas and Ding 6 , Reference Isanejad, Mursu and Sirola 11 , Reference Meng, Zhu and Devine 40 ). Non-fasting plasma concentrations of amino acids from long-term intake of low v. high protein intake need to be further investigated, with net anabolic response and/or the muscle mass maintenance included as end points. The present cross-sectional study shows that sarcopenic subjects have lower non-fasting plasma concentrations of amino acids that are highly relevant in the prevention of sarcopenia. We also show very strong correlations between leucine and both isoleucine and valine, and between leucine and both SMI (adjusted for height) and maximum handgrip strength (dominant hand). Whether plasma concentrations of BCAA, and especially of leucine, are potential biomarkers of sarcopenia, providing useful information beyond dietary assessments, needs further investigation. At present, no optimal or minimum plasma concentrations of the BCAA required for maintenance of SM mass have been defined. Increased plasma and intramuscular concentration of leucine, in particular, stimulates the muscle protein synthesis by activation of the mammalian target of rapamycin (mTOR) signalling pathway, as well as decreasing muscle protein breakdown( Reference Bohe, Low and Wolfe 17 , Reference Pasiakos and McClung 19 , Reference Kim, Schutzler and Schrader 21 ). Older adults may be less responsive to activation of the mTOR signalling pathway by amino acids than younger adults (anabolic resistance)( Reference Katsanos, Kobayashi and Sheffield-Moore 41 – Reference Paddon-Jones, Sheffield-Moore and Zhang 43 ). Thus, higher protein intake has been suggested to be necessary to maximally stimulate postprandial muscle protein synthesis in order to slow or prevent sarcopenia in older adults( 37 ). Hence, the clinical relevance of the significantly lower plasma concentrations of the BCAA and leucine in particular, in relation prevention of sarcopenia, needs further investigations.
A higher protein intake has been recommended in older v. younger adults to maximally stimulate postprandial muscle protein synthesis and prevent sarcopenia( Reference Cruz-Jentoft, Baeyens and Bauer 7 , Reference Deutz and Wolfe 20 , Reference Baum, Kim and Wolfe 22 , Reference Cuthbertson, Smith and Babraj 23 , 37 , Reference Paddon-Jones and Rasmussen 44 , Reference Bauer, Biolo and Cederholm 45 ). Our results corroborate with previous findings in sarcopenic and frail older adults, showing significantly lower absolute intake of protein when compared with non-sarcopenic and non-frail older adults( Reference Verlaan, Aspray and Bauer 4 , Reference Ter Borg, de Groot and Mijnarends 9 , Reference Park, Ham and Lee 27 , Reference Tieland, Borgonjen-Van den Berg and van Loon 46 ). However, when adjusting absolute intake of protein for BW, we and others show that sarcopenic and frail older adults have a protein intake in accordance with the dietary recommendation( Reference Ter Borg, de Groot and Mijnarends 9 , Reference Oh, Jeon and Reid Storm 10 , Reference ter Borg, Verlaan and Mijnarends 26 , Reference Park, Ham and Lee 27 , Reference Meng, Zhu and Devine 40 , Reference Tieland, Borgonjen-Van den Berg and van Loon 46 – Reference Mendonca, Hill and Granic 48 ). We also show that subjects with sarcopenia have lower plasma concentration of leucine and isoleucine, but similar concentrations to non-sarcopenic subjects when adjusting for BW. When adjusting for BW, subjects with lower BW (e.g. sarcopenic subjects) have increased likelihood of an adequate protein intake and to obtain similar blood concentration of essential amino acids as non-sarcopenic subjects. If the plasma concentration of leucine is important in order to dictate the amplitude of the muscle anabolic response to protein ingestion, adjusting with BW might not be an appropriate approach. Further, when adjusting protein intake for BW, the protein intake on individual- and not group-aggregated level was used. Thus, these results need to be interpreted with caution. Because of the study design, we are not able to conclude whether there is a cause–effect relationship between the self-reported protein intake and the plasma concentrations of amino acids, or between SM mass and energy and absolute protein intake over time.
Sex adjustment did not reveal differences in the protein intake for breakfast, lunch or dinner between the sarcopenic and non-sarcopenic older adults. However, a significantly higher protein intake for dinner, compared with lunch and breakfast, was observed in both groups. Protein intake pattern has been suggested to be advantageous in older adults for optimal muscle protein synthesis( Reference Mamerow, Mettler and English 49 ), and lower protein intake (<20 g/meal) has shown reduced muscle protein synthesis in older v. younger subjects( Reference Cuthbertson, Smith and Babraj 23 ). However, the evidence for a more beneficial effect from the protein intake pattern than the total daily protein intake on the net anabolic response and maintenance of SM mass seems to be lacking( Reference Baum, Kim and Wolfe 22 , Reference Bauer, Biolo and Cederholm 45 , Reference Kim, Schutzler and Schrader 50 ).
Previous studies comparing dietary intakes in sarcopenic and non-sarcopenic adults (≥65 years) suggest lower dietary intakes of protein, n-3 fatty acids, folic acid, vitamin B6, vitamin E and Mg in sarcopenic adults( Reference Ter Borg, de Groot and Mijnarends 9 , Reference Oh, Jeon and Reid Storm 10 ). If energy intake is insufficient, proteins are being used in gluconeogenesis to produce glucose, and increased muscle protein breakdown may occur. However, we were not able to reveal any difference in self-reported weight loss in the last 3 months or in blood concentration of glycolysis-related metabolites and ketone bodies between sarcopenic and non-sarcopenic subjects. However, changes may have occurred over time, which we are unable to detect in the current study. The lower intakes of micronutrients among the sarcopenic subjects in the present study (Ca, Na, K and Mg) are most likely caused by the lower food intake among the sarcopenic subjects. The lower intakes in both groups of Ca, Mg and K than recommended intake for older adults (≥65 years) may suggest that that the diet is not adequate in older adults. Another explanation could be under-reporting. Because of high intra-individual variability on dietary intake, it has been suggested that subjects should record 24-h recall consumption for at least 3 d in order to obtain data at the individual level( 51 ). Although a valid dietary method was used to assess the dietary intake, the aggregated data at the group level are not suitable for correcting for misreporting, which demands energy intake at an individual level. Thus, in our study, we were unfortunately not able to correct for under-reporting.
There are some limitations in the present study. Non-fasting measurement of amino acids might reflect the amino acid metabolism, but it is equally plausible that it reflects the content of protein in the last meal or the time since their last meal. However, the time from the last meal was similar between sarcopenic and non-sarcopenic subjects. Because the blood samples were drawn early in the morning and latest 13.00 hours, we assume that few persons had the main meal with a large amount of protein before the blood samples. Unfortunately, we did not collect information about which meals they had eaten before the blood sample. Further, the reliability of using one non-fasting blood sample for measuring amino acids and metabolites may be questioned. Data from the European Prospective Investigation into Cancer and Nutrition (EPIC) study have shown that the reliability of amino acids over a 2-year period did not differ according to fasting status, but weaker reliability over time was observed in some amino acids, including the BCAA( Reference Carayol, Licaj and Achaintre 52 ). More studies are therefore needed to conclude. In most studies, no relationship between sex and sarcopenia prevalence has been suggested( Reference Cruz-Jentoft, Landi and Schneider 53 ). The prevalence of sarcopenia in the present study is affected by the methods used and the cut-offs made by the EWGSOP, but we are not able to explain why more women than men were diagnosed with sarcopenia in the present study. Since men contributed less with their characteristics in the common estimate for those with sarcopenia, sex adjustment was performed when searching for differences between sarcopenic and non-sarcopenic subjects. The low response rate (17 %) could under- or over-estimate the prevalence of sarcopenia in the present study, but this may not necessarily lead to a biased relationship between variables, such as the very strong relationship observed between leucine and the SMI and handgrip strength. Unfortunately, we have no standardised information to report on daily physical activity level. The present study had a much larger sample size than calculated a priori. As the absolute number of sarcopenic subjects included is affected by the prevalence of sarcopenia, the larger sample size is a major strength. A lager sample size also made it possible to detect small differences in plasma BCAA concentrations between sarcopenic and non-sarcopenic subjects. Further investigation is needed to determine the clinical relevance of the differences.
This present study shows that sarcopenic older adults have a lower absolute intake of protein and lower non-fasting plasma concentrations of leucine and isoleucine, when compared with non-sarcopenic subjects. By adjusting for BW, the protein intake is similar and adequate in both groups. More studies are needed to define the optimal plasma levels of BCAA in relation to maintenance of muscle mass and prevention of sarcopenia. Whether the plasma concentrations of BCAA have a potential as biomarkers of sarcopenia should be further investigated.
Acknowledgements
The authors gratefully acknowledge the participants who volunteered in this study, and the authors thank Ellen Raael, Marit Sandvik, Kristin Torvik and Nima Wesseltoft-Rao for valuable assistance in this project.
The present study was supported by the Research Council of Norway (grant no. 225258/E40), Oslo and Akershus University College of Applied Sciences, University of Oslo, Throne Holst Foundation for Nutrition Research and TINE SA. During the past 5 years, S. M. U. has received research grants from Mills DA and Olympic Seafood, none of which are related to the content of this manuscript. During the past 5 years, K. B. H. has received research grants or honoraria from Mills DA, Olympic Seafood, Amgen, Sanofi and Pronova, none of which are related to the contents of this manuscript. The Research Council of Norway had no role in the design, analysis or writing of this article.
I. O., S. M. U., L. F. A., G. O. G., A. S. B. and K. B. H. conceived and designed the study; I. O., L. K. L. Ø., N. A. S., K. S. S. and A. B. conducted the research; I. O., S. M. U. and K. B. H. interpreted and performed statistical analyses; and I. O., S. M. U. and K. B. H. wrote the paper and had the primary responsibility for final content. All authors have critically reviewed the manuscript.
G. O. G. and A. S. B. are researchers employed in TINE SA, Oslo, Norway. They have no financial interest to declare. I. O., L. K. L. Ø., K. S. S., A. B., N. A. S. and L. F. A. have no conflicts of interest.
Supplementary material
For supplementary material/s referred to in this article, please visit https://doi.org/10.1017/S0007114518001307


