A 63-year-old, otherwise healthy female presented with a one-year history of gait difficulties. Her neurological examination was only remarkable for mild spasticity and hyperreflexia of the left leg, indicating an upper motor neuron process. Nerve conduction studies/electromyography did not show lower motor neuron involvement, and somatosensory-evoked potentials were normal. Motor-evoked potentials (MEPs) were not performed. Clinical follow-up over two years revealed progressive ascending spastic hemiparesis. Brain magnetic resonance imaging (MRI) showed right-sided perirolandic atrophy (Figure 1-A) but was reported at the time as normal. Cervical spine MRI showed only moderate cervical stenosis, with no cord indentation or signal abnormality. The progressive spastic hemiparesis with perirolandic atrophy was, in retrospect, related to Mills’ syndrome. Reference Jaiser, Mitra, Williams and Baker1 The patient continued to show progressively increasing tone of the left leg, and stiff-limb syndrome was considered. However, antiglutamic acid decarboxylase-65 was negative, CSF was noninflammatory, and no functional improvement was observed with multiple immunotherapies. On clinical follow-up over three more years, progressive rigidity, dystonia, myoclonus, and apraxia of the left leg more than the left arm was observed, meeting the criteria for possible corticobasal syndrome (CBS). Reference Armstrong, Litvan and Lang2 Repeat brain MRI revealed the progression of right-sided perirolandic atrophy (Figure 1-B) that was noted in retrospect on imaging performed three years prior, and to a lesser extent right more than left generalized frontoparietal atrophy. Brain fluorodeoxyglucose-positron emission tomography (FDG-PET) scan (Figure 1-C,D) revealed right-sided perirolandic hypometabolism and predominantly right-sided supplemental motor area (SMA) hypometabolism. On review of her clinical course and recent neuroimaging she was diagnosed with Mills’ syndrome progressing to CBS, and immunotherapy for query stiff-limb syndrome was discontinued.

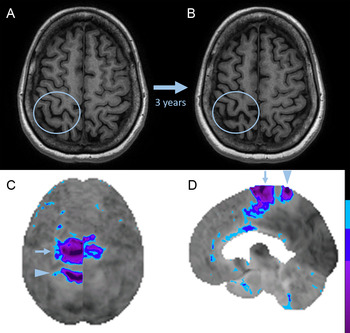
Figure 1: Brain MRI and FDG-PET in Mills’ syndrome with progression to corticobasal syndrome.
Axial T1-weighted images (A, B) show progression of central sulcal widening indicative of perirolandic atrophy (blue circles) over three years. Surface-rendered superior (C, image inverted horizontally to align with MRI) and right parasagittal (D) images of the FDG-PET Z-score images (normalized to the whole brain) show right-sided perirolandic hypometabolism (arrowhead; precentral gyrus right-left Z-score difference of −2.56, postcentral gyrus right–left Z-score difference of −2.67) and right-sided supplementary motor area hypometabolism (arrow; supplementary motor area right–left Z-score difference of −3.01).
Mills’ syndrome refers to the rare clinical presentation of idiopathic, slowly progressive ascending spastic hemiparesis. Reference Jaiser, Mitra, Williams and Baker1 Recently proposed diagnostic criteria require progressive ascending hemiparesis for four years or greater, paraclinical evidence of upper motor neuron dysfunction by cervical cord MRI or MEPs, and exclusion of features suggesting alternative diagnoses. Reference Jaiser, Mitra, Williams and Baker1 Although our patient had a normal cervical cord MRI and did not have MEPs performed, other paraclinical evidence of upper motor neuron dysfunction was present on brain imaging and all other proposed criteria for Mills’ syndrome were met. Mills’ syndrome is classically thought to fall within the spectrum of motor neuron disease, and evolution to both amyotrophic lateral sclerosis and primary lateral sclerosis (PLS) has been described. Reference Jaiser, Mitra, Williams and Baker1 Features supporting its classification as a motor neuron disease include perirolandic atrophy on MRI as well as perirolandic hypometabolism on FDG-PET, which has been recognized in PLS and recently highlighted in three cases of Mills’ syndrome. Reference Jaiser, Mitra, Williams and Baker1,Reference Van Laere, Wilms and Van Damme3 However, there has been some heterogeneity in the progression of patients with an initial clinical phenotype of Mills’ syndrome, including patients with features of CBS. Reference Van Laere, Wilms and Van Damme3–Reference Marsili, Dickson and Espay5 To date, FDG-PET findings in a patient with progression from Mills’ syndrome to CBS has not been reported. Our patient had prominent right-sided SMA hypometabolism and perirolandic hypometabolism; both findings have been described in CBS. Reference Pardini, Huey and Spina6 Histopathological evidence of globular glial tauopathy involving the motor and premotor cortices, corticospinal tract, putamen, and caudate of a patient with Mills’ syndrome who also had features of CBS indicates that these distinct clinical phenotypes may share an underlying proteinopathy in rare instances. Reference Marsili, Dickson and Espay5 Increased awareness of the unique disease progression from Mills’ syndrome to CBS reported herein is necessary to avoid misdiagnosis and facilitate the study into clinico-pathological correlation with other neurodegenerative presentations.
Disclosures
The authors have no conflicts of interest to declare.
Statement of Authorship
AM: literature review, drafted the manuscript
JR: Critical revision of the manuscript for intellectual content
MJ: Critical revision of the manuscript for intellectual content
AB: Design and conceptualization, critical revision of the manuscript for intellectual content