


Introduction
Bullying is a widespread phenomenon worldwide (Biswas et al., Reference Biswas, Scott, Munir, Thomas, Huda, Hasan, Vries, Baxter and Mamun2020) and there is evidence that bullying involvement is associated with later maladjustment, for both the victim and the bully. Victimization is mostly associated with later internalizing problems, such as anxiety and depression (Moore et al., Reference Moore, Norman, Suetani, Thomas, Sly and Scott2017; Ttofi et al., Reference Ttofi, Lösel, Farrington and Loeber2011), and perpetration with later externalizing problems, such as offending (Ttofi et al., Reference Ttofi, Farrington and Lösel2012) and substance use (Vrijen et al., Reference Vrijen, Wiertsema, Ackermans, van der Ploeg and Kretschmer2021). Links between bullying and maladjustment are often, explicitly or implicitly, presented as causal. For instance, a recently published meta-analysis on outcomes of peer victimization explicitly suggested strong evidence of a causal link between being a victim of bullying and developing internalizing symptoms, proposing that being bullied causes depression, anxiety, and suicidal ideation (Moore et al., Reference Moore, Norman, Suetani, Thomas, Sly and Scott2017). However, bullying involvement, internalizing problems, and externalizing problems are heritable (Johansson et al., Reference Johansson, Huhtamäki, Sainio, Kaljonen, Boivin and Salmivalli2020; Kendler et al., Reference Kendler, Lönn, Maes, Lichtenstein, Sundquist and Sundquist2016; Nivard et al., Reference Nivard, Dolan, Kendler, Kan, Willemsen, Beijsterveldt, Lindauer, Beek, Geels, Bartels, Middeldorp and Boomsma2015; Veldkamp et al., Reference Veldkamp, Boomsma, de Zeeuw, van Beijsterveldt, Bartels, Dolan and van Bergen2019) and it is plausible that partly the same genes explain bullying involvement and later maladjustment (Silberg et al., Reference Silberg, Copeland, Linker, Moore, Roberson-Nay and York2016). Genetic confounding, where the same genes explain both the predictor and outcome, may partly or fully explain the associations between bullying involvement and later maladjustment. We applied a novel strategy to account for genetic confounding (Pingault et al., Reference Pingault, Rijsdijk, Schoeler, Choi, Selzam, Krapohl, O’Reilly and Dudbridge2021), showcasing the method in the field of bullying research. Bullying research provides an excellent example because of what is already known about the heritability of bullying involvement and maladjustment and the frequently implied causality in this field.
Quantitative and molecular genetic approaches can be used to investigate genetic confounding in studies on exposures and later maladjustment. The method we applied here combines information from both approaches. The quantitative genetic approach often uses twin studies where correlations are compared between monozygotic and dizygotic twin pairs to estimate the heritability of traits. Heritability is indicated when a trait shows a higher correlation between monozygotic twins than between dizygotic twins (henceforth "twin heritability"). Bivariate twin models include information on two traits: exposure and outcome. In these models, the covariance between two traits is decomposed into genetic and environmental components. Bivariate heritability reflects how much of the association between the traits can be explained by their genetic overlap. This overlap may be due to not only direct causal effects of genetic factors influencing both traits, referring to genetic confounding, but also causal effects of one genetically influenced trait on another (Pingault et al., Reference Pingault, Rijsdijk, Schoeler, Choi, Selzam, Krapohl, O’Reilly and Dudbridge2021). Figures S1 and S2 (Supplemental material 2) provide a graphical representation of the difference. No actual genetic material is used in quantitative genetics.
The molecular approach uses participants’ genetic material, for instance in genome-wide association studies where all common genetic variants, mostly single-nucleotide polymorphisms (SNPs), are tested against a trait of interest by regressing the trait on all SNPs. These studies enable deduction of the explanatory power of all variants combined. Heritability estimates resulting from genome-wide association studies differ from twin heritability estimates and are termed SNP heritability, which amounts to the proportion of trait variance explained by all common genetic variants combined (Yang et al., Reference Yang, Benyamin, McEvoy, Gordon, Henders, Nyholt, Madden, Heath, Martin, Montgomery, Goddard and Visscher2010). Compared with the average twin heritability of human traits of 49% (Polderman et al., Reference Polderman, Benyamin, de Leeuw, Sullivan, van Bochoven, Visscher and Posthuma2015), SNP heritability estimates are much lower. For example, for Major Depressive Disorder twin heritability is 37% and SNP heritability only 8.9% (see Pingault et al. (Reference Pingault, Allegrini, Odigie, Frach, Baldwin, Rijsdijk and Dudbridge2022) for more examples). Twin heritability estimates may be inflated because of non-captured shared environmental confounding factors and SNP heritability may be deflated by not accounting for rare effects (Manolio et al., Reference Manolio, Collins, Cox, Goldstein, Hindorff, Hunter, McCarthy, Ramos, Cardon, Chakravarti, Cho, Guttmacher, Kong, Kruglyak, Mardis, Rotimi, Slatkin, Valle, Whittemore and Visscher2009; Owen & Williams, Reference Owen and Williams2021). In the present study, we used both types of heritability estimates: twin heritability as the trait variance that can be explained by quantitative genetics and SNP heritability as the trait variance that can be explained by molecular genetics approaches.
Based on effect sizes from genome-wide association studies, polygenic scores can be created as index scores of an individual’s genetic predisposition for a certain trait. Polygenic scores are constructed using summary statistics from genome-wide association studies and genetic information of the participants of the target sample. The summary statistics contain the strengths of the association between each genetic variant (SNP) and the tested trait (Belsky & Harden, Reference Belsky and Harden2019). A polygenic score for a specific trait is computed for each individual in the target sample as the sum of alleles the individual carries weighted by the strength of their association with the trait from the summary statistics. The resulting polygenic score can be used as a regular variable in statistical models, for instance, to test whether genetic predispositions confound associations between exposure and maladjustment. The amount of trait variance explained by a polygenic score is typically substantially lower than the SNP heritability of the trait, because its accuracy depends on the sample size of the genome-wide association study. The SNP heritability estimate provides the upper boundary of the predictive power of the polygenic score in the sense that if genetic effects could be estimated without error from genome-wide association studies and there were no differences between discovery samples used in genome-wide association studies and target samples used in subsequent analyses, the predictive power of the polygenic score would be equal to SNP heritability (Choi et al., Reference Choi, Mak and O’Reilly2020). Genome-wide association studies require large sample sizes because that provides more accurate SNPS effects reducing the noise level and hence increases the proportion of explained phenotypic variance. The benefit of polygenic scores is that they can be used in studies of unrelated individuals and require much smaller sample sizes than genome-wide association studies, but an important downside is that they capture only a fraction of the total genetic effect.
What do we know already about genetic influence on bullying and on the link between bullying and later maladjustment? Genetic influence has more frequently been investigated for victimization than for perpetration and mostly using twin studies (Brendgen et al., Reference Brendgen, Comtois-Cabana and Ouellet-Morin2021). Twin heritability estimates range mostly between 65 and 77% for bullying victimization (Ball et al., Reference Ball, Arseneault, Taylor, Maughan, Caspi and Moffitt2008; Johansson et al., Reference Johansson, Huhtamäki, Sainio, Kaljonen, Boivin and Salmivalli2020; Veldkamp et al., Reference Veldkamp, Boomsma, de Zeeuw, van Beijsterveldt, Bartels, Dolan and van Bergen2019), although lower estimates between 0 and 48% have been reported as well (e.g., Silberg et al., Reference Silberg, Copeland, Linker, Moore, Roberson-Nay and York2016). Twin heritability estimates range between 61 and 70% for bullying perpetration (Ball et al., Reference Ball, Arseneault, Taylor, Maughan, Caspi and Moffitt2008; Johansson et al., Reference Johansson, Huhtamäki, Sainio, Kaljonen, Boivin and Salmivalli2020; Veldkamp et al., Reference Veldkamp, Boomsma, de Zeeuw, van Beijsterveldt, Bartels, Dolan and van Bergen2019). Bivariate heritability estimates suggest that between 44 and 68% of the link between victimization and depression can be explained by shared genetic effects (Brendgen et al., Reference Brendgen, Zheng, Vitaro, Dionne and Boivin2022; Connolly & Beaver, Reference Connolly and Beaver2016; Kretschmer et al., Reference Kretschmer, Tropf and Niezink2018). Brendgen et al. (Reference Brendgen, Zheng, Vitaro, Dionne and Boivin2022) reported separate bivariate heritability estimates for links between chronic victimization and three distinct longitudinal depression trajectories. Shared genetic effects explained 71% of the link between chronic victimization and an overall low depressive symptom trajectory and 80% of the link between chronic victimization and an increasing depressive symptom trajectory. No genetic overlap was found between chronic victimization and a high-decreasing-increasing depressive symptom trajectory (Brendgen et al., Reference Brendgen, Zheng, Vitaro, Dionne and Boivin2022). So far, this is circumstantial evidence of genetic confounding because bivariate heritability may be due to not only genetic confounding but also causal effects of one genetically influenced trait on another (Kretschmer et al., Reference Kretschmer, Tropf and Niezink2018; Pingault et al., Reference Pingault, Rijsdijk, Schoeler, Choi, Selzam, Krapohl, O’Reilly and Dudbridge2021). The only twin study that separated these effects found that genetic confounding accounted for 42% of the association between bullying victimization and depression and causal influences of bullying victimization accounted for 58% of the association with depression (Kretschmer et al., Reference Kretschmer, Tropf and Niezink2018). The bivariate heritability of the link between bullying perpetration and later externalizing problems has not been examined.
Only few molecular genetic studies report on potential genetic links between bullying and internalizing and externalizing problems. A polygenic score for depression predicted not only depression but also becoming a victim of bullying (Armitage et al., Reference Armitage, Wang, Davis and Haworth2021; Schoeler et al., Reference Schoeler, Choi, Dudbridge, Baldwin, Duncan, Cecil, Walton, Viding, McCrory and Pingault2019), suggesting that the same genetic factors may explain part of the association between bullying victimization and depression. However, reported associations between polygenic scores for depression and bullying victimization were very small, with beta estimates ranging between 0.042, 95% CI [0.014–0.071] (Schoeler et al., Reference Schoeler, Choi, Dudbridge, Baldwin, Duncan, Cecil, Walton, Viding, McCrory and Pingault2019) and 0.163, 95% CI [0.059–0.266] and an estimated R 2 of 0.42% (Armitage et al., Reference Armitage, Wang, Davis and Haworth2021). A polygenic score for conduct disorder, which is a type of externalizing disorder, predicted involvement in bullying (Musci et al., Reference Musci, Bettencourt, Sisto, Maher, Uhl, Ialongo and Bradshaw2018), but without differentiating between bullying perpetration and victimization.
To summarize, studies on genetic confounding of the association between bullying involvement and later maladjustment are scarce, particularly studies that can differentiate between genetic confounding and causal effects of one genetically influenced trait on another. Additionally, molecular genetic studies suffer from the disadvantage that polygenic scores only explain a fraction of genetic influence and are therefore not optimally suited for studying genetic confounding. We used a novel method (Pingault et al., Reference Pingault, Rijsdijk, Schoeler, Choi, Selzam, Krapohl, O’Reilly and Dudbridge2021) to directly investigate genetic confounding by estimating the remaining effect of bullying involvement on later maladjustment after adjusting for genetic confounding without removing causal effects of one genetically influenced trait on another. This method extends the use of observed polygenic scores by controlling for (hypothetical) polygenic scores that capture more of the total genetic effect. To this end, polygenic scores are inflated to the size of SNP heritability or twin heritability. These analyses are based on heritability estimates reported in other studies, thus no actual twin data are required. As a reminder: SNP heritability estimates reflect the upper boundaries of the proportion of phenotypic variance polygenic scores would potentially explain if genetic effects were estimated without error from genome-wide association studies. Twin heritability estimates reflect the proportion of variance genetic effects would potentially explain if polygenic scores captured all genetic variance. This method partly overcomes the limitation that polygenic scores capture only a fraction of the total genetic effect. The resulting models are best interpreted as simulations based on hypothetical scenarios. The Methods section and Supplemental material 3 provide additional methodological detail.
We aim to showcase how this novel method informs about genetic confounding in bullying research. To this end, we revisited associations between bullying involvement and later maladjustment that are most strongly supported by meta-analytic evidence. These included: (1) the positive prospective association between bullying victimization and internalizing problems; and (2) the positive prospective association between bullying perpetration and externalizing problems. We used data from a prospective cohort study that includes genetic data to investigate the extent to which genetic confounding accounts for the associations between bullying involvement and later maladjustment. We focused on early to middle adolescence because bullying is particularly prevalent then (Analitis et al., Reference Analitis, Velderman, Ravens-Sieberer, Detmar, Erhart, Herdman, Berra, Alonso and Rajmil2009). For the main analyses, we used self-report measures. In sensitivity analyses, we used data from different reporters to assess the risk of inflated results due to shared method variance and to facilitate the interpretation of genetic confounding effects. Interpretation of genetic confounding effects for associations between exposure (bullying involvement) and maladjustment (internalizing and externalizing problems) is particularly challenging when the exposure is self-reported rather than objective (Pingault et al., Reference Pingault, Allegrini, Odigie, Frach, Baldwin, Rijsdijk and Dudbridge2022). Self-reported bullying involvement may not only be influenced by objective bullying involvement, but also by a perception bias that may partly be influenced by a vulnerability for internalizing or externalizing problems. This seems particularly plausible for the association between victimization and internalizing problems. Not only may characteristics that make a person more vulnerable for internalizing problems make the person a more likely target of bullying, the negative perception bias that is part and parcel of internalizing problems may also make it more likely to perceive certain peer behaviors as bullying. Objective bullying involvement and perception bias may both be influenced by genetic predispositions for internalizing or externalizing problems. We compared outcomes of self-report measures of bullying involvement to outcomes based on peer nominations, which are considered more objective measures, to distinguish between the different scenarios (Baldwin & Degli Esposti, Reference Baldwin and Degli Esposti2021; Pingault et al., Reference Pingault, Allegrini, Odigie, Frach, Baldwin, Rijsdijk and Dudbridge2022).
Method
Sample and procedure
We used data from the TRacking Adolescents’ Individual Lives Survey (TRAILS), an ongoing prospective cohort study investigating mental health and social development from early adolescence into adulthood. TRAILS was approved by the Dutch Central Committee on Research Involving Human Subjects, participants were treated in accordance with the Declaration of Helsinki, and informed written consent was acquired from adolescents and parents.
TRAILS consists of two cohorts, a population-based cohort and a high-risk cohort. The participants of the population cohort were recruited from primary schools (response rate 90%) in five municipalities in the north of the Netherlands. Of all eligible children, n = 2,229 (76%) agreed to participate (for more details on the selection procedure: De Winter et al., Reference De Winter, Oldehinkel, Veenstra, Brunnekreef, Verhulst and Ormel2005). Participants of the high-risk cohort had been in contact with a specialized mental health service in the north of the Netherlands before the age of ten. Of all eligible participants who were invited to participate in the study, n = 543 (43%) agreed to participate. The data collection in both cohorts involved largely the same measures and participants were assessed at approximately the same ages, every two to three years (for more details on the study and included measures: Oldehinkel et al., Reference Oldehinkel, Rosmalen, Buitelaar, Hoek, Ormel, Raven, Reijneveld, Veenstra, Verhulst, Vollebergh and Hartman2015). We used data from the first, second, and third waves (T1–T3) of both cohorts.
At T1, the mean age of the population cohort was 11.1 years (SD = 0.6), and 51% were female; at T2, 2149 adolescent participated (retention rate 96%), the mean age was 13.6 years (SD = 0.5), and 51% were female; at T3, 1816 adolescent participated (retention rate 81%), the mean age was 16.3 years (SD = 0.7), and 52% were female. At T1, the mean age of the high-risk cohort was 11.1 years (SD = 0.5) and 34% were female; at T2, 462 adolescents participated (retention rate 85%), the mean age was 12.8 years (SD = 0.6), and 34% were female; at T3, 419 adolescents participated (retention rate 77 %), the mean age was 15.9 years (SD = 0.7), and 34% were female (Oldehinkel et al., Reference Oldehinkel, Rosmalen, Buitelaar, Hoek, Ormel, Raven, Reijneveld, Veenstra, Verhulst, Vollebergh and Hartman2015).
Participants were included in the present study if: (1) data were available on bullying involvement on T1, T2, or both, and (2) data were available on internalizing or externalizing problems at T3, and (3) genetic data were available. The resulting data set contained a small number of sibling pairs, which could bias our results. Therefore, one sibling per pair was removed, retaining the sibling with most data available. If this was the same for both siblings, we retained the one with the highest subject ID number. This resulted in a sample size of n = 1,604 for the main analyses: 1,297 participants from the population cohort and 307 from the high-risk cohort.
Preregistration
This study has been preregistered on the Open Science Framework (OSF): https://osf.io/s52qr. Deviations from the preregistered plans as well as the results of all originally planned analyses have been reported at: https://osf.io/cvu4d/.
Measures
Polygenic scores
Supplemental material 1 describes the genotyping procedures. Polygenic scores were generated for internalizing and externalizing problems, see Table 1 for details. The polygenic scores were generated as the weighted sum of alleles using Python-based package LDPred (Vilhjálmsson et al., Reference Vilhjálmsson, Yang, Finucane, Gusev, Lindström, Ripke, Genovese, Loh, Bhatia, Do, Hayeck, Won, Kathiresan, Pato, Pato, Tamimi, Stahl, Zaitlen, Pasaniuc and Zheng2015). Weights were the effect sizes taken from the respective GWAS summary statistics (Howard et al., Reference Howard, Adams, Clarke, Hafferty, Gibson, Shirali, Coleman, Hagenaars, Ward, Wigmore, Alloza, Shen, Barbu, Xu, Whalley, Marioni, Porteous, Davies, Deary and McIntosh2019; Karlsson Linnér et al., Reference Karlsson Linnér, Mallard, Barr, Sanchez-Roige, Madole, Driver, Poore, de Vlaming, Grotzinger, Tielbeek, Johnson, Liu, Rosenthal, Ideker, Zhou, Kember, Pasman, Verweij, Liu and Dick2021) multiplied by linkage disequilibrium scores as calculated by LDPred from the combined data set of the population and high-risk samples. We used polygenic scores including all variants, without using p-value thresholds.
Table 1. GWAS descriptions and SNP- and twin-based heritability estimates

PGS = polygenic score; GWAS = genome-wide association study; a SNP heritability estimates of internalizing problems were from the same GWAS as was used to compute the polygenic score. The SNP heritability estimate based on the GWAS on externalizing problems was computed with LD Score Regression and resulted in a SNP heritability estimate of 6.1%, which is likely an underestimation of the SNP heritability of externalizing problems: the genomic SEM procedure used by Karlsson Linnér et al., yields SNP heritability estimates that do not reflect the proportion of variance explained in the phenotype externalizing problems, and polygenic scores based on the same summary statistics explained a larger proportion of the variance in externalizing problems (∼10%) than the SNP heritability estimate (6.1%). We therefore decided to use the estimate of 6.1% as the lower bound estimate of SNP heritability and test a range of SNP heritability estimates with the SNP heritability estimate of externalizing problems from another study (Pappa et al., 2015) as the upper bound estimate of SNP heritability. The upper bound estimate may be an overestimation because the method that was used (Genomic-relationship-matrix restricted maximum likelihood; GREML) does not control for population stratification.
To avoid inflated effect sizes (Wray et al., Reference Wray, Yang, Hayes, Price, Goddard and Visscher2013), the validation cohort (TRAILS) needs to be independent from the meta-GWAS results. However, data from 1,226 TRAILS participants had been used in the meta-GWAS on Externalizing problems. We used the R package MetaSubtract version 1.60 (Nolte, Reference Nolte2020a) to subtract the results of the validation cohort from the meta-GWAS results analytically and produce meta-GWAS summary statistics that are independent of the TRAILS sample (Nolte, Reference Nolte2020b). Supplemental material 1 describes this procedure in detail.
Self-report measures main analyses
Bullying victimization. Bullying victimization was assessed with a single item from the Youth Self-Report (YSR) (Achenbach & Rescorla, Reference Achenbach and Rescorla2001) at T1 and T2. Participants were asked to rate the item “I get bullied a lot” on a 3-point Likert scale (0 = “not true,” 1 = “somewhat or sometimes true,” 2 = “very true or often true”). Because severe and persistent bullying involvement is more likely to cause later maladjustments than minor or transient involvement, bullying victimization scores were aggregated over two waves by averaging scores at T1 and T2. Higher scores reflected more severe and/or more persistent victimization. The Spearman correlation (r s) between bullying victimization at the two waves was .37, p < .001). In case of missing data in one of the waves (n = 41), only data from one wave was used.
Bullying perpetration. Bullying perpetration was assessed with a single item from the YSR (Achenbach & Rescorla, Reference Achenbach and Rescorla2001) at T1 and T2. At T1, participants were asked to rate the item “I tease others a lot” on a 3-point Likert scale (0 = “not true,” 1 = “somewhat or sometimes true,” 2 = “very true or often true”). At T2 the item “I bully others a lot” was used, rated on the same scale as the T1 item. Scores at T1 and T2 (r s = .19, p < .001) were averaged if scores were available for both waves. In case of missing data in one of the waves (n = 47), only data from one wave was used.
Internalizing problems. Internalizing problems were assessed with 21 items from the Withdrawn/depressed (8 items) and Anxious/depressed (13 items) subscales from the YSR (Achenbach & Rescorla, Reference Achenbach and Rescorla2001) at T3. Items include “I am unhappy, sad, or depressed” and were rated on a 3-point Likert scale (0 = “not true,” 1 = “somewhat or sometimes true,” 2 = “very true or often true”). The internalizing problems scale was constructed by averaging the mean scores on the Withdrawn/depressed and the Anxious/depressed YSR subscales (r s = .62, p < .001) and showed good internal consistency (Cronbach’s α = .88).
Externalizing problems. Externalizing problems were assessed at T3 using 32 items from the YSR Aggressive behavior (17 items) and Delinquent behavior (15 items) subscales (Achenbach & Rescorla, Reference Achenbach and Rescorla2001). Items include “I cut classes or skip school” and “I fight a lot” and were rated on a 3-point Likert scale (0 = “not true,” 1 = “somewhat or sometimes true,” 2 = “very true or often true”). The externalizing problems scale was constructed by averaging the mean scores on the Aggressive behavior and Delinquent behavior subscales (r s = .62, p < .001) and showed good internal consistency (Cronbach’s α = .87).
Measures sensitivity analyses
Peer-nominated bullying victimization and perpetration. Peer-nominated bullying victimization and perpetration were assessed in classes with at least ten TRAILS respondents at T1. At T2, peer nominations were only assessed in classes with at least three regular TRAILS respondents or two regular TRAILS respondents on the condition that both had also participated in the peer nominations on T1. Children received a list of all classmates and were asked to nominate them on, among other things, bullying victimization and bullying perpetration. The number of nominations was unlimited and children were not required to nominate anyone. We used the total number of nominations children received from all of their classmates to generate individual bullying victimization and bullying perpetration scores. To account for differences in number of respondents per class, the number of nominations children received from their classmates was divided by the number of nominations maximally possible to compute proportions of bullying victimization and bullying perpetration at T1 and T2 for each participant. If nominations were available for both waves, the proportion scores were averaged over T1 and T2 (bullying victimization r s = .12, p = .019; bullying perpetration r s = .23, p < .001). In case of missing data in one of the waves (n = 545), only the available wave was used. Children in special needs education, in small classes, and children who either skipped or repeated a grade were not included (Veenstra et al., Reference Veenstra, Lindenberg, Oldehinkel, De Winter, Verhulst and Ormel2005). Additionally, peer nominations were only assessed in the population cohort and not in the high-risk cohort. Of all participants for whom genetic data and T3 self-reported data on internalizing and externalizing problems were available, peer nominations on bullying involvement at T1 (n = 643) or T2 (n = 646) were available for a subsample of 917 children.
Parent-reported internalizing problems. Internalizing problems were assessed at T3 using 21 items from the subscales Withdrawn/depressed (8 items) and Anxious/depressed (13 items) from the Child Behavior Checklist (CBCL) (Achenbach & Rescorla, Reference Achenbach and Rescorla2001). The CBCL subscales include items similar to the YSR items from a parent perspective and were rated on the same scale. The internalizing problems scale was constructed by averaging the mean scores on the Withdrawn/depressed and the Anxious/depressed subscales (r s = .58, p < .001) and showed good internal consistency (Cronbach’s α = .88).
Parent-reported externalizing problems. Externalizing problems were assessed with 35 items from the subscales Aggressive behavior (18 items) and Delinquent behavior (17 items) from the CBCL at T3. The CBCL subscales largely include the same items as the YSR subscales from a parent perspective and were rated on the same scale. The externalizing problems scale was constructed by averaging the mean scores on the subscales Aggressive behavior and Delinquent behavior (r s = .73, p < .001) and showed good internal consistency (Cronbach’s α = .93).
Self-reported depressive problems. Depressive problems were assessed with 13 items from the Affective problems DSM IV scale from the YSR at T3. Items include “I am unhappy, sad, or depressed” and were rated on a 3-point Likert scale (0 = “not true,” 1 = “somewhat or sometimes true,” 2 = “very true or often true”). The Depressive problems scale was constructed by averaging the item scores and showed acceptable internal consistency (Cronbach’s α = .77).
Analysis
We used the GsensY function from the R package Gsens (Pingault et al., Reference Pingault, Rijsdijk, Schoeler, Choi, Selzam, Krapohl, O’Reilly and Dudbridge2021) to test genetic confounding of associations between bullying involvement and maladjustment. Correlations between exposures, outcomes, and polygenic scores were used as input for GsensY. The following preparatory steps were taken to compute these correlations: (1) exposure and outcome variables were skewed and were log-transformed prior to further analysis; (2) all variables were adjusted for sex and population stratification: the original (log-transformed) variables were regressed on sex and the first 10 genetic principal components; and (3) the saved residuals instead of the original variables were used to estimate bivariate Pearson correlations between exposures, outcomes, and polygenic scores.
The resulting correlations were used as input for R function GsensY to estimate two linear structural equation models: one to investigate genetic confounding of the association between bullying victimization and later internalizing problems and another to investigate genetic confounding of the association between bullying perpetration and later externalizing problems. Using these models, we first tested whether polygenic scores for internalizing and externalizing problems confounded the association between bullying involvement and later internalizing and externalizing problems and estimated how strongly the original associations decreased after adjusting for genetic confounding. Second, we estimated to what extent the associations between bullying involvement and later maladjustment decreased if we controlled for polygenic scores that more fully capture the genetic effect by incorporating SNP and twin heritability estimates. Estimates of SNP heritability and twin heritability are single values retrieved from other studies that were used to estimate SNP heritability and twin heritability models with the GsensY function. Supplemental material 3 provides more details on the GsensY method. Table 1 displays the estimates of SNP and twin heritability that we used. If there was variability in the reported heritability estimates, the mean of the range was used and sensitivity checks with the high and low ends of the range were also reported. For the main analysis we used self-report measures of bullying involvement and internalizing and externalizing problems because this resulted in the largest sample size. To account for inflated effects due to shared method variance, we performed sensitivity analyses using different reporters for the exposure and outcome variable. We performed several other sensitivity analyses, including with depressive problems as narrowband internalizing phenotype, separate analyses for T1 and T2 bullying involvement, analyses based on non-transformed variables, analyses based on best-predicting polygenic scores rather than polygenic scores including all available genetic variants, and analyses based on Spearman rather than Pearson correlations.
Results
Descriptive statistics
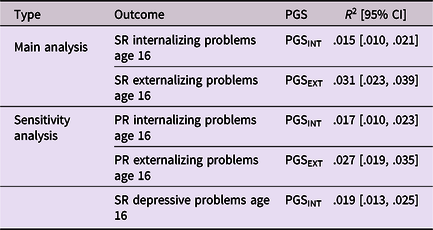
As expected, all polygenic scores reached statistical significance in explaining variance in internalizing and externalizing problems, but effect sizes were small. Internalizing and externalizing polygenic scores explained, respectively, ∼1.5% and ∼3% of the variance in internalizing and externalizing problems (see Table 2). Polygenic score plots are available on OSF (https://osf.io/cvu4d/). Table 3 provides descriptive statistics for all study variables and Tables 4 and 5 display bivariate correlations between the variables. More information on the distribution of bullying victimization and bullying perpetration can be found in Supplemental material 4.
Table 2. Explained variance in log-transformed outcome variables by polygenic scores
Note All outcome variables were log-transformed prior to estimating the variance explained by the polygenic scores.
SR = Self-report; PR = Parent-report; PGS = Polygenic score; INT = Internalizing problems; EXT = Externalizing problems.
Table 3. Descriptive statistics main study variables
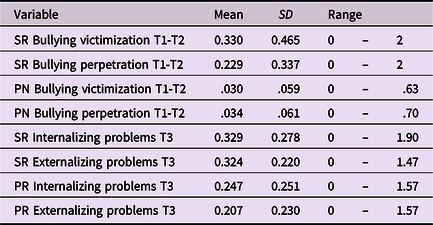
SR = Self-report; PN = Peer nominations; PR = Parent-report.
Table 4. Bivariate correlations main analyses
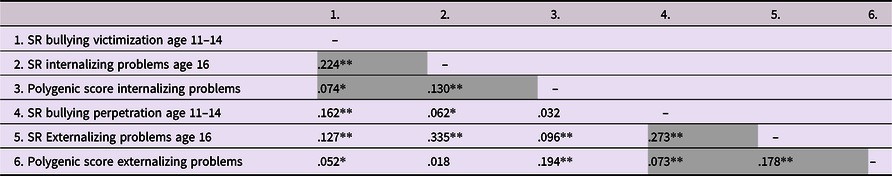
SR = Self-report; * Correlation is significant at the .05 level (two-tailed); ** Correlation is significant at the .01 level (two-tailed); all variables except polygenic scores were log-transformed and all variables were residualized for sex and 10 genetic principal components; correlations marked gray were used as input for GsensY analyses.
Table 5. Bivariate correlations sensitivity analyses with different reporters

PN = Peer nominations; SR = Self-report; PR = Parent-report; * Correlation is significant at the .05 level (two-tailed); ** Correlation is significant at the .01 level (two-tailed); all skewed variables were log-transformed and all variables were residualized for sex and 10 genetic principal components; correlations marked gray were used as input for GsensY analyses.
Main analysis
Genetic confounding of the association between bullying victimization and internalizing problems
A statistically significant association between self-reported bullying victimization at age 11–14 and self-reported internalizing problems at age 16 was observed (β = 0.224, 95% CI [0.176, 0.272]). Genetic confounding effects were statistically significant in all models. The internalizing problems polygenic score confounded this association: entering the polygenic score into the model reduced the effect by 4% compared with the original association. In the model based on the SNP heritability estimate (8.9%), the adjusted exposure-outcome association further attenuated, showing a 21% reduction compared with the original association. In the model based on the twin heritability estimate (50%), the exposure-outcome association was entirely accounted for by genetic confounding. Analysis 1A in Table 6 provides the exact estimates and 95% confidence intervals.
Table 6. Results of main analyses and sensitivity analyses

*Confounding effects and adjusted exposure-outcome effects were reported for the average SNP and twin heritability estimates, and the range represents the lower and upper bound reductions of the effect by genetic confounding. a-f The adjusted effects already reached zero with heritability estimates of, respectively, 39, 67, 40, 48, 33, and 45%, therefore the adjusted effects and confounding effects were reported for these heritability estimates rather than the higher actual (average) twin heritability estimates.
Genetic confounding of the association between bullying perpetration and externalizing problems
The association between self-reported bullying perpetration at age 11–14 and self-reported externalizing problems at age 16 was also statistically significant (β = 0.273, 95% CI [0.226, 0.320]). Genetic confounding effects were statistically significant in all models. When the polygenic score was entered into the model the original association was reduced by 4%. In the model including the SNP heritability estimate, the association was further reduced by 8–63% compared with the original association. This wide range can largely be explained by the wide range in SNP heritability estimates we used, which ranged from 6.1 to 44%. Using twin heritability estimates (62–80%), we found that the original association was almost entirely accounted for by genetic confounding. Analysis 2A in Table 6 provides more details.
Sensitivity analysis based on different reporters and more specific phenotypes
Bullying victimization and internalizing problems
Because the associations between peer-reported bullying victimization and self- or parent-reported internalizing problems were not statistically significant, genetic confounding was not tested for these models (Table 6, Analyses 1B and 1D). For the sake of transparency, the outcomes of analyses 1B and 1D are reported on OSF (https://osf.io/68cy5/). Genetic confounding of the association between self-reported bullying victimization and parent-reported internalizing problems was comparable with genetic confounding of the association between self-reported bullying victimization and self-reported internalizing problems. The inclusion of polygenic scores, SNP heritability estimates, and twin heritability estimates attenuated the original association between self-reported bullying victimization and parent-reported internalizing problems by, respectively, 4, 20, and 100% (Table 6, Analysis 1C).
Genetic confounding of the association between bullying victimization at age 11–14 and depressive problems was highly similar to genetic confounding of the association between victimization and more broadband internalizing problems. Entering the polygenic score into the model reduced the effect by 4% compared with the original association. In the model based on the SNP heritability estimate (8.9%), the adjusted exposure-outcome association further attenuated, showing a 19% reduction compared with the original association. In the model based on the twin heritability estimate (37%), the exposure-outcome association was almost entirely (88%) accounted for by genetic confounding. (Table 6, Analysis 1E).
Bullying perpetration and externalizing problems
Peer-reported bullying perpetration at age 11–14 was associated with self- and parent-reported externalizing problems at age 16 and self-reported bullying perpetration at age 11–14 was associated with parent-reported externalizing problems at age 16. No confounding effects were found for the association between peer-reported bullying perpetration and self- or parent-reported externalizing problems (Table 6, Analyses 2B and 2D). Compared with the main analysis in which self-report measures of both bullying and externalizing problems were used, genetic confounding of the association between self-reported bullying perpetration and parent-reported externalizing problems seems more pronounced. The inclusion of polygenic scores, SNP heritability estimates, and twin heritability estimates attenuated the original association by, respectively, 8, 17–100%, and 100% (Table 6, Analysis 2C).
Sensitivity analysis based on other methodological choices
Sensitivity analyses based on non-transformed variables (https://osf.io/tyx4e/) and best-predicting polygenic scores (https://osf.io/7va2z/) both produced results almost identical to the main analyses for all estimates. Sensitivity analyses based on Spearman correlations (https://osf.io/9yc4t/) resulted in generally lower observed exposure-outcome associations and point estimates of the confounding effects, but highly similar reductions of the observed effect after adjusting for genetic confounding. Genetic confounding was no longer statistically significant for twin heritability models 1A, B and 1C. When we analyzed bullying involvement at T1 and T2 separately (https://osf.io/kp8ea/), we found generally lower observed exposure-outcome associations and point estimates of the confounding effects, but highly similar reductions of the observed effect after adjusting for genetic confounding. Genetic confounding was no longer statistically significant for twin heritability model 1C. Contrary to the analyses combining bullying at T1 and T2, statistically significant confounding effects were found for models based on polygenic scores and SNP heritability estimates for the separate models based on bullying nominations at T2 (2B and D).
Discussion
Our study used a recently proposed method (Pingault et al., Reference Pingault, Rijsdijk, Schoeler, Choi, Selzam, Krapohl, O’Reilly and Dudbridge2021) to assess genetic confounding in bullying research. Bullying research provides an excellent example, because bullying involvement is often presented as part of a causal mechanism for later maladjustment and there is evidence that both bullying involvement and maladjustment are genetically influenced. The likelihood that genes explain part of the overlap between bullying involvement and later maladjustment has hardly been tested empirically. We combined the use of traditional polygenic scores with extrapolations of the polygenic scores to the size of SNP heritability and twin heritability estimates to investigate the extent to which associations between bullying involvement and later internalizing and externalizing problems are genetically confounded. In this way we were able to capture genetic effects more fully than would have been possible with traditional polygenic scores alone.
Indeed, genetic predisposition for internalizing problems confounded the association between bullying victimization and later internalizing problems. Whereas the genetic confounding effect based on polygenic scores was small, incorporating SNP-based heritability estimates decreased the association between exposure and outcome considerably. When using twin-based heritability estimates, genetic vulnerability almost completely explained the associations between bullying victimization and later internalizing problems. The same was found for the link between bullying perpetration and externalizing problems. Simply put, this means that if polygenic scores were to capture the heritability that is suggested by twin studies and are entered as genetic controls in models testing prediction of maladjustment by bullying involvement, the prediction that is now often interpreted as causal would be substantially weaker.
In detail, links between bullying involvement and later internalizing and externalizing problems are not only due to the effects of being bullied or the effects of being a bully. Shared genetic predispositions also link bullying victimization to internalizing problems and bullying perpetration to externalizing problems. Put differently, partly the same genes predict whether someone is victimized during adolescence and later suffers from internalizing problems, and partly the same genes predict whether someone bullies others during adolescence and later displays externalizing problems. Our findings suggest that genetic confounding is responsible for a considerable part of the links between bullying involvement and internalizing and externalizing problems, which is largely consistent with the findings of the one twin study that addressed genetic confounding of the link between bullying victimization and internalizing problems (Kretschmer et al., Reference Kretschmer, Tropf and Niezink2018).
We used self-report measures of bullying involvement and internalizing and externalizing problems in our main analyses because this resulted in the largest sample size. To assess the risk of inflated results due to shared method variance, we also reported outcomes based on parent-report measures of internalizing and externalizing problems. Findings were highly similar and we feel confident that our results are not driven by shared method variance. Comparing outcomes of self-report measures of bullying involvement to outcomes based on peer nominations, we only found associations between self-reported victimization and later internalizing problems and not between peer-nominated victimization and internalizing problems. This is in line with evidence suggesting that perceived rather than objective exposure to bullying is associated with later maladjustment (Baldwin & Degli Esposti, Reference Baldwin and Degli Esposti2021; Bouman et al., Reference Bouman, van der Meulen, Goossens, Olthof, Vermande and Aleva2012). In the present study, genetic predispositions confounded the association between self-reported victimization and internalizing problems, but not the association between peer-reported victimization and self-reported internalizing problems. This suggests that genetically driven perception bias at least partly explains the link between perceived bullying victimization and later internalizing problems.
The method we applied has several strengths that make it attractive to researchers interested in testing genetic confounding of other associations as well. First, the method is equipped to investigate genetic confounding directly by estimating the remaining effect after adjusting for genetic confounding, without removing causal effects of one genetically influenced trait on another. This is important because removing all genetic influence, including causal effects from, for example, genetically influenced bullying victimization to later depression, would result in an underestimation of the true causal effect that being a victim of bullying has on developing depressive symptoms. Second, the method extends the use of observed polygenic scores by examining how controlling for (hypothetical) polygenic scores that more fully capture the genetic effect would inform about genetic confounding. To this end, polygenic scores were inflated to the size of SNP heritability or twin heritability. Investigating confounding effects based on polygenic scores alone often results in negligible effects and incorporating SNP and twin heritability estimates may result in better informed estimations of genetic confounding. Third, researchers can use their own data set and do not require twin data or extremely large samples. The GsensY method can be used as long as: (1) a suitable genome-wide association study is available for the outcome trait; and (2) genome-wide genetic data are available for the target sample. Finally, the method is straightforward to use and requires from one’s own data set only bivariate correlations between an exposure, a maladjustment and a polygenic index score of maladjustment. These correlations are, together with SNP and twin heritability estimates from other studies, used as input for R package Gsens. It has been suggested that it is also possible to use correlations from other studies as input for Gsens (Pingault et al., Reference Pingault, Rijsdijk, Schoeler, Choi, Selzam, Krapohl, O’Reilly and Dudbridge2021). In this way, researchers do not need genome-wide genetic data but can use correlations between polygenic scores, exposure, and maladjustment from other studies. Ultimately, analyses could perhaps be based on correlations from high-quality meta-analyses. This would require selecting studies that used highly comparable phenotypes and samples.
Despite its strengths, the method also has caveats. Results of the models that were used to inflate effects of polygenic scores to more fully capture the genetic effect should be interpreted with caution, because they are based on hypothetical scenarios not yet possible to achieve with current polygenic scores. Outcomes are best interpreted as outcomes of simulations using evidence-based parameters derived from molecular studies (SNP heritability) and twin studies (twin heritability). Inflation of polygenic scores to the size of twin heritability estimates requires more extrapolation and introduces more uncertainty than inflation to SNP heritability estimates; not just because of the magnitude of the extrapolation, but also because of conceptual differences between the two heritability constructs (Bourrat et al., Reference Bourrat, Lu and Jablonka2017). Extrapolation from polygenic scores to twin heritability estimates assumes that effects captured in polygenic scores and twin heritability have the same confounding structure. This is a strong assumption that most likely does not hold (Pingault et al., Reference Pingault, Rijsdijk, Schoeler, Choi, Selzam, Krapohl, O’Reilly and Dudbridge2021). The extrapolation from polygenic scores to SNP heritability is more straightforward and requires a lower number of assumptions than the extrapolation to twin heritability. Under ideal circumstances, polygenic scores and SNP heritability would be identical. Effects of assortative mating and indirect genetic effects, such as genetic nurture, may be captured in polygenic scores, SNP heritability estimates, and twin heritability estimates. This means that the estimates of genetic confounding in the present study represent broader genetically related confounding rather than only genetic confounding arising from direct genetic effects (Pingault et al., Reference Pingault, Rijsdijk, Schoeler, Choi, Selzam, Krapohl, O’Reilly and Dudbridge2021). New methods have been proposed to obtain heritability estimates that are not biased by indirect genetic effects, for example relatedness disequilibrium regression (Young et al., Reference Young, Frigge, Gudbjartsson, Thorleifsson, Bjornsdottir, Sulem, Masson, Thorsteinsdottir, Stefansson and Kong2018). This method considers how related a pair of individuals is relative to what would be expected from the genetic relatedness of their parents. Unbiased heritability estimates can be obtained by using large samples of pairs of individuals with genetic information on their parents, but these types of samples are rare.
Several other factors influence the reliability of GsensY models. Simulation studies showed that the GsensY method was less reliable when the polygenic score explained only a small proportion of trait variance (∼1% or lower) and samples were smaller than 3,000 participants (Pingault et al., Reference Pingault, Rijsdijk, Schoeler, Choi, Selzam, Krapohl, O’Reilly and Dudbridge2021). In smaller samples it is wise to only use polygenic scores with substantial predictive power. The predictive power of a polygenic score partly depends on the measure of the phenotype and the sample size of the genome-wide association study it is based on (Dudbridge, Reference Dudbridge2013). The use of high-quality phenotypic measures in genome-wide association studies and increasing their sample size would benefit the predictive power of polygenic scores and the accuracy of the models that only include polygenic scores. The accuracy of the polygenic score model also affects the accuracy of the hypothetical models, because the hypothetical effects are extrapolations of the original polygenic score effect. Additionally, the reliability of the hypothetical models is influenced by the accuracy of SNP and twin heritability estimates. The accuracy of all models would improve if the studies used to derive SNP heritability or twin heritability used identical phenotypes that were close to the phenotype studied in the target sample. However, we were unable to find exact phenotypic matches and for this reason often reverted to testing a range of heritability estimates. Finally, although simulation studies suggest that the risk of collider bias is relatively low for modeling genetic confounding based on genetic predispositions for outcomes, as we did, as opposed to using genetic predispositions for exposures (Pingault et al., Reference Pingault, Rijsdijk, Schoeler, Choi, Selzam, Krapohl, O’Reilly and Dudbridge2021), we cannot rule out the possibility of collider bias.
Next to limitations inherent to the method we applied, a limitation of our specific data set was the sample size of ∼1,600, which is considerably lower than the ∼3,000 participants that are recommended for working with polygenic scores that explain ∼1% or less in trait variance (Pingault et al., Reference Pingault, Rijsdijk, Schoeler, Choi, Selzam, Krapohl, O’Reilly and Dudbridge2021). The polygenic score of internalizing problems explained only slightly over 1% of the trait variance (∼1.5%) and we should therefore interpret the estimates of genetic confounding of the association between bullying victimization and internalizing problems with a bit of caution. A second limitation pertains to our bullying involvement measures. We used single items from self-report questionnaires that were aimed to assess broader constructs of mental and behavioral problems, and did not provide definitions of bullying. Bullying and victimization scales are considered more reliable and valid than single items (Huang & Cornell, Reference Huang and Cornell2016; Thomas et al., Reference Thomas, Connor and Scott2015), particularly ones that offer definitions or examples of bullying behavior (Cornell & Bandyopadhyay, Reference Cornell and Bandyopadhyay2010; Thomas et al., Reference Thomas, Connor and Scott2015). It is difficult to determine the influence this may have had on the outcomes of the present study. For victimization, single-item measures generally result in lower prevalence rates than multiple-item assessments (Huang & Cornell, Reference Huang and Cornell2016), but for bullying, prevalence rates seem more similar (Kretschmer et al., Reference Kretschmer, Veenstra, Deković and Oldehinkel2017). Social desirability may have resulted in underreporting of the self-report measures (Kert et al., Reference Kert, Codding, Tryon and Shiyko2010). However, it is also possible that genetic vulnerability for internalizing problems partly induced a perception bias that resulted in overreporting of bullying victimization. We also included measures of bullying involvement based on peer nominations, but these measures were only available for a subsample, and analyses based on these measures may be less generalizable as children in special needs education, children in small classes, and children who either skipped or repeated a grade were not included (Veenstra et al., Reference Veenstra, Lindenberg, Oldehinkel, De Winter, Verhulst and Ormel2005). A final limitation that is quite common to bullying research is that the distributions of bullying victimization and perpetration were skewed. Log-transformations were performed but may not have prevented biased estimates.
We not only found statistically significant associations between victimization, internalizing problems, and the polygenic score of internalizing problems, but also between victimization, externalizing problems, and the polygenic score of externalizing problems (Table 4). This suggests that the association between victimization and externalizing problems is also confounded by the polygenic score of externalizing problems, perhaps partly due to the existence of a combined bullying involvement profile: some victims are also bullies themselves. We did not test this association because we aimed to study genetic confounding of two phenotypic associations for which strong evidence is available from meta-analyses and systematic reviews: the associations between victimization and internalizing problems and between perpetration and externalizing problems. For future research it may be interesting to test other associations as well and to investigate different bullying involvement groups, for example by separating pure bullies and pure victims from those with a combined profile.
Given the rapid developments in the field of social genomics, these are exciting times. The method we applied is not the only method that uses analytic methods to capture genetic effects more fully than with traditional polygenic scores. In recent years, several other methods have been proposed (Becker et al., Reference Becker, Burik, Goldman, Wang, Jayashankar, Bennett, Belsky, Karlsson Linnér, Ahlskog, Kleinman, Hinds, Caspi, Corcoran, Moffitt, Poulton, Sugden, Williams, Harris, Steptoe and Okbay2021; van Kippersluis et al., Reference van Kippersluis, Biroli, Galama, von Hinke, Meddens, Muslimova, Pereira and Rietveld2021). What these methods have in common with the method we applied is that they consider polygenic scores to be noisy estimators of SNP heritability and aim to increase the explanatory power of polygenic scores by accounting for the error component. The method we applied (Pingault et al., Reference Pingault, Rijsdijk, Schoeler, Choi, Selzam, Krapohl, O’Reilly and Dudbridge2021) was the only one to include the option to extrapolate from polygenic scores to twin heritability estimates.
Conclusion
Our findings suggest that genetic confounding needs to be considered when studying links between bullying involvement and internalizing and externalizing problems. The causal links between bullying victimization and internalizing problems and between bullying perpetration and externalizing problems are likely weaker than often assumed. Our study showcases a method that can be broadly used to assess the magnitude of genetic confounding and may prove to be highly relevant in a wide range of scientific fields, notwithstanding that caution is warranted in interpreting particularly the less straightforward extrapolations.
Supplementary material
The supplementary material for this article can be found at https://doi.org/10.1017/S0954579423000445.
Data availability statement
The data set analyzed in this study is subject to the European Union’s General Data Protection Regulation and can be requested by means of a publication plan. More information can be found at the study website: https://www.trails.nl/en/hoofdmenu/data/data-use.
The full GWAS summary statistics for the 23andMe discovery data set will be made available through 23andMe to qualified researchers under an agreement with 23andMe that protects the privacy of the 23andMe participants. Please visit https://research.23andme.com/collaborate/#dataset-access/ for more information and to apply to access the data.
Funding/Support
This research is part of the TRacking Adolescents' Individual Lives Survey (TRAILS). Participating centers of TRAILS include the University Medical Center and University of Groningen, the University of Utrecht, the Radboud University Medical Center, and the Parnassia Psychiatric Institute, all in the Netherlands. TRAILS has been financially supported by various grants from the Netherlands Organization for Scientific Research NWO (Medical Research Council program grant GB-MW 940-38-011; ZonMW Brainpower grant 100-001-004; ZonMw Risk Behavior and Dependence grants 60-60600-97-118; ZonMw Culture and Health grant 261-98-710; Social Sciences Council medium-sized investment grants GB-MaGW 480-01-006 and GB-MaGW 480-07-001; Social Sciences Council project grants GB-MaGW 452-04-314 and GB-MaGW 452-06-004; ZonMw Longitudinal Cohort Research on Early Detection and Treatment in Mental Health Care grant 636340002; NWO large-sized investment grant 175.010.2003.005; NWO Longitudinal Survey and Panel Funding 481-08-013 and 481-11-001; NWO Vici 016.130.002, 453-16-007/2735, and Vi.C 191.021; NWO Gravitation 024.001.003), the Dutch Ministry of Justice, the European Science Foundation (EuroSTRESS project FP-006), the European Research Council (ERC-2017-STG-757364 and ERC-CoG-2015-681466), Biobanking and Biomolecular Resources Research Infrastructure BBMRI-NL (CP 32), the Gratama foundation, the Jan Dekker foundation, the participating universities, and Accare Centre for Child and Adolescent Psychiatry. We are grateful to everyone who participated in this research or worked on this project to make it possible.
We thank 23andMe, Inc. and the Externalizing Consortium for allowing us to use the summary statistics of the Externalizing Consortium. The Externalizing Consortium: Principal Investigators: Danielle M. Dick, Philipp Koellinger, K. Paige Harden, Abraham A. Palmer. Lead Analysts: Richard Karlsson Linnér, Travis T. Mallard, Peter B. Barr, Sandra Sanchez-Roige. Significant Contributors: Irwin Waldman. The Externalizing Consortium has been supported by the National Institute on Alcohol Abuse and Alcoholism (R01AA015416 – administrative supplement), and the National Institute on Drug Abuse (R01DA050721). Additional funding for investigator effort has been provided by K02AA018755, U10AA008401, P50AA022537, as well as a European Research Council Consolidator Grant (647648 EdGe to Koellinger). The content is solely the responsibility of the authors and does not necessarily represent the official views of the above funding bodies. The Externalizing Consortium would like to thank the following groups for making the research possible: employees and research participants of 23andMe, Inc., Add Health, Vanderbilt University Medical Center’s BioVU, Collaborative Study on the Genetics of Alcoholism, the Psychiatric Genomics Consortium’s Substance Use Disorders working group, UK10K Consortium, UK Biobank, and Philadelphia Neurodevelopmental Cohort.
The first and senior author were funded by the European Research Council (ERC) Starting Grant awarded to Prof. Dr Tina Kretschmer under the Horizon 2020 Research and Innovation program (Grant Agreement Number 757364, Title: Ghosts from the Past – Consequences of Adolescent Peer Relations Across Contexts and Generations).
We would like to thank the Center for Information Technology of the University of Groningen for their support and for providing access to the Peregrine high performance computing cluster.
Conflict of interest
None of the authors has conflicts of interest to report.
Ethics statement
This study was approved by the Dutch Central Committee on Research Involving Human Subjects. Informed written consent was acquired from adolescents and parents.


 Open access