Body size is amongst the most interesting and meaningful of biological variables. It is correlated with basal metabolic rate (BMR), timing of activity, ontogeny, home range, diet, substrate preference, population density, trophic role and a plethora of other biological and ecological parameters (for a comprehensive background, see Smith & Savage Reference Smith and Savage1955; Hildebrand Reference Hildebrand1988; Damuth & MacFadden Reference Damuth and MacFadden1990; Brown & West Reference Brown and West2000). For instance, small animals require less food, which is advantageous in stressed conditions, whereas large animals are less vulnerable to predation and temperature fluctuations but require a comparatively larger home range. Especially for terrestrial environments, larger sizes are penalised because physical parameters impose strict limitations on physiology. Body size affects the structure and dynamics of trophic networks; for instance, ingestion rate scales at a ¾ ratio as body mass increases (Woodward et al. Reference Woodward, Ebenman, Emmerson, Montoya, Olesen, Valido and Warren2005), which often requires an increased home range to provide the necessary resources. The allometric relationship between body size and metabolism is also well known, and metabolic rate has been proposed as a fundamental biological trait in shaping ecological patterns (see Brown et al. Reference Brown, Gillooly, Allen, Savage and West2004). For these reasons and others, body size estimation is a prerequisite for most palaeobiological and palaeoecological studies. Furthermore, evolutionary changes in body size occur by means of a trade-off between ecological advantages (for instance, decreasing risk of predation) and anatomical constraints (for instance, limits for skeletal tissue strength). However, reconstructing and analysing body size in fossil taxa is challenging, because size has to be estimated from the physical dimensions of preserved remains (in vertebrates, this is usually teeth and bones).
Anteaters (Vermilingua) and sloths (Folivora) form Pilosa which, together with armoured Cingulata (armadillos, pampatheres and glyptodonts), constitute Xenarthra, one of the most remarkable clades of placental mammals, and also one of the most significant groups of Neotropical vertebrates. Today, anteaters comprise three genera (Rodrigues et al. Reference Rodrigues, Medri, de Miranda, Camilo-Alves, Mourao, Vizcaíno and Loughry2008), including the small and fully arboreal silky anteater Cyclopes (about 0.250 kg), the mid-sized and semi-arboreal lesser anteater Tamandua (about 4.5 kg), and the terrestrial giant anteater Myrmecophaga (about 30 kg) (Nowak Reference Nowak1999). The fossil record of anteaters is scarce, and although they are recorded since the Miocene, little is known of the evolution of these animals (see Gaudin & Branham Reference Gaudin and Branham1998; McDonald et al. Reference McDonald, Vizcaíno, Bargo, Vizcaíno and Loughry2008). Sloths are represented nowadays by two diphyletic genera: the two-toed sloth Choloepus (Megalonychidae) and the three-toed sloth Bradypus (monogeneric family Bradypodidae). They are nearly exclusively arboreal and folivorous mammals living in the dense tropical rainforests of Central and South America (Reid Reference Reid1997; Chiarello Reference Chiarello, Vizcaíno and Loughry2008), and range from about 4 kg to 6 kg in body mass (Nowak Reference Nowak1999), which represents a remarkable instance of convergent evolution (Patterson & Pascual Reference Patterson and Pascual1968; Webb Reference Webb and Montgomery1985; Gaudin Reference Gaudin2004; Nyakatura et al. Reference Nyakatura, Petrovitch and Fischer2010). However, in the past, sloths constituted a rich and diverse clade known since the early Oligocene (Gaudin & McDonald Reference Gaudin, McDonald, Vizcaíno and Loughry2008; McDonald & De Iuliis Reference McDonald, De Iuliis, Vizcaíno and Loughry2008; Pujos et al. Reference Pujos, Gaudin, De Iuliis and Cartelle2012). Some 90 genera (Pujos et al. Reference Pujos, Gaudin, De Iuliis and Cartelle2012) have been named and are distributed amongst three extinct clades, Mylodontidae, Nothrotheriidae and Megatheriidae, as well as to Megalonychidae (which includes extinct taxa along with the extant genus Choloepus; Gaudin Reference Gaudin2004). The clade including Bradypus, according to the phylogenetic hypotheses of Gaudin (Reference Gaudin2004) and Pujos et al. (Reference Pujos, De Iuliis, Argot and Werdelin2007) (see also McDonald & De Iuliis Reference McDonald, De Iuliis, Vizcaíno and Loughry2008), is currently only represented by the three-toed sloth, since no known or putative fossil bradypodids have been recorded. The diversity of fossil sloths encompassed arboreal, terrestrial, fossorial and aquatic or semiaquatic forms (McDonald & De Iuliis Reference McDonald, De Iuliis, Vizcaíno and Loughry2008, Pujos et al. Reference Pujos, Gaudin, De Iuliis and Cartelle2012; Amson et al. Reference Amson, de Muizon, Laurin, Argot and de Buffrénil2014, Reference Amson, Argot, McDonald and de Muizon2015), with body masses ranging from dozens of kilograms to several tons (White Reference White1993, Reference White, Kay, Madden, Cifelli and Flynn1997; Fariña et al. Reference Fariña, Vizcaíno and Bargo1998; Bargo et al. Reference Bargo, Vizcaíno, Archuby and Blanco2000; De Esteban-Trivigno et al. Reference De Esteban-Trivigno, Mendoza and De Renzi2008; Toledo et al. Reference Toledo, Cassini, Vizcaíno and Bargo2014) (Fig. 1). Sloths were geographically widespread, their collective range extending from southernmost Chile, Argentine Patagonia, and possibly Antarctica (Vizcaíno & Scillato-Yané Reference Vizcaíno and Scillato-Yané1995, but see MacPhee & Reguero Reference MacPhee and Reguero2010), in the south to the US State of Alaska in the north (McDonald & De Iuliis Reference McDonald, De Iuliis, Vizcaíno and Loughry2008). Fossil sloth remains have been largely recovered from early-middle Miocene, Pliocene and late Pleistocene strata (Fig. 1), with less abundant records from the Oligocene (McDonald & De Iuliis Reference McDonald, De Iuliis, Vizcaíno and Loughry2008; Bargo et al. Reference Bargo, Toledo, Vizcaíno, Vizcaíno, Kay and Bargo2012; Pujos et al. Reference Pujos, De Iuliis and Cartelle2016). During the megafaunal extinction of the terminal Pleistocene, practically all sloths (commonly referred to as ground sloths, although this term does not reflect the diversity of locomotor modes among extinct sloths) became extinct, with only the lineages leading to the modern tree sloths surviving.
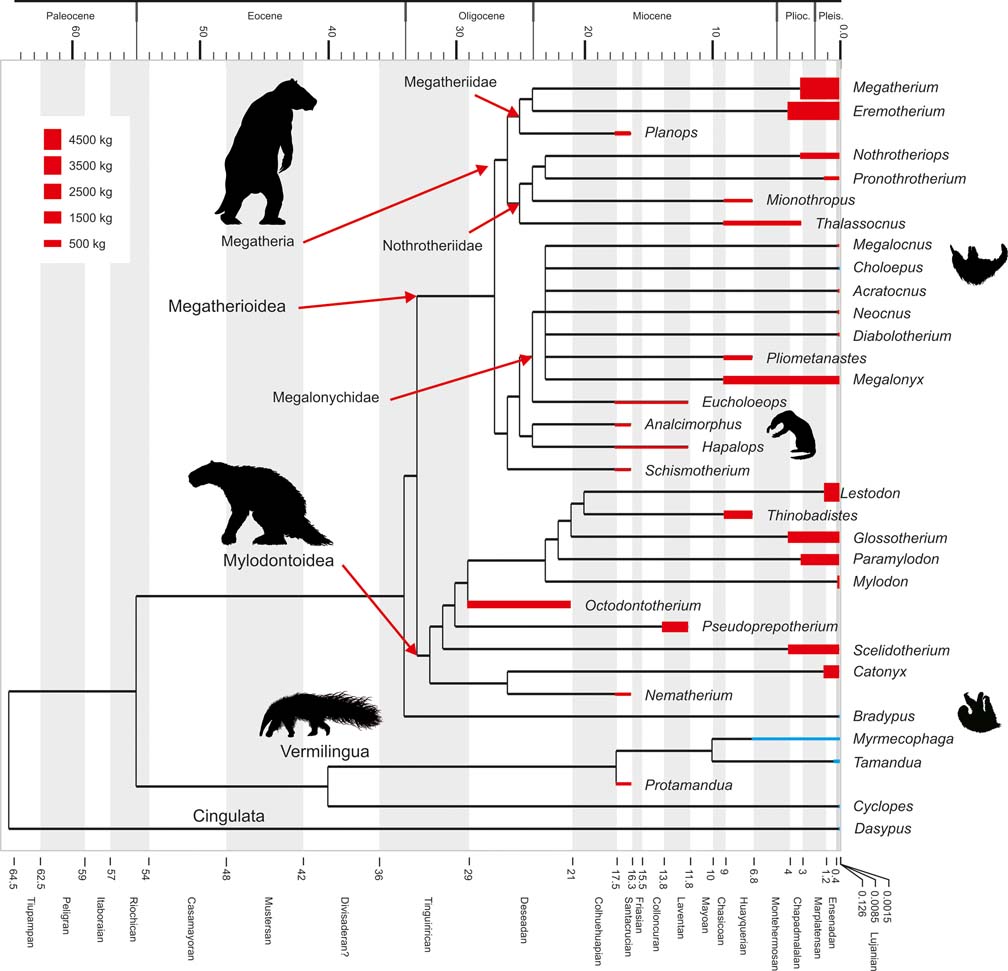
Fig. 1 Cladogram depicting phylogenetic relationships within Pilosa, based on Pujos et al. (Reference Pujos, Gaudin, De Iuliis and Cartelle2012). Geological ages are represented on the horizontal axis and taxon bar length indicates stratigraphic range; based on McDonald & De Iuliis (Reference McDonald, De Iuliis, Vizcaíno and Loughry2008). Height of taxon bars is proportional to body size in kg. Extant taxa depicted in blue; extinct ones in red. Clade names based on Gaudin (Reference Gaudin2004).
In this contribution, the correlation between body mass and phylogenetic structure is analysed and discussed. In addition to this, the relationships between body size and other biological traits, such as metabolism, diet and substrate preference, are considered, with the aim of formulating hypotheses on body size evolution within Pilosa.
1. Methods
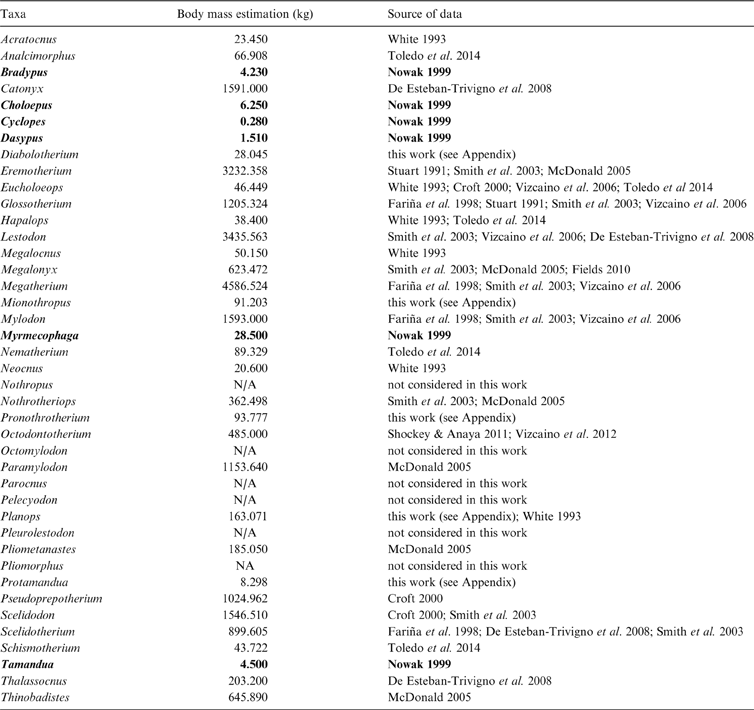
The main study subject is the phylogenetic tree proposed by Pujos et al. (Reference Pujos, Gaudin, De Iuliis and Cartelle2012), complemented by those of Pujos et al. (Reference Pujos, De Iuliis, Argot and Werdelin2007) and Gaudin (Reference Gaudin2004). While the current report was in review, Amson et al. (Reference Amson, Muizon and Gaudin2016) provided a new phylogenetic hypothesis, in which thalassocnines were removed from Nothrotheriinae and presented as closely related to Megatheriinae. The effects of this hypothesis are not considered here. Body mass estimates were recovered from the literature, except as noted below. Means were calculated from estimations in the literature for each genus. Genera for which estimates could not be obtained were not considered in the analyses (Table 1). In some genera for which body size estimations are not published, but postcranial measurements are available (Mionothropus, Diabolotherium, Pronothrotherium, Planops and Protamandua), published allometric predictive equations or ad hoc regressions were performed to obtain body size estimations (see Appendix).
Table 1 Body mass estimations of taxa considered in the three cladograms analysed, with respective sources of data. Extant taxa in bold type.
The outgroup in all the cladograms used for the analyses is the armadillo Dasypus hybridus (Cingulata, Dasypodidae), following Pujos et al. (Reference Pujos, De Iuliis, Argot and Werdelin2007). For analytical purposes, vermilinguan relationships from Gaudin (Reference Gaudin2004) were included in the cladogram of Pujos et al. (Reference Pujos, Gaudin, De Iuliis and Cartelle2012). For simplicity, the cladograms are referred to as A for Gaudin (Reference Gaudin2004), B for Pujos et al. (Reference Pujos, De Iuliis, Argot and Werdelin2007), and C for Pujos et al. (Reference Pujos, Gaudin, De Iuliis and Cartelle2012), as in Figures 2, 3 and 4.
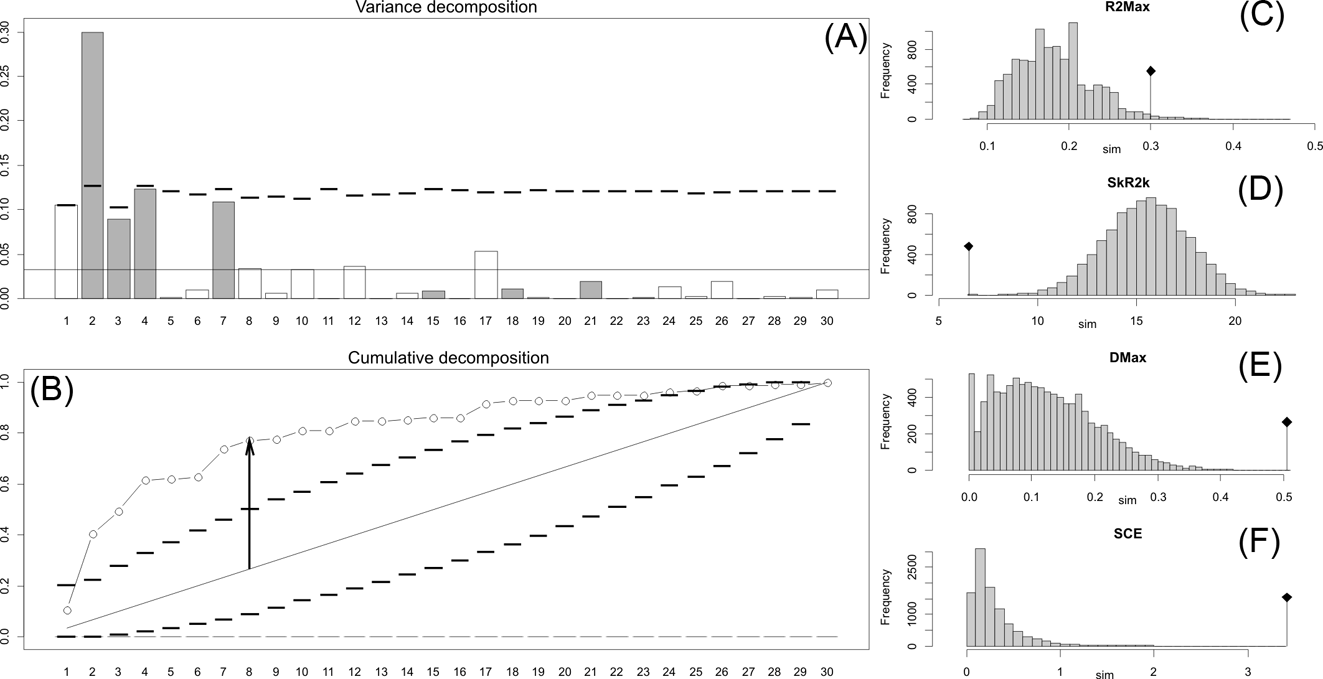
Fig. 2 Orthonormal decomposition results for Cladogram A. (A) Orthogram plot: height of bars is proportional to the squared coefficients (white and grey bars represents positive and negative coefficients); dashed line is the upper confidence limit at 5 %, built from Monte Carlo permutations; horizontal solid line is the mean value; (B) Cumulative orthogram plot: circles represent observed values of cumulated squared coefficients (vertical axis); the expected values under H0 are disposed on the straight line; dashed lines represent the bilateral confidence interval; (C–F) Histograms of observed values of the four statistic tests: black dot depicts the observed parameter value.
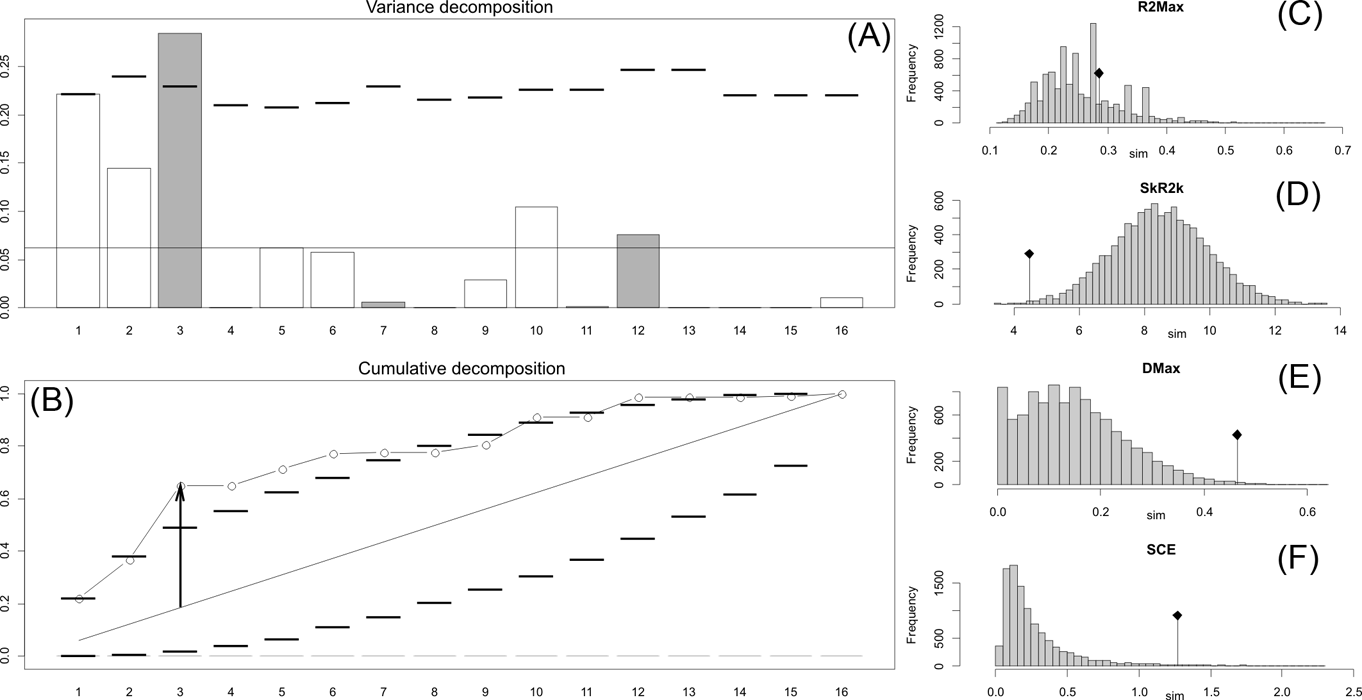
Fig. 3 Orthonormal decomposition results for Cladogram B. See Figure 2 for explanation.
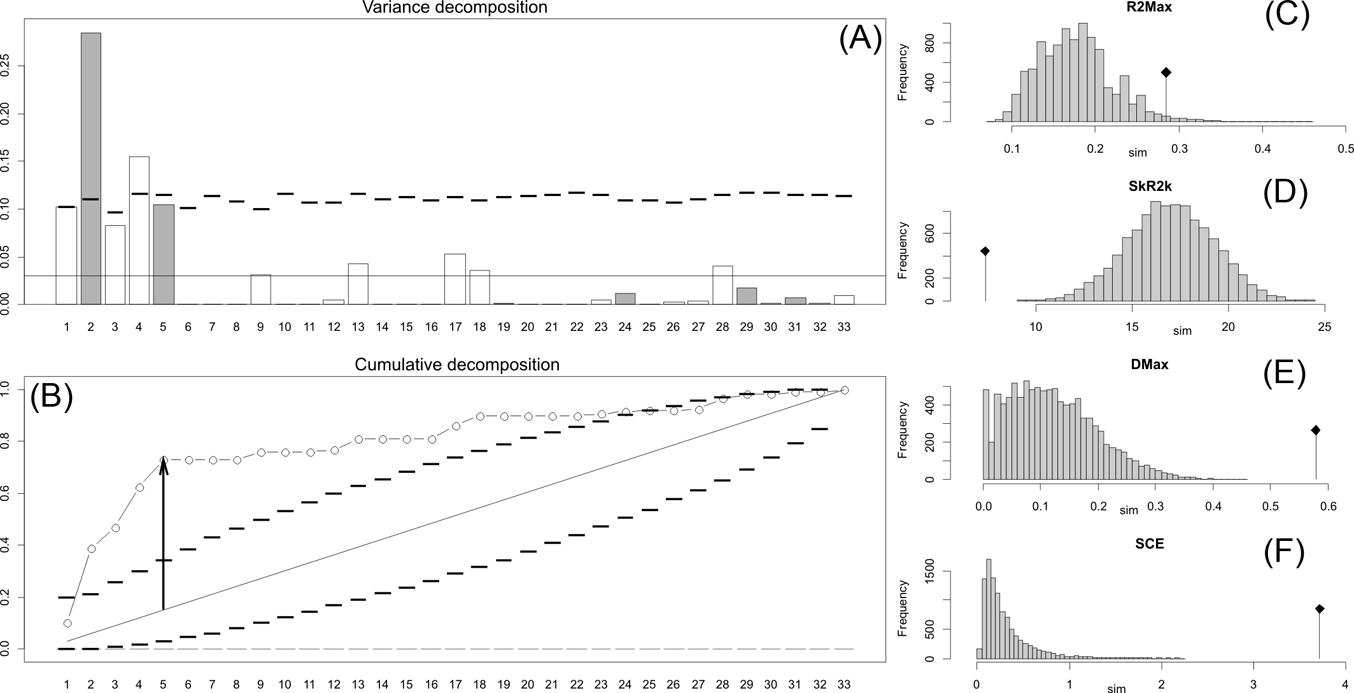
Fig. 4 Orthonormal decomposition results for Cladogram C. See Figure 2 for explanation.
Most statistical algorithms (for example, phylogenetically independent contrasts (PIC), phylogenetic autoregression (PA) and generalised estimating equation (GEE); see Paradis Reference Paradis2006) for analysing the correlation between the phylogenetic pattern and a given continuous or discrete trait require a priori data for branch lengths and evolutionary models. For extant taxa, branch lengths are determined using molecular information for modelling diversification times. For fossil taxa, however, branch lengths must be reconstructed from first and last appearance dates and then diversification times estimated by modelling evolutionary processes and rates. Nevertheless, estimation of diversification times by modelling algorithms based on the fossil record carries the burden of multiple statistical and evolutionary assumptions (see Münkemüller et al. Reference Münkemüller, Lavergne, Bzeznik, Dray, Jombart, Schiffers and Thuiller2012 for a review of methods).
Therefore, in contrast to Raj Pant et al. (Reference Raj Pant, Goswami and Finarelli2014), methods that require estimates of diversification times are not used in the present study. Instead, methods are employed that analyse only the topology of the cladogram, such as the orthonormal decomposition (OD) method proposed by Ollier et al. (Reference Ollier, Couteron and Chessell2006) and the Abouheif C-mean test (Abouheif Reference Abouheif1999; Pavoine et al. Reference Pavoine, Ollier, Pontier and Chessel2008; see also Münkemüller et al. Reference Münkemüller, Lavergne, Bzeznik, Dray, Jombart, Schiffers and Thuiller2012), described below.
1.1 Orthonormal decomposition of variance
This method, proposed and developed by Ollier et al. (Reference Ollier, Couteron and Chessell2006), performs an orthonormal transformation on a matrix obtained from the tree's topology, to construct a new mathematical structure function called an orthogram (see also Paradis Reference Paradis2006; Münkemüller et al. Reference Münkemüller, Lavergne, Bzeznik, Dray, Jombart, Schiffers and Thuiller2012) by computing vectors (orthobases) that describe the tree's topology without relying on estimated branch lengths and diversification times. The correlation between the variance of the trait and this suite of orthobases (after a number of Monte Carlo permutations of the trait values of tips), and therefore the proportion of the variance of the trait explained by the topology of the tree (Paradis Reference Paradis2006), is tested by four statistics with a confidence limit of 0.05 and absence of correlation (observed tip values are exchangeable) considered as the null hypothesis (see Ollier et al. Reference Ollier, Couteron and Chessell2006). These statistics are the following: R2Max (maximal R2), the values of which peak when a significant share in variance dependence occurs at a single node (otherwise variance dependence is distributed along several nodes); Dmax (maximal deviation), which corresponds to the Kolmogorov-Smirnov statistic and tests whether the studied variable may be part of a random sample from a uniform distribution; SkR2k (sum of k-nth R2), which describes whether the variance distribution is skewed toward the tree's tips or root; and SCE (sum of cumulative errors), which describes the averaged variation in the values calculated for the orthogram. Orthonormal decomposition was computed for the three cladograms studied using the R package ade4 (Dray & Dufour Reference Dray and Dufour2007).
Abouheif C-mean
Based on the Moran I index, this statistic computes the correlation between the variable under study and a matrix of phylogenetic proximity among taxa (branch tips), following the method by Abouheif (Reference Abouheif1999). The absence of phylogenetic correlation is considered the null hypothesis. The observed and expected values of the C-mean, its standard deviation and p-values were computed for cladograms A, B, and C using the R package adephylo (Dray & Jombart Reference Dray and Jombart2008). If observed C-mean is greater than expected (greater than 0), positive autocorrelation is detected, whereas a negative autocorrelation is indicated by a lower-than-expected C-mean.
2. Results
2.1. Orthonormal decomposition
The results obtained are consistent overall, despite some differences in details (Figs 2, 3, 4). R2max is significantly different from the predicted for the null hypothesis for cladograms A and C, indicating that a greater share of variance of log-body mass dependence is concentrated in a few nodes (Figs 2, 3, 4). On the other hand, it was not significantly different from the predicted for cladogram B, indicating that there is no single node where the variance of log-transformed body mass is concentrated; rather, the variance dependence is spread across the tree. The other three statistics are significantly different from those predicted (Table 2), indicating that the variance of the trait is not part of a uniform distribution and is not concentrated at the root. According to the cumulative decomposition plots, in all cases, several nodes show values extending beyond the confidence limits built by the Monte Carlo permutations (especially for A and C trees – see Figures 5, 6 and 7). Ollier et al. (Reference Ollier, Couteron and Chessell2006) named this pattern diffuse phylogenetic dependence.
Table 2 Orthogram decomposition results for each of the three cladograms analysed, based on 10,000 Monte Carlo permutations. Observed values, standard deviation (St. Dev), type of alternative hypothesis test and p-values provided for each statistic.
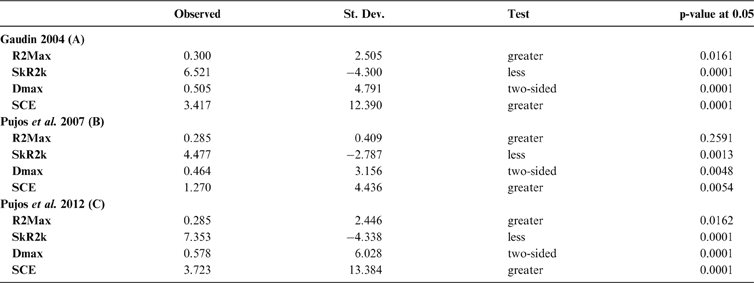
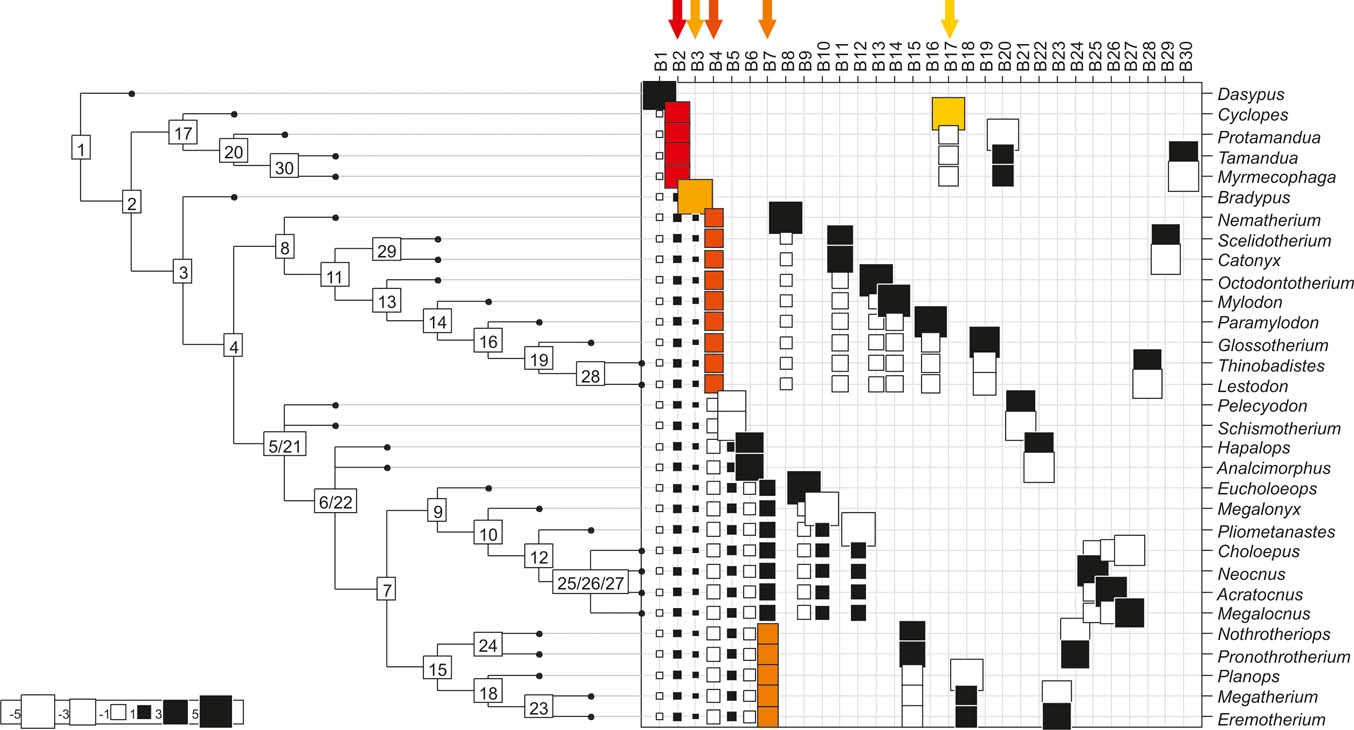
Fig. 5 Cladogram A (Gaudin Reference Gaudin2004), as analysed in the orthonormal decomposition test, showing the observed matrix of orthonormal vectors (orthobases) ordered from left to right by decreasing value of explained tree complexity. Labels in the tree indicate vectors describing variance dependence of node's descendants; size of squares represents the value of orthonormality (against which the variance is decomposed; observed variance from values predicted by null model is showed in ). The first ten most significant vectors are shaded in red (decreasing from bright red to yellow).
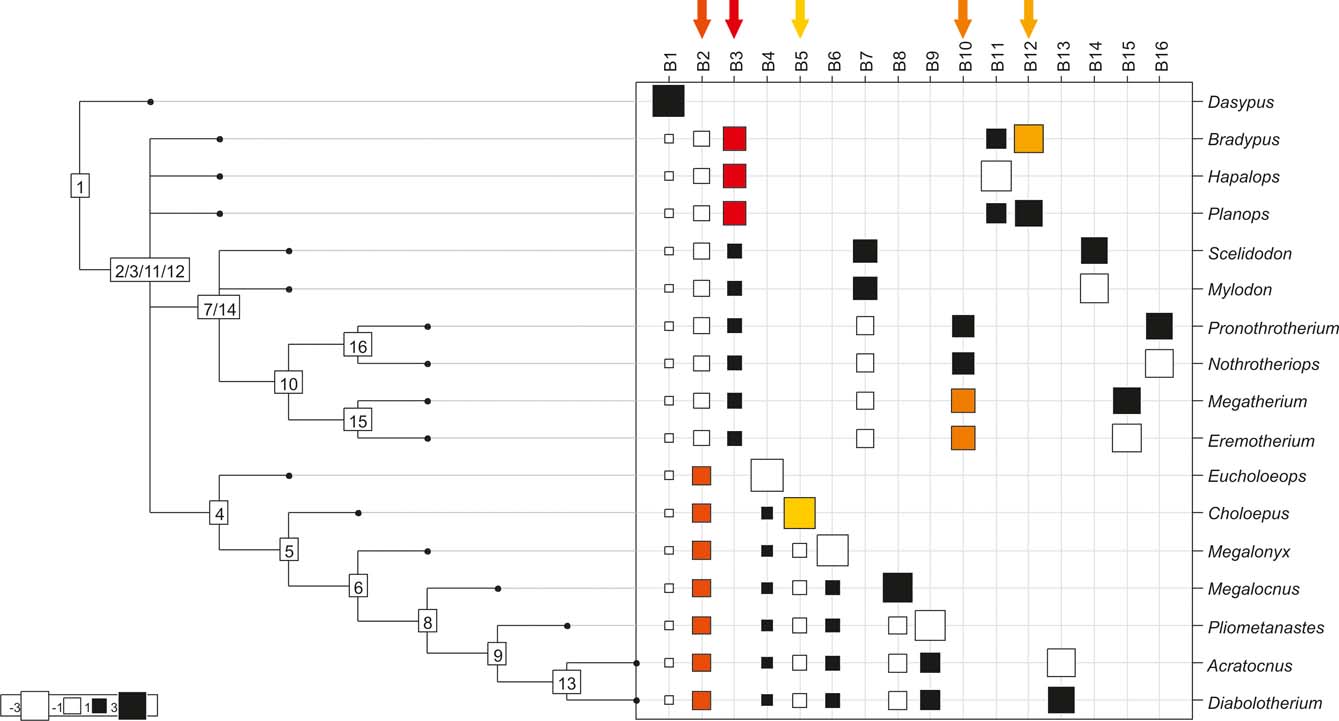
Fig. 6 Cladogram B (Pujos et al. Reference Pujos, De Iuliis, Argot and Werdelin2007), as analysed in the orthonormal decomposition test. The first ten most significant vectors are shaded in red (see Figure 5 for explanation; and ).
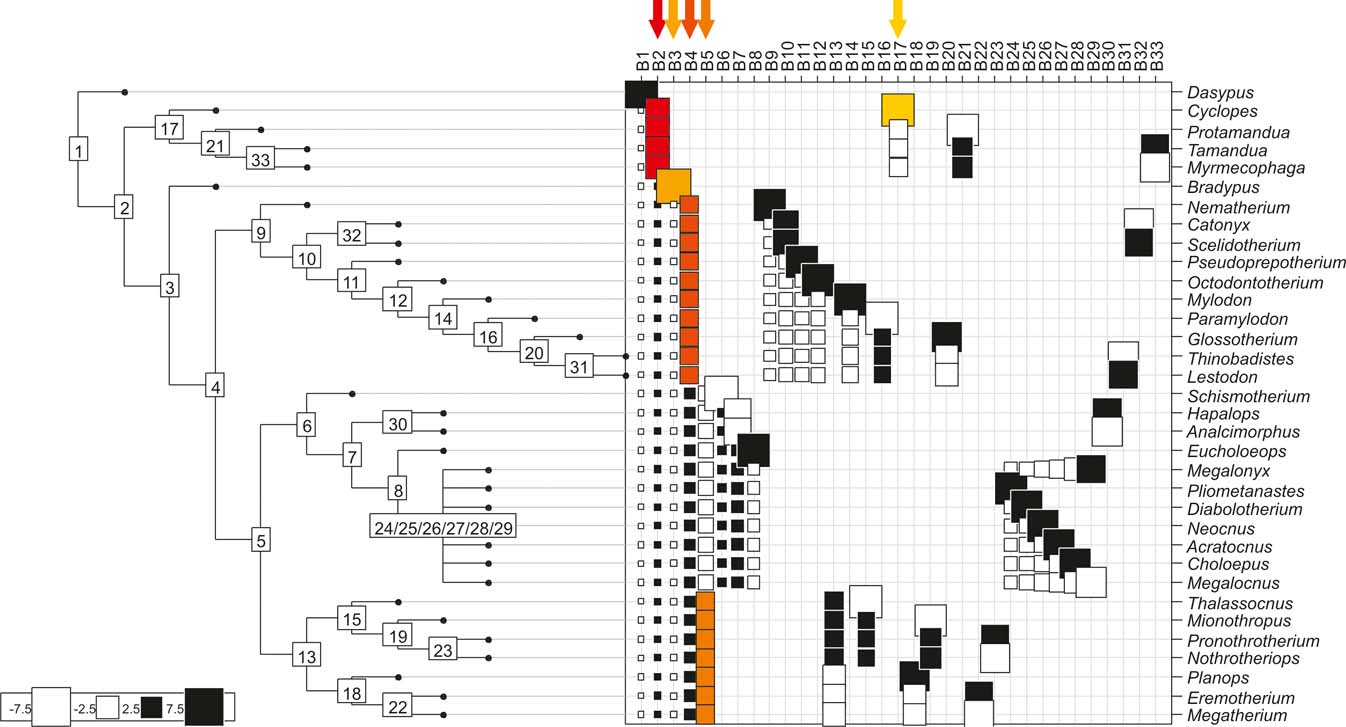
Fig. 7 Cladogram C (Pujos et al. Reference Pujos, Gaudin, De Iuliis and Cartelle2012), as analysed in the orthonormal decomposition test. The first ten most significant vectors are shaded in red (see Figure 5 for explanation; and ).
With few exceptions, nodes concentrating greater share of the body mass variance dependence vary among the cladograms analysed (compare Figs 5–7), demonstrating that differences among phylogenetic hypotheses are a factor in orthonormal decomposition results. However, some overall patterns are apparent. In cladograms A and C, higher trait variance dependence was detected at the basal nodes, whilst in cladogram B, some crown nodes are also important (see its R2Max coefficient). In both A and C cladograms, the clades that concentrated a greater phylogenetic dependence are Vermilingua (cladogram B does not include anteaters), Mylodontoidea (cladogram B does not recover mylodonts as a natural group) and Megatheria (Megatheriidae+Nothrotheriidae sensu Gaudin Reference Gaudin2004). In cladogram B, along with Megatheriidae, Megalonychidae is detected as one of the clades with higher phylogenetic dependence. Some trees' tips are also detected, highlighting taxa where body size is significantly lesser or greater than expected from the null model (Cyclopes and Bradypus; but also some megalonychids such as Choloepus, Megalonyx, Pliometanastes and Megalocnus). In summary, the body mass–phylogeny relationship is strongest in Vermilingua (cladograms A and C; i.e., this group shows the greatest phylogenetic dependence), followed by Mylodontoidea (cladograms A and C), then Megatheria sensu Gaudin (Reference Gaudin2004: Nothrotheriidae and Megatheriidae) in cladograms A and C, Megatheriidae in cladogram B and, finally, Megalonychidae in cladograms A, B and C.
2.2. Abouheif C-mean
The observed position of the C-mean statistic is significantly different from the expected sampling distribution of the null hypothesis developed by randomisation of the tips at a 0.05 alpha (Table 3; Fig. 8). A statistically significant autocorrelation is therefore detected for all the trees, suggesting that phylogeny is a significant factor for body mass. In other words, closely related taxa are more similar in body mass than expected by the null model.
Table 3 Abouheif C-mean results for each of the three cladograms analysed, based on 10,000 randomisations. Observed values, standard deviation (St. Dev), type of alternative hypothesis test and p-values provided for the statistic.
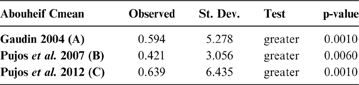
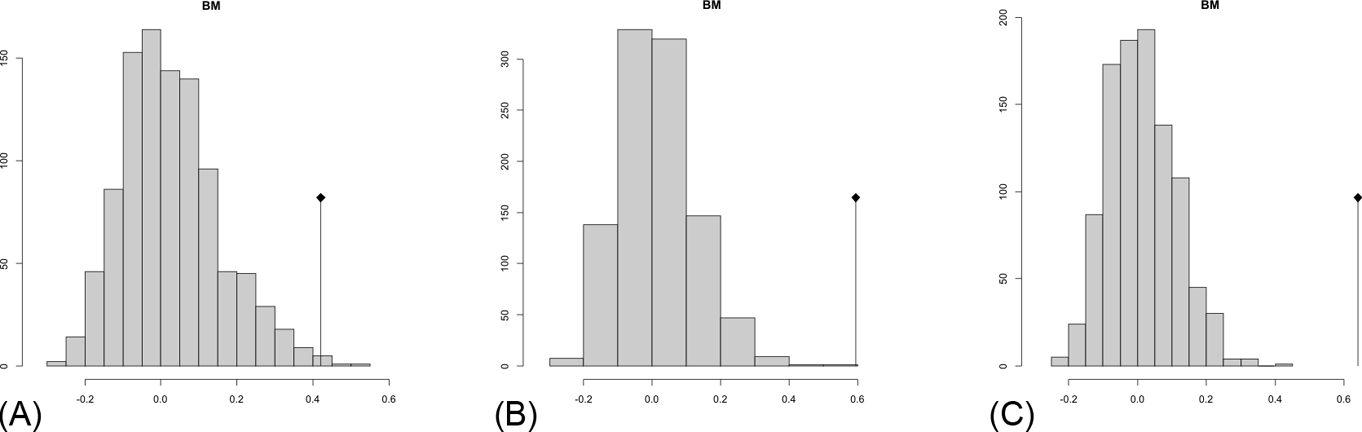
Fig. 8 Abouheif C-mean results from the three cladograms. Black dots indicate the position of the observed C-mean statistic relative to the H0 hypothesis by randomisations along the tips of the phylogeny. The frequency distribution (vertical axis) represents the mean C-statistics (horizontal axis) calculated from the body mass data (tips).
3. Discussion
The results indicate a significant correlation between body size and phylogeny in all the cladograms considered, which is consistent with previous proposals (Vizcaíno et al. Reference Vizcaíno, Cassini, Toledo, Bargo, Patterson and Costa2012; Raj Pant et al. Reference Raj Pant, Goswami and Finarelli2014). Former attempts to investigate the evolution of body size in sloths and anteaters have been approached in a qualitative manner by McNab (Reference McNab and Montgomery1985), who proposed that xenarthran evolutionary patterns link body size to a low rate of metabolism and poor temperature regulation. One consequence of the reduced present diversity of sloths is that they are not fully reliable biological models for actualistic reconstruction of extinct sloth biology (Vizcaíno et al. Reference Vizcaíno, Bargo, Fariña, Vizcaíno and Loughry2008).
The application of quantitative methods to the investigation of body size evolution in xenarthrans is relatively recent. Vizcaíno et al. (Reference Vizcaíno, Cassini, Toledo, Bargo, Patterson and Costa2012) addressed the evolution of body size in sloths, within a wider analysis of the evolution of large body size in South American herbivores. These authors noted a clear trend, manifested mainly by mylodontoids, megatheriids and nothrotheriids, of increasing body size, approaching gigantism, from the Miocene/Pliocene to the Pleistocene, a proposal that is supported by the analyses and results of the current work.
As mentioned above, Raj Pant et al. (Reference Raj Pant, Goswami and Finarelli2014) analysed the evolution of body size in sloths, using Akaike information criterion for testing phylogenetical models based on Brownian motion, evolutionary stasis, driven-active trend and trended-random walks. These authors reconstructed diversification times and evolutionary rates and concluded that body size evolution in sloths was complex, but dominated by a trend toward giant size. Trended-walk evolutionary models were reconstructed for Mylodontidae and Megatheriidae + Nothrotheriidae, and a stasis model for Megalonychidae was obtained in one of their simulations. Their results are also consistent with those from the present contribution. However, the accuracy of estimating diversification times from the fossil record, for which actual branch lengths are unavailable, has been questioned (see Abouheif Reference Abouheif1999; Ollier et al. Reference Ollier, Couteron and Chessell2006). Thus, methodologies that rely exclusively on the topological structure of a phylogenetic tree (i.e., are independent of inferred branch lengths and/or evolutionary models) would seem to provide a more robust analysis of the evolution of a biological trait. In addition, such methodologies provide a test for those employing branch length estimates and evolutionary models.
Different phylogenetic hypotheses can lead to different results in the application of autocorrelation or phylogenetic dependence. Whilst a truism, this is not a minor issue and must be taken into account carefully when applying statistical techniques that analyse relationships of biological traits and phylogenies. However, results obtained here are similar in overall pattern and resemble those of previous studies. The methods applied here, especially orthonormal decomposition, seem to be efficient in detecting phylogenetic autocorrelation and providing heuristic and valuable information, without the need for branch length estimations and a priori evolutionary assumptions on diversification times.
Effectively, the results presented here indicate that as a group, anteaters display the greatest correlation between body size variance and the topology of the tree (and, hence, between size variation and phylogenetic relationships). This suggests that body size diversity in anteaters has been strongly influenced by their phylogenetic history. Based on the same results, similar hypotheses can also be proposed for major clades amongst sloths.
The following sections will discuss the relationship between the evolution of body size, as reconstructed from our results and from previous works, and biological variables, with the aim of proposing hypotheses regarding evolutionary patterns in anteaters and sloths.
One of the most meaningful biological variables related to body size is basal metabolic rate (BMR). Following the seminal work of McNab (Reference McNab and Montgomery1985), extant xenarthrans are characterised by low body temperatures, and low BMRs are also expected following Kleiber's (Reference Kleiber1932) model for placental mammals. McNab (Reference McNab and Montgomery1985) argued that xenarthran evolution shows a pattern related to low BMR (linked also to poor temperature regulation and low reproductive potential), so here, low BMR may be proposed as a primary factor shaping body size evolution.
3.1. Anteaters: BMR, dietary specialisations and substrate preferences
Of interest is the relative importance of the phylogenetic signal detected for anteaters, despite their limited extant and fossil diversity. Anteaters show a relatively wide disparity in body size, but no vermilinguan reached the large (hundreds of kilograms) and gigantic (tons) body sizes attained by extinct sloths. The results obtained here (a significant relationship between body mass variation and phylogeny) may be reformulated as the working hypothesis that the evolution of body size in anteaters is constrained by their phylogeny. It is necessary to consider which aspects of the evolving biology of anteaters may have constrained the evolution of their body size. Extant anteaters are specialised myrmecophagous mammals (see Naples Reference Naples1999) and this dietary habit has also been inferred for their fossil relatives (McDonald et al. Reference McDonald, Vizcaíno, Bargo, Vizcaíno and Loughry2008), based on their conservative morphology. Myrmecophagy imposes harsh restrictions on several biological traits, including body size. Numerous aspects of preying on social insects (e.g., their defensive strategies and low nutritional value, low predator/prey size ratio; see Reiss Reference Reiss and Schwenk2000) are key in understanding the evolution of vermilinguan body size. Low nutritional value (social insects have almost no fat, except for larvae and winged reproductive females) and small prey size force anteaters to increase prey intake rates (Naples Reference Naples1999) in order to meet their nutritional requirements. This is compensated for partly by their low BMR, which also occurs in other mammals that feed on ants and termites, such as the aardvark Orycteropus and the pangolins Manis, Phataginus and Smutsia (McNab Reference McNab1984, Reference McNab and Montgomery1985; Reiss Reference Reiss and Schwenk2000). Moreover, detoxification rates for social insect defence chemicals may be enhanced by a lower BMR (McNab Reference McNab and Montgomery1985). Nevertheless, anteaters diminish the pressures imposed by high rates of prey consumption and insect defensive strategies by not concentrating their efforts on a single nest, but rather by conducting only brief feeding bouts at any given nest (Reiss Reference Reiss and Schwenk2000; Rodrigues et al. Reference Rodrigues, Medri, de Miranda, Camilo-Alves, Mourao, Vizcaíno and Loughry2008). Thus, feeding requires a great investment of energy for moving and gathering prey over a large foraging area (Montgomery Reference Montgomery and Montgomery1985). As body size increases, the required foraging area increases exponentially, a potential factor in constraining body size evolution in anteaters. Additionally, the pantropical distribution of social insects such as termites that form large colonies could have constrained the geographical distribution of anteaters to warm or warm-temperate areas (McNab Reference McNab and Montgomery1985; Reiss Reference Reiss and Schwenk2000). In this regard, the presence of Protamandua in Miocene deposits of Patagonia has been considered as indicative of subtropical and warm-temperate environments for the Santa Cruz Formation (Kay et al. Reference Kay, Vizcaíno, Bargo, Vizcaíno, Kay and Bargo2012).
Substrate preference and locomotor habits have also varied during the evolution of the group. Cyclopes is fully arboreal, Tamandua is semiarboreal and Protamandua is inferred as having arboreal habits (Hirschfeld Reference Hirschfeld1976; Gaudin & Branham Reference Gaudin and Branham1998; Bargo et al. Reference Bargo, Toledo, Vizcaíno, Vizcaíno, Kay and Bargo2012); whereas Myrmecophaga is ground-dwelling. Arboreal habits, or at least climbing locomotor adaptations, have been suggested as the primitive condition for anteaters (Gaudin & Branham Reference Gaudin and Branham1998; Gaudin & Croft Reference Gaudin and Croft2015), so Myrmecophaga may be considered as derived with regard to substrate preference (see Young et al. Reference Young, Coelho and Wieloch2003 for an account of occasional climbing habits of giant anteaters), whilst Cyclopes could be proposed as showing extreme adaptations from a long phylogenetic history of arboreality. Because large body size is a major impediment to arboreality (Cartmill Reference Cartmill, Hildebrand, Bramble, Liem and Wake1985), it is not surprising that the fully terrestrial Myrmecophaga is the largest anteater, the semiarboreal Tamandua is mid-sized, whilst the fully arboreal Cyclopes is the smallest one. The evolution of the giant anteater has been apparently closely related to the colonisation of open habitats by termites since the Miocene (McDonald et al. Reference McDonald, Vizcaíno, Bargo, Vizcaíno and Loughry2008).
3.2. Sloths
Mylodontoids and megatheriid + nothrotheriid sloths experienced convergent increases in body mass since the Miocene, reaching gigantic sizes during the Pleistocene (Figs 2, 3, 4). Vizcaíno et al. (Reference Vizcaíno, Cassini, Toledo, Bargo, Patterson and Costa2012) described the tendency for increasing maximum body size through evolution as a common feature in Cenozoic South American mammalian herbivore lineages. This is especially true for xenarthrans, mainly sloths and glyptodonts, which reached a climax during the Pleistocene, with a diversity of forms having masses of several tons.
Proposing explanatory hypotheses for sloth body size evolution is not as straightforward as for anteaters. In sharp contrast with extant sloths, extinct sloths were quite diverse in body size and morphology, as well as in dietary habits, substrate preference and locomotor modes (see McDonald & De Iuliis Reference McDonald, De Iuliis, Vizcaíno and Loughry2008 for a synopsis). However, the same working hypothesis as for anteaters may be proposed: the evolution of body size in sloths (mainly mylodontoids, megatheriids and nothrotheriids) is constrained by their phylogenetic history, and the evolutionary panorama of sloth body size may also be analyzed with respect to the relationships among BMR, diet, and substrate preference.
A preliminary review of the evolutionary changes in substrate preference and diet was performed by Pujos et al. (Reference Pujos, Gaudin, De Iuliis and Cartelle2012), and later expanded by Gaudin & Croft (Reference Gaudin and Croft2015). Pujos et al. (Reference Pujos, Gaudin, De Iuliis and Cartelle2012) reviewed published data and concluded that among pre-Miocene sloths, only the skeletal remains of the Deseadan (late Oligocene) Octodontotherium are known well enough to permit the proposal of palaeobiological hypotheses. Most of the available palaeobiological information is, therefore, restricted to Miocene and Pleistocene sloths. It is worth reiterating that, in contrast to anteaters, extant sloths are not suitable models for understanding fossil sloth biology and evolution; or, at least, that inferences based on the extant forms must be made with considerable caution.
3.2.1. Substrate preference
McNab (Reference McNab and Montgomery1985) related the low BMR of extant sloths to their relatively low percentage of skeletal musculature. Grand (Reference Grand and Montgomery1978) analysed the mechanical advantages of the suspensory mode of life of extant sloths in relation to optimisation of muscle needed for ensuring stability and movement. This optimisation, resulting in a reduction of muscular mass in modern sloths, would not apply to most fossil sloths, as they were almost certainly more muscular (Bargo et al. Reference Bargo, Vizcaíno, Archuby and Blanco2000; Vizcaíno et al. Reference Vizcaíno, Bargo and Cassini2006; Toledo et al. Reference Toledo, Bargo and Vizcaíno2013, Reference Toledo, Bargo and Vizcaíno2015).
Pujos et al. (Reference Pujos, Gaudin, De Iuliis and Cartelle2012) optimised substrate preference categories of sloths in their cladogram, which supported previous proposals that the suspensory habits of extant sloths are convergent (Patterson & Pascual Reference Patterson and Pascual1968; Webb Reference Webb and Montgomery1985; Gaudin Reference Gaudin2004; McDonald & De Iuliis Reference McDonald, De Iuliis, Vizcaíno and Loughry2008; Nyakatura et al. Reference Nyakatura, Petrovitch and Fischer2010). These authors considered a terrestrial habit basal for all sloths, and reconstructed a basal semiarboreal substrate preference for megalonychids, megatheriids and nothrotheriids, as proposed previously by Webb (Reference Webb and Montgomery1985). Mylodontoids, a clade that shows a clear trend towards the evolution of giant body size, retained their ancestral terrestrial habit. In accordance with McNab (Reference McNab and Montgomery1985), and based on the well-developed digging abilities and potential fossorial habits of the mylodontids Scelidotherium and Glossotherium (see Bargo et al. Reference Bargo, Vizcaíno, Archuby and Blanco2000; Vizcaíno et al. Reference Vizcaíno, Zárate, Bargo and Dondas2001), Vizcaíno et al. (Reference Vizcaíno, Bargo and Cassini2006) proposed that these ground sloths could have had a lower BMR than expected from their body size and dietary habits. Fossorial habits (including both the digging of a shelter and occupation of an existing cave or burrow) implies living in an environment with a more constant and perhaps elevated temperature, thus saving thermoregulatory energy costs by reducing BMR and reducing the heat storage when the animals were moving or resting inside the burrow (McNab Reference McNab and Montgomery1985; T. J. Gaudin pers. comm. 2016). Following Pujos et al. (Reference Pujos, Gaudin, De Iuliis and Cartelle2012), digging abilities might be a basal feature for mylodontids, and possibly of even more basal mylodontoids such as the Miocene Nematherium (see Bargo et al. Reference Bargo, Toledo, Vizcaíno, Vizcaíno, Kay and Bargo2012; Toledo et al. Reference Toledo, Bargo and Vizcaíno2013).
Basal megatherioids analysed here (Hapalops, Schismotherium and Analcimorphus) were arboreal or semiarboreal. This is also true for early Miocene megalonychids (Eucholoeops), whilst the Miocene megatheriid Prepotherium was essentially terrestrial (White Reference White1993, Reference White, Kay, Madden, Cifelli and Flynn1997; Bargo et al. Reference Bargo, Toledo, Vizcaíno, Vizcaíno, Kay and Bargo2012; Toledo et al. Reference Toledo, Bargo and Vizcaíno2013, Reference Toledo, Bargo and Vizcaíno2015). In this context, it can be argued that one of the consequences of the evolutionary tendency of mylodontoids, nothrotheriids and megatheriids towards large (and gigantic) body sizes from the Oligocene/Miocene to the Pleistocene was the shift from a diversity of substrate preference and locomotor modes, that included arboreal, semiarboreal and terrestrial forms, to almost exclusively terrestrial forms. One of the exceptions to this trend is the large-sized nothrotheriid (but see Amson et al. Reference Amson, Muizon and Gaudin2016) Thalassocnus, for which a semiaquatic habit has been proposed (Muizon & McDonald Reference Muizon and McDonald1995; Muizon et al. Reference Muizon, McDonald, Salas and Urbina2004; Amson et al. Reference Amson, de Muizon, Laurin, Argot and de Buffrénil2014, Reference Amson, Argot, McDonald and de Muizon2015). In this regard, an aquatic lifestyle imposes fewer constraints to large body size as compared to terrestrial and arboreal habits. Among megalonychids, their less marked evolutionary tendency toward large body sizes may have been influenced by the fact that some of them evolved in insular environments (H. G. McDonald pers. comm. 2016; e.g., Pleistocene megalonychids recovered from Cuba, Hispaniola and Puerto Rico islands; see Pujos et al. Reference Pujos, De Iuliis and Cartelle2016), and may have been subjected to selective pressures against larger body size related to their home range extent (see Burness et al. Reference Burness, Diamond and Flannery2001). Other genera evolving in continental environments (e.g., Megalonyx) experienced less geographic constraint on body sizes. Nevertheless, maintenance of a greater diversity of body sizes and substrate uses and locomotor habits in megalonychids, including arboreal and terrestrial forms (Pujos et al. Reference Pujos, De Iuliis, Argot and Werdelin2007, Reference Pujos, Gaudin, De Iuliis and Cartelle2012), requires further analysis.
3.2.2. BMR and dietary habits
As stated above, the primary relationship between body size evolution and BMR was proposed by McNab (Reference McNab and Montgomery1985). Extant sloths can regulate their energetic expenditure by varying body temperature, as a consequence of their low BMR (McNab Reference McNab1978). Based on the concept that relatively large body sizes could help to improve temperature regulation of xenarthrans through thermal inertia, McNab (Reference McNab and Montgomery1985) proposed a relationship between the inferred low BMR of extinct sloths (mainly Pleistocene ground sloths) and their large to giant body sizes.
As in most mammals, features of the masticatory apparatus of sloths are related to diet and digestive physiology and, hence, to BMR and body size. All sloths are hypselodont (see Vizcaíno Reference Vizcaíno2009, for a review of xenarthran dental features) and, in general, are reconstructed as herbivorous animals (but see Fariña Reference Fariña1996; Fariña & Blanco Reference Fariña and Blanco1996; Bargo Reference Bargo2001; Vizcaíno Reference Vizcaíno2009). Extant sloths are folivorous (Bradypus) and frugivorous-folivorous (Choloepus) browsers (Chiarello Reference Chiarello, Vizcaíno and Loughry2008). They carry out foregut fermentation in complex chambered stomachs (Montgomery & Sunquist Reference Montgomery, Sunquist, Golley and Medina1975) and food undergoes a long transit time, not only in the stomach but also in the intestines (Gilmore et al. Reference Gilmore, Duarte, Peres da Costa, Vizcaíno and Loughry2008). Pujos et al. (Reference Pujos, Gaudin, De Iuliis and Cartelle2012) optimised reconstructed foraging modes on their cladogram, and proposed an ancestral browsing foraging mode (i.e., selective feeding) as ancestral for the entire clade.
Analyses on available dental area for food processing (see Janis Reference Janis, Damuth and MacFadden1990) have shed light on the relationship between diet and BMR. Vizcaíno et al. (Reference Vizcaíno, Bargo and Cassini2006) showed that the relatively low values of occlusal surface area (OSA) of xenarthrans could be related to their low BMR, implying that their lower energetic requirements suggest a comparatively lower food intake than other mammalian herbivores of similar body mass. This could have facilitated the evolutionary increase of body size in sloths, permitting them to dominate the large herbivore guild during the Pleistocene (see Vizcaíno et al. Reference Vizcaíno, Cassini, Toledo, Bargo, Patterson and Costa2012). Mylodontids have the lowest OSA values. This is possibly related to limited oral food processing, which may have been compensated by an increased digestive efficiency (perhaps involving foregut fermentation; see Vizcaíno et al. Reference Vizcaíno, Bargo and Cassini2006). Based on morpho-functional and biomechanical aspects of dietary apparatus, a similar relationship between limited oral food processing and putative caecal fermentation was proposed by Naples & McAfee (Reference Naples and McAfee2012) for the megatheriid Eremotherium (but modern sloths show only foregut fermentation; see Gilmore et al. Reference Gilmore, Duarte, Peres da Costa, Vizcaíno and Loughry2008). The megatheriid Megatherium, the largest sloth known, had much higher OSA values than mylodontids (Vizcaíno et al. Reference Vizcaíno, Bargo and Cassini2006). This is related to increased oral processing and, perhaps, also feeding on more nutritional food. Fariña (Reference Fariña and Blanco1996) and Fariña & Blanco (Reference Fariña and Blanco1996) suggested that Megatherium could incorporate animal tissues in its diet. Bargo (Reference Bargo2001) proposed that Megatherium was a browser (a selective feeder according to Bargo et al. Reference Bargo, Toledo and Vizcaíno2006) of fruits and other moderate to soft food items, although Green & Kalthoff (Reference Green and Kalthoff2015), using microwear analysis of orthodentine, proposed that it could eat plants with low to moderate intrinsic toughness. Finally, Vizcaíno et al. (Reference Vizcaíno, Bargo and Cassini2006) proposed that a combination of high OSA values and relatively higher nutritional food intake could indicate that Megatherium had a BMR similar to that of other herbivorous placentals of similar body size.
Studies on jaw biomechanics have suggested that megatherioid sloths combined browsing habits with prominent orthal and/or anteromedial masticatory movements (Naples Reference Naples1982; Bargo et al. Reference Bargo, Vizcaíno and Kay2009; Vizcaíno Reference Vizcaíno2009; but see Naples & McAfee Reference Naples and McAfee2014). In nothrotheriids and megatheriids, shearing/cutting orthal movements have been reconstructed (Bargo Reference Bargo2001; Muizon et al. Reference Muizon, McDonald, Salas and Urbina2004; Vizcaíno Reference Vizcaíno2009), suggesting a folivorous diet. Pujos et al. (Reference Pujos, Gaudin, De Iuliis and Cartelle2012) considered a grazing foraging mode (i.e., bulk feeding) as characteristic of mylodontines since the early Miocene (Pseudoprepotherium), whereas more basal mylodontoids and scelidotheriines were considered browsers. Grazers usually feed on vegetation with lower nutritional value (including a high percentage of grasses, for instance) than that eaten by browsers (which ingest mainly dicotyledonous leaves and buds). Analyses of mylodontoids teeth and mandibular morphology indicate that grinding mesiolingual components were the main masticatory movements present in both Miocene and Pleistocene mylodontids (Bargo & Vizcaíno Reference Bargo and Vizcaíno2008; Bargo et al. Reference Bargo, Vizcaíno and Kay2009, Reference Bargo, Toledo, Vizcaíno, Vizcaíno, Kay and Bargo2012), which suggests an habitual processing of fibrous and turgid items such as roughage, roots and tubers.
Summing up, a relationship between low nutritional food, grazing habits and low BMR can be proposed as an influential factor for mylodontoid evolution towards large body sizes. On the contrary, megatherioids appeared to maintain the ancestral sloth browsing foraging mode (Pujos et al. Reference Pujos, Gaudin, De Iuliis and Cartelle2012). Green & Kalthoff (Reference Green and Kalthoff2015) suggest that microwear patterns in fossil sloths are important descriptors of environmental grit amount along with food type.
3.2.3. Body temperature and palaeoenvironment
Lastly, the relationships among body size evolution, body temperature and environment are addressed. Amongst the placental mammals, extant sloths have the poorest ability to regulate body temperature (McNab Reference McNab and Montgomery1985). The two-toed sloth Choloepus has a low BMR and moderate thermal conductance, having a high temperature differential derived from its long hairy coat (McNab Reference McNab and Montgomery1985). Bradypus has a similar low BMR, but has a lower minimal conductance due to its dense coat of guard hairs, which is not present in Choloepus. McNab (Reference McNab and Montgomery1985) proposed that the poor thermal regulation of extant sloths is a consequence of their slow metabolism, which is linked, in turn, to small relative muscle masses (which was related by Grand (Reference Grand and Montgomery1978) to mechanical advantages of suspensory habits), but also to their strictly folivorous dietary habits.
Environments inhabited by extinct sloths in the past showed a wider range of temperatures than the tropical conditions where extant sloths live today. During the Eocene–Oligocene, warm and tropical to subtropical conditions prevailed for most of South America. From the Oligocene to the early Miocene, colder temperatures that resulted in glaciations caused the replacement of tropical and subtropical environments by temperate–cold environments. By the middle Miocene, global warming induced the return of subtropical conditions (Mid Miocene Climatic Optimum; see Zachos et al. Reference Zachos, Pagani, Sloan, Thomas and Billups2001), although xeric palaeofloras also developed in southern South America. From the middle Miocene to the Pliocene, the establishment of the Circumpolar and Humboldt oceanic currents produced an increase in temperate conditions, as well as in aridity. The rise of the Andes further increased arid conditions to the east by the Plio-Pleistocene. Finally, oscillation between glacial and warm periods during the last half of the Pleistocene produced a concomitant retraction of humid, temperate environments and an expansion of drier and cooler conditions (see Hinojosa (Reference Hinojosa2005) for a synopsis of climatic and palaeofloristic changes in South America during the Cenozoic).
Taking into account the fossil record, it appears that most clades of sloths (despite their putative low BMR and poor body temperature regulation) were able to successfully cope with environmental fluctuations until the very end of the Pleistocene. As noted above, extinct sloths (especially giant ground sloths) were considerably more muscular than extant sloths. This feature, combined with a hairy covering and large body mass, may have functioned to produce a higher body temperature and greater thermal inertia due to a smaller ratio of surface to volume, resulting in greater thermal tolerance (McNab Reference McNab and Montgomery1985). Thus, a thick furry body covering and greater body mass may have compensated for low BMR. McNab (Reference McNab and Montgomery1985) suggested that mylodontids may, thus, have had low BMRs, but their thick body covering would have allowed them to withstand the seasonally cold environments developed from the Miocene–Pliocene to the Pleistocene (McNab Reference McNab and Montgomery1985), and permitted Mylodon to extend its range to the southern tip of South America. Fossorial habits were proposed for some genera (see above), which could further facilitate thermal adaptation, according to ideas presented by McNab (Reference McNab and Montgomery1985). In addition, megalonychids, proposed to be cave-dwelling forms (e.g., Megalonyx; see McDonald Reference McDonald, Schubert, Mead and Graham2003) could have benefitted in a similar way. However, a reduction or lack of a hairy covering has been suggested for some giant megatheriids, such as Eremotherium (McNab Reference McNab and Montgomery1985) and Megatherium (Fariña Reference Fariña2002), which may have been related to their greater thermal inertia due to their enormous body size.
Thus, considering their relative success in cold and open environments in the last part of the Cenozoic (see Cione et al. Reference Cione, Tonni and Soibelzon2003), and as Vizcaíno et al. (Reference Vizcaíno, Cassini, Toledo, Bargo, Patterson and Costa2012) remarked, sloths (as well as cingulates) do not appear to have undergone a decrease in diversity during the Plio-Pleistocene, in contrast to other South American mammalian lineages. Indeed, not only did xenarthrans overcome competition with holartic lineages entering South America after the Pliocene, but some groups also successfully expanded into, and became integral parts of, North American habitats (see McDonald 2005; Vizcaíno et al. Reference Vizcaíno, Cassini, Toledo, Bargo, Patterson and Costa2012; Fariña et al. Reference Fariña, Vizcaíno and De Iuliis2013; Cione et al. Reference Cione, Gasparini, Soibelzon, Soibelzon and Tonni2015). Although several clades of mammalian herbivores included members with large body size, the ecological success of xenarthrans (mainly mylodontids, nothrotheriids and megatheriids, amongst sloths) is indicated, since they dominated the megaherbivore guild in South America until the megafaunal extinction of the terminal Pleistocene (Cione et al. Reference Cione, Tonni and Soibelzon2003; Vizcaíno et al. Reference Vizcaíno, Cassini, Toledo, Bargo, Patterson and Costa2012; see Steadman et al. Reference Steadman, Martin, MacPhee, Jull, McDonald, Woods, Iturralde-Vinent and Hodgins2005 for a discussion of factors involved in giant sloth extinctions). Megalonychids, as mentioned above, maintained a greater diversity of body size than mylodontoids, megatheriids or nothrotheriids until the Pleistocene in most of the Americas. In the Caribbean region, megalonychids survived into the Holocene (McDonald & De Iuliis Reference McDonald, De Iuliis, Vizcaíno and Loughry2008), and included several arboreal forms (see White Reference White1993, Reference White, Kay, Madden, Cifelli and Flynn1997). This may indicate that environmental changes toward more open and dry habitats were not as drastic in the Caribbean region as in the continental areas of South and North America, and selective pressure towards increased terrestriality and body size was attenuated for these sloths (see Pujos et al. Reference Pujos, De Iuliis and Cartelle2016 for a discussion about evolution of suspensory habits). However, the paucity of palaeobiological information from this region requires further study in order to gain better insight into this possibility.
4. Concluding remarks
Low BMR (and hence lower energetic requirements than for a placental mammal of similar size) and hypselodonty may have provided sloths with the evolutionary capacity to increase body size, which was key for their ecological success during the Plio-Pleistocene (Vizcaíno et al. Reference Vizcaíno, Cassini, Toledo, Bargo, Patterson and Costa2012). The following remarks can be highlighted:
1. Methods applied in this work, especially orthonormal decomposition, have been demonstrated to provide heuristic information about evolutionary patterns.
2. In the three cladograms analysed, a significant relationship between body mass and phylogeny was found, especially for anteaters and the more inclusive sloth clades (Mylodontoidea, Nothrotheriidae, Megatheriidae and Megalonychidae).
3. For anteaters, constraints imposed by diet on the evolution of body size can be proposed. For sloths, additional support to previous studies is provided, indicating that megatheriids, nothrotheriids and mylodontoids showed a clear evolutionary trend towards large body sizes, probably linked to environmental changes since the Miocene.
4. A relationship between BMR and dietary habits can be proposed as the main factor influencing the evolution of body size, with substrate preferences playing a secondary role. Further studies investigating BMR and diet, based on an increased sample of fossil pilosans, are needed.
5. The stratigraphic pattern of the fossil record is also recognised as a bias (i.e., the dominance of Miocene and Plio-Pleistocene taxa). Hence, further fossil remains and palaeobiological studies, especially on pre-Miocene forms, are needed to elucidate a more complete understanding of body size evolution in anteaters and sloths.
5. Acknowledgments
The authors thank W. F. Simpson, K. Algielczyk, B. Patterson and W. Stanley (FMNH) for kindly providing access to the collections under their care; G. H. Cassini for a fruitful interchange of ideas; H. G. McDonald and T. J. Gaudin for greatly improving the quality of this work; and, finally, the organisers of the ‘Form and Function’ Symposium and the Editors of this special volume for their kind invitation to participate. This is a contribution to the projects PICT 2013-0386 to NT; PICT 2013-0389 and UNLP N750 to SFV.
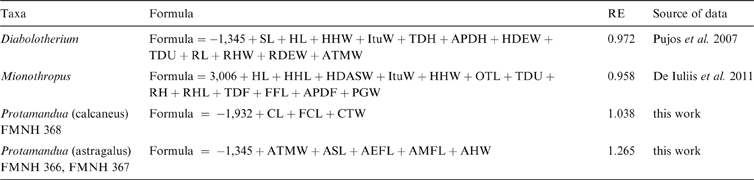
6. Appendix. Estimation equations developed in this work
Follows morphometric and statistical procedures and extant mammal database provided in Toledo et al. (Reference Toledo, Cassini, Vizcaíno and Bargo2014). FMNH = Field Museum of Natural History, Chicago. Abbreviations correspond to linear measurements used in Toledo et al. (Reference Toledo, Cassini, Vizcaíno and Bargo2014), as follows: AMFL = length of medial facet of astragalus; AHW = width of astragalar head; APDF = anteroposterior diameter of femur at midshaft; APDH = anteposterior diameter of humerus at midshaft; ASL = length of astragalus; AEFL = length of ectal facet of astragalus; ATMW = maximum width of astragalar trochlea; CL = total length of calcaneus; CTW = width of calcaneal tuber; FCL = functional length of calcaneus; FFL = femoral functional length; HDEW = humeral distal epiphysis width; HHW = width of humeral head; HL = humerus total length; ItuW = width between greater and lesser humeral tuberosities; OTL = length of olecranal tubercle; PGW = width of patellar groove; RDEW = radial distal epiphysis width; RH = radial height at midshaft; RHL = length of radial head; RHW = width of radial head; RL = radius total length; TDF = transverse diameter of femur at midshaft; TDH = transverse diameter of humerus at midshaft; TDU = transverse diameter of ulna at midshaft; SL = scapular length.