


1. Introduction
Fractures (i.e. joints, veins, faults, pressure-solution seams) may represent preferential pathways for geofluids within anticline reservoirs, and the relationships between the development of anticlines and fracturing have been extensively studied in the last 50 years (e.g. McQuillan, Reference McQuillan1974; Dietrich, Reference Dietrich1989; Lemiszki et al. Reference Lemiszki, Landes and Hatcher1994; Cosgrove & Ameen, Reference Cosgrove and Ameen1999; Lacombe et al. Reference Lacombe, Bellahsen and Mouthereau2011; Carminati et al. Reference Carminati, Aldega, Trippetta, Shaban, Narimani and Sherkati2014a; Watkins et al. Reference Watkins, Butler, Bond and Healy2015; Beaudoin et al. Reference Beaudoin, Labeur, Lacombe, Koehn, Billi, Hoareau, Boyce, John, Marchegiano, Roberts, Millar, Claverie, Pecheyran and Callot2020; Labeur et al. Reference Labeur, Beaudoin, Lacombe, Emmanuel, Petracchini, Daëron, Klimowicz and Callot2021). These studies showed that anticlines are commonly affected by two frequent orientations of joints and veins, striking parallel (i.e. longitudinal) and orthogonal (i.e. transverse) to the fold axis. In the past, the formation of such joint and vein sets has been attributed to the layer bending accommodating the growth of folds (Ramsay, Reference Ramsay1967; Stearns, Reference Stearns1967; Murray, Reference Murray1968; Dietrich, Reference Dietrich1989; Price & Cosgrove, Reference Price and Cosgrove1990; Lemiszki et al. Reference Lemiszki, Landes and Hatcher1994). The presence of joints and veins in the ‘undeformed’ foreland of fold-and-thrust belts (e.g. Dunne & North, Reference Dunne and North1990; Railsback & Andrews, Reference Railsback and Andrews1995; Zhao & Jacobi, Reference Zhao and Jacobi1997; Billi & Salvini, Reference Billi and Salvini2003; Whitaker & Engelder, Reference Whitaker and Engelder2006; Martinelli et al. Reference Martinelli, Bistacchi, Balsamo and Meda2019; Tavani et al. Reference Tavani, Granado, Corradetti, Seers, Casas and Muñoz2020) suggests, however, that several joints and veins observed on anticlines of accretionary wedges might have developed before folding, i.e. during foreland deformation. Joints and veins oriented parallel and orthogonal to the trend of the foredeep and forebulge have indeed been recognized on anticlines of different fold-and-thrust belts worldwide, e.g. Appalachian chain (Zhao & Jacobi, Reference Zhao and Jacobi1997; Lash & Engelder, Reference Lash and Engelder2007), Zagros Mountains (Casini et al. Reference Casini, Gillespie, Vergés, Romaire, Fernández, Casciello, Saura, Mehl, Homke and Embry2011; Lacombe et al. Reference Lacombe, Bellahsen and Mouthereau2011), Rocky Mountains (Beaudoin et al. Reference Beaudoin, Leprêtre, Bellahsen, Lacombe, Amrouch, Callot, Emmanuel and Daniel2012), Indochina (Arboit et al. Reference Arboit, Amrouch, Collins, King and Morley2015), and Andes (Branellec et al. Reference Branellec, Callot, Nivière and Ringenbach2015). These observations confirm that a significant number of joints affecting anticlines developed in the foreland region before folding and thrusting (Tavani et al. Reference Tavani, Storti, Lacombe, Corradetti, Muñoz and Mazzoli2015).
The simplest criterion to distinguish pre-folding from syn-folding joints is based on the analyses of joint orientation with respect to the orientation of the fold axis. Syn-folding, bending-related structures are oriented parallel and orthogonal to the fold axis, whereas pre-folding structures can develop oblique to the fold axis (Lash & Engelder, Reference Lash and Engelder2007; Tavani et al. Reference Tavani, Storti, Lacombe, Corradetti, Muñoz and Mazzoli2015; Labeur et al. Reference Labeur, Beaudoin, Lacombe, Emmanuel, Petracchini, Daëron, Klimowicz and Callot2021), as they reflect the direction of pre-folding layer-parallel shortening or the foreland flexure direction, both of which may be oblique with respect to the direction of compressional strain during folding. Since folds are generally elongated parallel to the trend of the hosting foredeep-belt system, the distinction between pre-folding and syn-folding joints can be challenging. In this sense, the common parallelism between the foredeep- and thrust-related anticlines introduces a possible source of error (both terminological and interpretative), as ‘longitudinal’ and ‘transverse’ joints are nearly parallel and perpendicular to both fold axes and the foredeep. In this case, cross-cutting relationships with pressure-solution cleavages developed during layer-parallel shortening could help to differentiate pre-folding and syn-folding joints. For example, vertical joints and veins oriented orthogonal to the fold axis, when closely associated with (i.e. perpendicular to and coeval with) tectonic stylolites oriented orthogonal to both joints and bedding, are very likely to have been formed during pre-folding layer-parallel shortening (e.g. Beaudoin et al. Reference Beaudoin, Labeur, Lacombe, Koehn, Billi, Hoareau, Boyce, John, Marchegiano, Roberts, Millar, Claverie, Pecheyran and Callot2020; Labeur et al. Reference Labeur, Beaudoin, Lacombe, Emmanuel, Petracchini, Daëron, Klimowicz and Callot2021). Another observation that could allow structural geologists to distinguish pre-folding from syn-folding opening-mode fractures regards their intensity distribution across different structural positions along a fold (i.e. backlimb, hinge, forelimb, periclinal closure). In the case of syn-folding fracturing, joint intensities should vary along the fold, reaching their highest values in high-strain regions of the fold (e.g. Watkins et al. Reference Watkins, Butler, Bond and Healy2015). Pre-folding joints and veins are instead characterized by intensity values that are quite homogeneous along a fold (Tavani et al. Reference Tavani, Storti, Lacombe, Corradetti, Muñoz and Mazzoli2015). The achievement of a complete characterization of joint orientation and intensity along a fold is, however, often complicated by the lack of extensive outcrops and, more importantly, by the severe influence exerted by the mechanical stratigraphy (e.g. Ladeira & Price, Reference Ladeira and Price1981; Huang & Angelier, Reference Huang and Angelier1989; Gross et al. Reference Gross, Fischer, Engelder and Greenfield1995; Peacock & Mann, Reference Peacock and Mann2005; Wu & Pollard, Reference Wu and Pollard1995; Laubach et al. Reference Laubach, Olson and Gross2009; Cawood & Bond, Reference Cawood and Bond2018), by the occurrence of faults (e.g. Peacock et al. Reference Peacock, Dimmen, Rotevatn and Sanderson2017) or by variations in strain directions due to non-cylindrical folding or flexuring (i.e. Billi, Reference Billi2005; Petracchini et al. Reference Petracchini, Antonellini, Billi and Scrocca2015). For these reasons, the investigation of the relationship between folding and fracturing requires the collection of robust and well-distributed (both spatially and stratigraphically) datasets.
A typical case study where the application of the simple criterion of parallelism between joints and fold axis could be risky in terms of tectonic interpretations is represented by the Apennine fold-and-thrust belt (Italy). In this belt, several pioneering studies on fold-related fracturing were carried out during the 1970s and 80s (e.g. Alvarez et al. Reference Alvarez, Engelder and Geiser1978; Marshak et al. Reference Marshak, Geiser, Alvarez and Engelder1982; Engelder & Marshak, Reference Engelder and Marshak1985; Geiser, Reference Geiser1988). More recent studies demonstrated the occurrence of a pre- to early-folding fracture pattern in reservoir-scale anticlines (e.g. Tavarnelli & Peacock, Reference Tavarnelli and Peacock1999; Tavani et al. Reference Tavani, Storti, Bausa and Munoz2012, Reference Tavani, Storti, Lacombe, Corradetti, Muñoz and Mazzoli2015; Francioni et al. Reference Francioni, Pace, Vitulli, Sciarra and Calamita2019).
In the present work, we report on the fracture pattern hosted in the Pietrasecca Anticline, located in the central Apennines. The deformation structures exposed in the study anticline include cm- to m-sized joints, pressure-solution cleavages and the km-scale Pietrasecca Fault (Smeraglia et al. Reference Smeraglia, Aldega, Billi, Carminati and Doglioni2016). Our detailed field investigations coupled with digital outcrop model interpretation, allowed us to set robust constraints on the pre-folding nature of the fracture pattern in this sector of the central Apennines. This study constitutes a new case history that may help geologists working on the field of fractured reservoirs to better understand the fracture pattern expected within subsurface structures.
2. Geological setting
2.a. Central Apennines
The central Apennines developed since late Oligocene time on top of the westward subduction of the Adriatic plate under the European plate (Doglioni, Reference Doglioni1991; Carminati et al. Reference Carminati, Lustrino and Doglioni2012). The subduction trench retreat produced a progressive northeastward migration of the NE-verging folds and thrusts. The thrusts scraped off and piled up the pre- to syn-orogenic sedimentary succession of the Adriatic plate (Cosentino et al., Reference Cosentino, Cipollari, Marsili and Scrocca2010). The pre-orogenic deposits of the central Apennines mostly consist of a 3000–4000 m thick carbonate succession characterized by limestones and dolostones deposited in a carbonate platform environment (i.e. Latium–Abruzzi Carbonate Platform) between Late Triassic and Late Cretaceous time (Parotto & Praturlon, Reference Parotto and Praturlon1975; Damiani et al., Reference Damiani, Chiocchini, Colacicchi, Mariotti, Parotto, Passeri and Praturlon1991; Cosentino et al., Reference Cosentino, Cipollari, Marsili and Scrocca2010). Syn-orogenic deposits include ∼100–200 m thick carbonate ramp limestones (Lithothamnion and Bryozoan limestones Formation; Sabbatino et al. Reference Sabbatino, Tavani, Vitale, Ogata, Corradetti, Consorti, Arienzo, Cipriani and Parente2021), capped by ∼100 m-thick hemipelagic marls (Orbulina marls Formation) and ∼1600 m thick flysch (e.g. Milli & Moscatelli, Reference Milli and Moscatelli2000). These three units form the infill of the late Miocene foredeep basin developed due to the flexure of the subducting Adriatic lithosphere (e.g. Royden et al. Reference Royden, Patacca and Scandone1987; Cipollari et al. Reference Cipollari, Cosentino and Parotto1995).
The subduction and flexure of the foreland Adria plate generated bending and bulging accommodated by early orogenic extensional structures oriented both parallel and perpendicular to the compressive front (Doglioni, Reference Doglioni1995; Bigi & Costa Pisani, Reference Bigi and Costa Pisani2003; Carminati et al. Reference Carminati, Fabbi and Santantonio2014b).
Since early Pliocene time, the central Apennines were dissected by post-orogenic extensional fault systems that formed, or partially reactivated thrust faults, in response to hinterland extension and the associated opening of the Tyrrhenian back-arc basin (Doglioni, Reference Doglioni1991; Doglioni et al. Reference Doglioni, Gueguen, Sàbat and Fernandez1997; Curzi et al. Reference Curzi, Aldega, Bernasconi, Berra, Billi, Boschi, Franchini, Lelij, der Viola and Carminati2020). Extensional faults mainly strike NW–SE with subordinate WSW–ENE- to SW–NE-striking extensional to transtensional faults (Cavinato & De Celles, Reference Cavinato and De Celles1999; Morewood & Roberts, Reference Morewood and Roberts2000).
2.b. Stratigraphy and main structural features of the study area
The study area is located in the Carseolani Mountains, which represent a tectonic unit characterized by NW–SE-trending folds and NW–SE-striking thrust faults with tectonic transport towards the NE (Fig. 1a; Mostardini & Merlini, Reference Mostardini and Merlini1986; Patacca et al. Reference Patacca, Scandone, Luzio, Cavinato and Parotto2008). The study area is characterized by the Pietrasecca Anticline, an open anticline with a steeply SW-dipping axial plane (Fig. 1c; Smeraglia et al. Reference Smeraglia, Aldega, Billi, Carminati and Doglioni2016). The Pietrasecca Anticline is located at the NW termination of the Caresolani Mountains (Fig. 1), where the fold axis and the thrust sheet are characterized by an arcuate shape in map view. The fold axis trends NW–SE (∼320° N trend) south of Pietrasecca village and rotates ∼20° counterclockwise (to ∼300° N trend) northwards, near Tufo village (Fig. 1a, c). The Pietrasecca Anticline is dissected by two ENE–WSW-striking and SSE-dipping normal faults (Fig. 1c). Of these, the best-exposed fault is the Pietrasecca Fault, which is ∼3 km long, dips ∼80° towards SSE, and crops out ∼500 m E of Pietrasecca village (structural station 13 in Fig. 1c). Major and minor slip surfaces in this outcrop suggest that the Pietrasecca Fault accommodated mainly dip slip movements. The Pietrasecca Fault shows a maximum vertical displacement of ∼100 m (Smeraglia et al. Reference Smeraglia, Aldega, Billi, Carminati and Doglioni2016, Reference Smeraglia, Mercuri, Tavani, Pignalosa, Kettermann, Billi and Carminati2021).

Fig. 1. Geological setting of the study area. (a) Tectono-stratigraphic framework of the portion of the central Apennines of Italy indicated with a black square in the inset. The Pietrasecca Anticline pertains to the Carseolani Mountains tectonic unit. In the inset: blue lines = thrust faults, red lines = normal faults. (b) Simplified stratigraphic column of the study area. (c) Simplified geological map and cross-section after Smeraglia et al. (Reference Smeraglia, Aldega, Billi, Carminati and Doglioni2016). Locations where photos of Figure 2a, b have been taken and positions of structural stations are indicated on map.
Pre- and syn-orogenic rocks can be identified in the study area (Fig. 1; Civitelli & Brandano, Reference Civitelli and Brandano2005; Smeraglia et al. Reference Smeraglia, Aldega, Billi, Carminati and Doglioni2016): (1) Radiolitidae limestones (Lower Cretaceous), (2) Lithothamnion and Bryozoan limestones (lower to middle Miocene), (3) Orbulina marls (upper Miocene) and (4) flysch deposits (upper Miocene). The pre-orogenic Radiolitidae limestones consist of calcareous mudstones with isolated rudist rudstones bodies deposited in a patch reef environment. They crop out with a thickness of ∼50 m south of Pietrasecca village (Fig. 1b–c), where the upper stratigraphic boundary is also exposed. The syn-orogenic Lithothamnion and Bryozoan (LB) limestones paraconformably rest on the Radiolitidae limestones and are ∼100 m thick (Fig. 1b). Three main lithostratigraphic units of LB limestones can be recognized: LB1, LB2 and LB3 from bottom to top (Fig. 1b; Civitelli & Brandano, Reference Civitelli and Brandano2005). LB1 and LB3 have a thickness of ∼25 m and consist of havana-brown bioclastic calcarenite deposits with grainstone to packstone texture (Civitelli & Brandano, Reference Civitelli and Brandano2005). LB2 consists of ∼50 m thick white packstones, wackestones and floatstones with Bryozoans and large bivalves (Civitelli & Brandano, Reference Civitelli and Brandano2005). Lithothamnion and Bryozoan limestones are affected by two sets of pressure-solution cleavages. One set is oriented roughly parallel to bedding and developed during burial and diagenesis (Civitelli & Brandano, Reference Civitelli and Brandano2005). The other set is oriented oblique to bedding and developed during the incipient phases of shortening of the central Apennines (Tavani & Cifelli, Reference Tavani and Cifelli2010). Although pressure-solution cleavages mainly affect LB3, they are present (and locally pervasive) also in LB1 and LB2. Lithothamnion and Bryozoan limestones are topped by ∼60 m thick hemipelagic marls with planktonic foraminifers (Orbulina marls), and by ∼1600 m of siliciclastic sandstones and marls (flysch; Milli & Moscatelli, Reference Milli and Moscatelli2000).
3. Methods
We collected data from 13 structural stations located in different positions of the Pietrasecca Anticline (Fig. 1c). Despite the study area being densely vegetated (Fig. 2), locations of the structural stations were chosen to best cover all the structural positions of the Pietrasecca Anticline (i.e. backlimb, forelimb, periclinal closure, hinge) and all the different stratigraphic units (Fig. 1c). Due to vegetation cover and/or the high erodibility of rocks, the Orbulina marls and most of the flysch exposures in the study area did not allow the collection of structural data. We therefore collected data within the same flysch in six supplementary structural stations located near the study area (F1–6 in Fig. 1a, c).

Fig. 2. Panoramic view of the backlimb (a) and forelimb (b) of the Pietrasecca Anticline with interpretation. Locations where photos have been taken are reported in Figure 1. RL: Radiolitidae limestones; LB1, LB2 and LB3: Members of the Lithothamnion and Bryozoan Limestones.
Deformation structures in the study area, in addition to minor faults, mostly consist of joints and pressure-solution cleavages, with rare and usually mm-thick veins. In the following, we will use the term fracture to collectively indicate an assemblage that includes joints, veins and pressure-solution seams. In each station we collected data on bedding, faults (orientation and, if visible, slickenline orientations), oblique-to-bedding pressure-solution cleavage and joints. Structural data were collected through scan-lines, scan-areas and virtual outcrop model analysis (Fig. 1c). The orientations of bedding, pressure-solution cleavage, fault surfaces and slickenlines were collected in all the structural stations. The joint data were collected using sub-horizontal scan-lines (e.g. Priest & Hudson, Reference Priest and Hudson1981) in most structural stations, allowing us to obtain the linear intensity of joints (see below for further details). The orientation of scan-lines with respect to that of the outcrop produces an orientation bias during sampling of joints (Terzaghi, Reference Terzaghi1965), with joints striking sub-parallel to the trend of scan-line being relatively under-sampled. To minimize the sampling bias, we avoided scan-lines with orientations parallel to the strike of joints. Orientation data were collected using FieldMove Clino App on iPhone 6S. During data-recording sessions, we carefully avoided interference of metal objects and electronic devices that could affect the magnetic field (Allmendinger et al. Reference Allmendinger, Siron and Scott2017). Furthermore, we periodically checked the accuracy of structural measurements taken using iPhone by comparing them with a handheld compass. For each scan-line, we manually classified the joints in different orientation sets using 1 % area contouring of poles to fractures. For each set, we determined its (1) mean orientation (dip and dip azimuth), (2) mean orientation after data rotation for bed dip removal, (3) mean spacing and (4) linear intensity. For the calculation of mean spacing (s) and linear intensity (I), we accounted for the orientation bias using the Terzaghi correction (Terzaghi, Reference Terzaghi1965): $s = L'/n [m]; I = n/L' = 1/s [m^{-1}] $
where n is the number of fractures collected along the scan-line, and L′ is the length of the scan-line component orthogonal to the mean orientation of the fracture set: $L' = L * cos \alpha [m] $
where α is the angle between scan-line and vector normal to the mean orientation of the joint set. To avoid an overestimation of the bias correction, we fixed the maximum correction angle α to 75°.
In addition to scan-lines, we performed 14 scan-areas (Dershowitz & Herda, Reference Dershowitz and Herda1992) on bedding surfaces to better characterize (1) the abutting and/or cross-cutting relationships between joints and (2) the orientation of fractures on the top of Radiolitidae limestones (station 1; Fig. 1c). It was possible to perform scan-areas only for structural stations 1 (11 scan-areas) and 2 (3 scan-areas). The orientation of fractures in each scan-area was retrieved using the NetworkGT plugin for QGIS (Nyberg et al. Reference Nyberg, Nixon and Sanderson2018).
Regarding structural stations 9, 10, 11, 12 and F1–6, outcrops were too discontinuous to perform useful scan-lines. In these stations, only bedding, joint and pressure-solution cleavage orientations were collected, and no scan-line data were recorded.
For structural station 13, which represents the best exposure of the Pietrasecca Fault (see Fig. 1c), we combined field data with data derived from a virtual outcrop model (Fig. 3). In detail, we collected joint data along two scan-lines to constrain joint data retrieved from the virtual outcrop model (Fig. 3). The virtual outcrop model was built using Unmanned Aerial Vehicle imagery and the Structure from Motion Multi View Stereo photogrammetry algorithm (Remondino & El-Hakim, Reference Remondino and El-Hakim2006; James & Robson, Reference James and Robson2012). The model consists of a textured mesh of 17 × 106 triangular faces obtained from a point cloud containing 143 × 106 points, representing a surface of ∼14 000 m2. The virtual outcrop model was employed to collect a large amount of data, also from inaccessible portions of the outcrop. Structural data (fault, fractures and bedding orientations) were collected from the virtual outcrop model by manual digitization of traces (i.e. the intersection of fault, fractures and bedding surfaces with the outcrop topography) using the OpenPlot software (Fig. 3; Tavani et al. Reference Tavani, Arbues, Snidero, Carrera and Muñoz2011).

Fig. 3. Virtual outcrop model of the main outcrop of the Pietrasecca Fault after Smeraglia et al. (Reference Smeraglia, Mercuri, Tavani, Pignalosa, Kettermann, Billi and Carminati2021). Positions of scan-lines performed in the field are represented in yellow. Bottom left corner: example of real-time orientation data extraction from traces using Open Plot.
Due to the parallelism between the Pietrasecca Anticline and the Miocene foredeep, fractures striking roughly parallel and perpendicular to the Pietrasecca Anticline do strike parallel and perpendicular to the Miocene foredeep too. Accordingly, the terms ‘longitudinal’ and ‘transverse’ will henceforth be used to refer only to the orientation of joints with respect to the local fold axis, without any genetic correlation to folding, which will instead be addressed in the discussion section.
4. Results
4.a. Bedding and joints
The study area is mainly characterized by sub-horizontal to gently dipping bedding (Figs 1c, 2, 4a). In detail, dip angles are generally <18° with the exceptions of structural stations located in the forelimb of the Pietrasecca Anticline, where bedding generally dips 25–28° to the NE (i.e. stations 4, 10 and 12; Fig. 4a).

Fig. 4. Joints. (a) Cumulative (left) and local joint orientations from stations 1–12 and supplementary stations F1–6. The location of all structural stations is reported in a simplified version of the map of the study area. See Figure 1 for a more detailed version of the map. The mean orientation and linear intensity of each fracture set is reported in the stereoplots and is colour-coded based on the strike angle (see legend). Dashed lines represent fracture set orientations after rotation of data for bed dip removal. Black arrows indicate the local orientation of the axis of the Pietrasecca Anticline. (b) Field image with interpretation (right) showing joints that are oriented orthogonal to bedding. The photo was taken from structural station 8 (see (a) for its location).
In all the structural stations, joints are barren, not filled by cement, and non-strata-bound. They do not show evidence of reactivation on shear (except for one joint set at station 13, as discussed later). Joints are arranged in two main orientations, roughly striking NE–SW and NW–SE, transverse and longitudinal with respect to the trend of the fold-and-thrust belt, respectively (Fig. 4a). Joints are orthogonal to bedding and generally maintain the same main strike also after data rotation for bed dip removal (Fig. 4a, b). In most structural stations, both the transverse and the longitudinal joints are evident (structural stations 1–3, 5, 7–9, 11, 12; Fig. 4a). The transverse joints are NE–SW to E–W oriented and are characterized by linear intensities ranging between 2 m−1 and 24 m−1 (Fig. 4a). The longitudinal joints are NW–SE to N–S oriented and are characterized by intensities I = 2–11 m−1 (Fig. 4a). In structural station 12, the transverse joints are not observed (Fig. 4a). In some structural stations, groups of joints with a common orientation are not well defined (i.e. structural stations 4, 6 and 10; Fig. 4a). In these stations, joints are always orthogonal to bedding regardless of their highly variable strike angle, as their poles are distributed along the cyclographic representing bedding (Fig. 4a). In the additional structural stations F1–6, joints are arranged in longitudinal and transverse sets also within flysch (Fig. 4).
4b. Pressure-solution cleavage and cross-cutting relationships with joints
The oblique-to-bedding pressure-solution cleavage dips gently (25–30°) to the WSW-SW (except for station 6, where it dips to the S), and their poles form a single cluster also when bedding is restored to horizontal (Fig. 5a). Pressure-solution cleavage forms angles between 10° and 40° with respect to bedding, independently of the dip angle of the latter (Fig. 5b, c). At the hand sample scale, pressure-solution cleavage is composed of closed stylolites, which show no evidence of reactivation in opening or shear mode (Fig. 5d).

Fig. 5. Pressure-solution cleavage. (a) Cumulative (left) and specific (right) orientation of pressure-solution cleavage (after and before data rotation for bed dip removal) and bedding for the structural stations reported on the map. Data are represented in lower-hemisphere Schmidt nets. Explanation of symbols is reported within stereoplots 1 and 4. (b, c) Photograph (top) and interpretation (bottom) of outcrops where the angular relationships between pressure-solution cleavage (PSC) and bedding can be appreciated. Pressure-solution cleavage is oblique with respect to bedding, forming an angle of ∼30°, both for gently (b) and steeply (c) dipping bedding. (d) Polished section of a rock sample showing pressure-solution cleavage sets oriented parallel and oblique to bedding.
Relative age relationships between joints and pressure-solution cleavages can be inferred from cross-cutting and/or abutting relationships (Fig. 6). The longitudinal and transverse joints are characterized by mutually cross-cutting relationships (Fig. 6a). In our study area, the analysis of cross-cutting or abutting relationships between joints and pressure-solution cleavage can be performed only in a few outcrops, where pressure-solution cleavage is incipent, due to the lack of joints on outcrops pervaded by pressure-solution cleavage (i.e. where the spacing between the seams of pressure-solution cleavage is ∼1–2 cm). Where pressure-solution cleavages and joints occur together, pressure-solution cleavage oblique to bedding abuts on or crosses the joints (Fig. 6b, c). Where both bedding-parallel and oblique-to-bedding pressure-solution cleavages are visible, we observe joints that often arrest on bedding-parallel pressure-solution cleavage (Fig. 6d, e), whereas joints cross (Fig. 6d) or are deformed (Fig. 6e) by the oblique-to-bedding pressure-solution cleavage.

Fig. 6. Cross-cutting relationships. (a) Scan area and related rosediagram showing mutual cross-cutting relationships between two joint sets. (b) The trace of a pressure-solution cleavage abuts on a joint. (c) Pressure-solution cleavages oriented oblique to bedding both cross and abut on (see black arrow) a joint. (d) Joints abut on bedding-parallel pressure-solution cleavages (black arrow). (e) A longitudinal joint is deformed by pervasive pressure-solution cleavage. Black arrows indicate portions of the outcrops where the joint is dislocated by pressure-solution cleavage.
4.c. Structural data from the main outcrop of the Pietrasecca Fault
The Pietrasecca Fault (Figs 3, 7) is characterized by a ∼15 m thick fault core, which accommodates ∼50 m of displacement, delimited by two SSE-dipping (∼80°) main fault surfaces (Fig. 3 and stereoplot 1 in Fig. 7a). The fault core separates the hangingwall damage zone hosted in LB3 from the footwall damage zone hosted in LB2 (Fig. 7a, b). Slickenlines and cm- to m-scale wavelength grooves along the main fault surfaces indicate pure dip-slip extensional kinematics (stereoplot 1 in Fig. 7a and c). Normal and reverse minor faults affect both hangingwall and footwall damage zones (stereoplots 2 and 3 in Fig. 7a). The hangingwall damage zone is characterized by sub-horizontal bedding with pressure-solution cleavages, oriented parallel and oblique to bedding, dipping ∼30° to SW-WSW (stereoplots 3 and 4 in Fig. 7a). Reverse faults in the hangingwall damage zone dip 10–50° to E-ENE, and slickenlines indicate hangingwall motion towards the W-SW (stereoplot 3 in Fig. 7a). Steeply dipping (60–90°) extensional faults in the hangingwall strike NW–SE, NNW–SSE and ENE–WSW, and display mostly dip-slip to dextral transtensional kinematics (stereoplot 3 in Fig. 7a). The scan-line performed in the hangingwall damage zone (SL12; Fig. 7a) highlights a pervasive sub-vertical joint set striking E–W (I = 23 m−1; stereoplot 4 in Fig. 7a). Moreover, two minor sub-vertical joint sets strike NE–SW and have intensity of 2–4 m−1 (stereoplot 4 in Fig. 7a). The manual interpretation of the virtual outcrop confirms the predominance of NE–SW to E–W-striking sub-vertical joints, with poles that are distributed along the cyclographic representing the bedding orientation (stereoplot 5 in Fig. 7a).

Fig. 7. Structural data from structural station 13, i.e. the main outcrop of the Pietrasecca Fault. The location of the outcrop is reported in the simplified geological map in the upper left corner. See Figure 1 for a more detailed version of the geological map. (a) Field data from the main fault surface and from the footwall and hangingwall damage zones are reported in stereoplots 1–4 and 6. Rotax or slip-normal (i.e. the direction perpendicular to striation and lying along the fault plane) is reported in stereoplot 2 for minor normal faults in the footwall damage zone. Data collected on the virtual outcrop model after Smeraglia et al. (Reference Smeraglia, Mercuri, Tavani, Pignalosa, Kettermann, Billi and Carminati2021) are reported in stereoplots 5 and 7 for the hangingwall and footwall damage zone respectively. All stereoplots are Schmidt-net lower hemisphere. Contouring is performed with 1 % area method. (b) Close-up view of the fault core. Yellow arrows indicate the clay-rich layer within the fault core (Smeraglia et al. Reference Smeraglia, Aldega, Billi, Carminati and Doglioni2016). (c) Dip-slip grooves and striations on the main slip surface of the Pietrasecca fault.
The bedding in the footwall damage zone is gently dipping (15–30°) towards the NE (stereoplot 2 in Fig. 7a). In the footwall damage zone, reverse faults dip ∼40° towards ESE, with hangingwall motion towards WNW (stereoplot 2 in Fig. 7a). Extensional faults steeply dip (70–90°) towards SE-SSE and show dip-slip to right lateral transtensional kinematics (stereoplot 2 in Fig. 7a). The contour stereoplot of poles to joint data collected along the scan-line (SL11) shows one cluster representing sub-vertical joints striking NE–SW to ENE–WSW (stereoplot 6 in Fig. 7a). This cluster can be regarded as the sum of two main subsets with slightly different strike angle, one with intensity 21 m−1 and the other with intensity 8 m−1 (stereoplot 6 in Fig. 7a). Other poles to joints are distributed along the cyclographic representing the mean bedding orientation (stereoplot 7 in Fig. 7a). Shear fractures with the same orientation of joints show, in places, slickenlines compatible with dextral strike-slip kinematics.
4.d. Joints vs stratigraphy and vs main tectonic structures
In this section, we report on the relationship between joints and stratigraphy (Fig. 8) and between joints and the main tectonic structures (i.e. the Pietrasecca Anticline and fault; Figs 9, 10). All the joints recognized in each structural station (see Figs 4, 7) have been classified as longitudinal or transverse depending on their orientation with respect to the axis of the Pietrasecca Anticline.

Fig. 8. Joint orientation and intensity vs stratigraphy. (a) Rosediagrams representing strike angle of joints after bed dip removal for each geological formation. Petals of the rosediagrams are 10° wide. On the right side: close view of structural station 1 where a local rotation of joint orientation occurs between Radiolitidae Limestones (RL) and Lithothamnion & Bryozoan Limestones (LB). Rosediagrams on the right represent joint orientations from scan-areas performed on the top bedding surface of RL (green stereoplot at bottom left) and from scan-lines performed on the LB cliff. (b) Violin plot representing distribution of linear intensities of joints for each stratigraphic unit.

Fig. 9. Joints vs Pietrasecca Anticline. (a) Portion of the BB′ cross-section (see Fig. 1) with approximate location of the structural stations. The structural stations are positioned in the cross-section based on their distance on the map from the axis of the Pietrasecca Fault (see also Fig. 1). (b) Simplified geological map of the study area (see Fig. 1 for a more detailed version) with positions of structural stations projected along the fold axis and rosediagrams of strike angle of joints after bed dip removal. Petals of the rosediagrams are 10° wide and are colour-coded depending on the geological formation in the corresponding structural station (see also Fig. 1). Black arrows indicate the local orientation of the axis of the Pietrasecca Anticline. The actual location of the structural station is reported transparently in the background. (c) Relative orientation of longitudinal joints with respect to the trend of the fold axis (above) and linear intensity of longitudinal joints vs map distance from the fold axis (below). Relative orientation of joints is represented by their angular deviation from the local orientation of the axis of the Pietrasecca Anticline (α angle) as shown in the legend. The linear intensity of all the joints (i.e. number of all joints divided by the length of scan-line) is also represented. (d) Relative orientation of transverse joints with respect to the direction orthogonal to the trend of the fold axis (above) and linear intensity of transverse joints vs map distance from point 0 (see (b)) measured along the fold axis (below). Relative orientation of joints is represented by their angular deviation from the direction orthogonal to the local orientation of the axis of the Pietrasecca Anticline (β angle) as shown in the legend. Blue and red colours in (c) and (d) are graduated depending on the relative linear intensity of the joint set for a single scan-line.

Fig. 10. Joints vs Pietrasecca Fault. (a) Linear intensity of longitudinal joints vs map distance from point 0 measured along the Pietrasecca Fault. Projection of the locations of structural stations along the Pietrasecca Fault are represented in the portion of geological map above. Structural stations which are located far from the main fault (map distance >300 m) are displayed transparently both on the map and in the graph. (b) Linear intensity of transverse joints vs map distance from the Pietrasecca Fault. The structural stations are positioned in the cross-section AA′ (see Fig. 1 for location) based on their map distance from the Pietrasecca Fault. The linear intensity of all the joints (i.e. number of all joints divided by the length of scan-line) is also represented.
The longitudinal and transverse joints are clearly recognizable in all the investigated stratigraphic units except for LB3, where joints are variably oriented, with slightly higher concentrations for the NE–SW and WNW–ESE orientations (Fig. 8a). The orientations of the transverse and longitudinal joints remain constant throughout the stratigraphic column and are characterized by median strike angles of 60–80° N and 150–170° N, respectively (Fig. 8a). An evident rotation of the mean orientation of joints occurs at structural station 1, where the stratigraphic boundary between Upper Cretaceous rocks (RL) and middle Miocene limestones (LB1 unit) is exposed. Here the transverse and longitudinal joints in RL are oriented ∼N45° E and N130° E respectively, showing a 20–30° counterclockwise rotation with respect to the orientation measured immediately above within the LB1 unit (Fig. 8a; see also Fig. 1 for the location of stations 1 and 3). Similarly, a clockwise rotation of the orientation of joints by ∼20° occurs among scan-lines SL1, SL2 and SL3, which have been performed moving horizontally towards ESE within LB1 at station 1 (Fig. 4).
All stratigraphic units are characterized by linear joint intensity with a median value of 3–4 m−1 (Fig. 8b). No relevant differences in linear intensity can be observed between the longitudinal and transversal joints in all the studied stratigraphic units (Fig. 7b).
The relationship between joints and the Pietrasecca Anticline has been evaluated by analysing changes in joint orientations and/or linear intensities with respect to the position of the fold axis (Fig. 9). Longitudinal joints have been tested against distance from the fold axis (Fig. 9a, c), whereas transverse joints have been tested along the fold axis (Fig. 9b, d). The orientation of both the longitudinal and the transverse joints has been expressed as relative orientation with respect to the Pietrasecca Anticline. In detail, we call α the acute angle that a longitudinal joint set makes with the local direction of fold axis (Fig. 9). Analogously, we call β the acute angle that a transverse joint set makes with the local orthogonal direction to the fold axis (Fig. 9).
The orientation of longitudinal and transverse joint sets is generally close to that of the fold axis and to its orthogonal direction, respectively (i.e. −15° < α, β < 15°; Fig. 9b–d). The orientation of joints significantly deviates from the trend of the Pietrasecca Anticline axis at stations 4–7, 9 and 12 (Fig. 9b, c; see also Fig. 4), mostly located on the forelimb of the Pietrasecca Anticline. The orientation of transverse joints significantly differs from the direction orthogonal to the axis of the Pietrasecca Anticline only at stations 4 and 6 (Fig. 9d; see also Fig. 4). The linear intensity of longitudinal joints does not show any relevant trend with distance from the Pietrasecca Anticline (Fig. 9c). Similarly, transverse joints are characterized by linear intensities <8 m−1 everywhere except stations 8 and 13, which are located near the main outcrop of the Pietrasecca Fault and show linear intensities of transverse joints >20 m−1.
The role of the Pietrasecca Fault on joints has been further investigated by testing the linear intensity of transverse and longitudinal joints against distance from and along the Pietrasecca Fault (Fig. 10). The intensity of longitudinal joints does not vary along the Pietrasecca Fault (Fig. 10a), whilst, as previously seen, the intensity of the transverse joints abruptly increases in the vicinity of the Pietrasecca Fault (Fig. 10b).
5. Discussion
5.a. Pre- vs syn- folding fracturing
The fracture pattern of the Pietrasecca Anticline includes two joint sets and two sets of pressure-solution cleavages. Despite the occurrence of local variability, joints are mainly bedding-perpendicular and oriented roughly parallel (longitudinal) and perpendicular (transverse) to the axis of the Pietrasecca Anticline (Figs 4, 7–10), which is in turn oriented parallel to the Apennines fold-and-thrust belt and associated foredeep. The pressure-solution cleavages are organized in a bedding-parallel and an oblique-to-bedding set. The oblique-to-bedding pressure-solution cleavage strikes roughly parallel to the fold axis and forms a constant angle of 30–40° with respect to bedding, regardless of the bedding dip (Fig. 5).
Previous studies conducted on several anticlines of the Apennines, specifically in the northern Apennines, highlighted a deformation pattern mainly composed of joints (and/or veins) and tectonic stylolites (e.g. Tavarnelli, Reference Tavarnelli1997; Tavani et al. Reference Tavani, Storti, Bausa and Munoz2012; Beaudoin et al. Reference Beaudoin, Koehn, Lacombe, Lecouty, Billi, Aharonov and Parlangeau2016, Reference Beaudoin, Labeur, Lacombe, Koehn, Billi, Hoareau, Boyce, John, Marchegiano, Roberts, Millar, Claverie, Pecheyran and Callot2020; Labeur et al. Reference Labeur, Beaudoin, Lacombe, Emmanuel, Petracchini, Daëron, Klimowicz and Callot2021). These studies showed that most of the joints and veins are oriented orthogonal to bedding and strike parallel and orthogonal to the fold axis. Joints and veins oriented orthogonal to bedding and striking oblique to the fold axis have also been reported (e.g. Labeur et al. Reference Labeur, Beaudoin, Lacombe, Emmanuel, Petracchini, Daëron, Klimowicz and Callot2021). Tectonic stylolites are characterized by two sets of orientations striking sub-parallel to the fold axis: one is sub-vertical and occurs in the near-vertical fold limbs, and the other, by far the more common, is oriented orthogonal to the bedding. These structures record all the compressive deformation stages from pre-folding foreland flexuring to the late stage of fold tightening and have been interpreted as follows: (1) joints and veins oriented orthogonal to bedding and striking oblique to the fold axis have been interpreted as structures related to foreland flexuring and bulging; (2) joints oriented orthogonal to the fold axis and tectonic stylolites oriented nearly orthogonal to bedding and striking parallel to the fold axis are considered as the result of a pre- to syn-folding layer-parallel shortening; (3) joints and veins striking parallel to the fold axis are associated with a syn-folding outer-arc extension; and (4) the sub-vertical tectonic stylolites striking parallel to the fold axis are associated with late-stage fold tightening.
The main peculiarity of our study area is hence the orientation of the pressure-solution cleavage, which is neither sub-vertical nor orthogonal to bedding, contrary to what is reported for other anticlines in the northern Apennines (e.g. Beaudoin et al. Reference Beaudoin, Labeur, Lacombe, Koehn, Billi, Hoareau, Boyce, John, Marchegiano, Roberts, Millar, Claverie, Pecheyran and Callot2020; Labeur et al. Reference Labeur, Beaudoin, Lacombe, Emmanuel, Petracchini, Daëron, Klimowicz and Callot2021). Such observation suggests that pressure-solution cleavage is not related to layer-parallel shortening or to late-folding tightening. We propose that the pressure-solution cleavage reported in this study formed in a pre-folding stage. Coherently with this inference, Tavani & Cifelli (Reference Tavani and Cifelli2010) carried out a regional study on this pressure-solution cleavage oblique to bedding and showed that it regionally affects syn-orogenic Lithothamnion and Bryozoan limestones with rather constant strike, angle to bedding, and frequency, suggesting a pre-folding origin (fig. 10 in Tavani & Cifelli, Reference Tavani and Cifelli2010).
The relative timing between pressure-solution cleavage and joints, with the former postdating the latter, can be deduced from field observations. The mutual cross-cutting relationships between longitudinal and transverse joints suggest they are coeval on a geological timescale (Fig. 6a). Most outcrops are characterized by pressure-solution cleavage oblique to bedding, where this cleavage crosses or abuts on the joints (Fig. 6b, c). In places, relicts of joints dissolved by pressure-solution cleavages also occur (Fig. 6e), providing further evidence that joints already existed during the formation of the pressure-solution cleavage. In this framework of abundant pressure-solution cleavages, the absence of mineralization within joints is enigmatic. In our interpretation, the already existing longitudinal and transversal joints should have represented potential reprecipitation loci for the carbonate dissolved during the development of oblique-to-bedding pressure-solution cleavage. Nevertheless, the vast majority of joints are barren, with a sporadic occurrence of mm-thick veins. Providing a plausible explanation for the absence of calcite within transversal and longitudinal joints is beyond the scope of this work. We can speculate that both joint sets were closed at the time of pressure-solution cleavage formation, each being non-orthogonal to the orientation of the minimum principal stress orientation (σ 3).
Although the orientation of longitudinal and transverse joints might suggest that joints formed in response to layer bending and stretching during fold growth (i.e. Ramsay, Reference Ramsay1967; Dietrich, Reference Dietrich1989; Lemiszki et al. Reference Lemiszki, Landes and Hatcher1994; Richard, Reference Richard1994; Bobillo-Ares et al. Reference Bobillo-Ares, Bastida and Aller2000; Fischer & Wilkerson, Reference Fischer and Wilkerson2000; Twiss & Moores, Reference Twiss and Moores2007; Watkins et al. Reference Watkins, Butler, Bond and Healy2015), we support a pre-folding origin. This preference is based on the pre-folding nature of the pressure-solution cleavage (postdating jointing) and on the lack of clear relationships between the intensity of joints and their structural position along the Pietrasecca Anticline (Fig. 9c, d). In fact, folding-related longitudinal joints should be characterized by: (1) orientation of joints parallel to the fold axis and (2) intensity related to the curvature of the fold (e.g. Ramsay, Reference Ramsay1967). This is clearly not the case for the longitudinal joints of the Pietrasecca Anticline, where the joints strikingly occur in areas where no curvature exists, such as the anticline backlimb (Fig. 1c). Analogously, as the Pietrasecca Anticline does not show any evident along-axis curvature (see the section in Fig. 10b), transverse joints cannot be associated with folding. In summary, although we cannot rule out a syn-folding reactivation of longitudinal and transverse joints, as documented in other anticlines worldwide (e.g. Bergbauer & Pollard, Reference Bergbauer and Pollard2004), our data suggest that both sets of joints exposed in the Pietrasecca Anticline originated before folding.
Finally, we remark the abrupt increase of the intensity of transverse joints in the vicinity of the Pietrasecca Fault (Fig. 10b), the high dip angle (i.e. ∼80°) of the main fault surface (the optimal dip angle of normal faults is ∼60°; Anderson, Reference Anderson1905), and the geometrical affinity between the transverse joints and the subsidiary faults within the damage zone of the Pietrasecca Fault (Fig. 7a). These observations clearly indicate a close relationship between the jointing event and the development of the Pietrasecca Fault and thus point towards a main pre-folding origin for the fault. Assuming that slip occurred under an Andersonian stress field, the fact that the fault rotaxes (also known as slip-normals, i.e. the direction perpendicular to striation and lying along the fault plane; Salvini & Vittori, Reference Salvini and Vittori1982) of subsidiary faults in the footwall of the Pietrasecca Fault are contained in the bedding plane (stereoplot 2 in Fig. 7a) suggests that the Pietrasecca Fault has been passively rotated during folding.
5.b. Tectonic evolution of the study area
The interpretation of field data indicates that joints, pressure-solution cleavage and faulting predate the folding event that generated the Pietrasecca Anticline. Fracturing hence occurred in the uppermost Miocene, obviously after the deposition of flysch (late Miocene) and before the folding event. Moreover, since the Lithothamnion and Bryozoan limestones seal (and thus postdate) the forebulge unconformity of the central Apennines (Sabbatino et al. Reference Sabbatino, Tavani, Vitale, Ogata, Corradetti, Consorti, Arienzo, Cipriani and Parente2021), the tectonic setting of fracturing can be placed in the foredeep region in between the fold-and-thrust belt and the forebulge (Fig. 11).
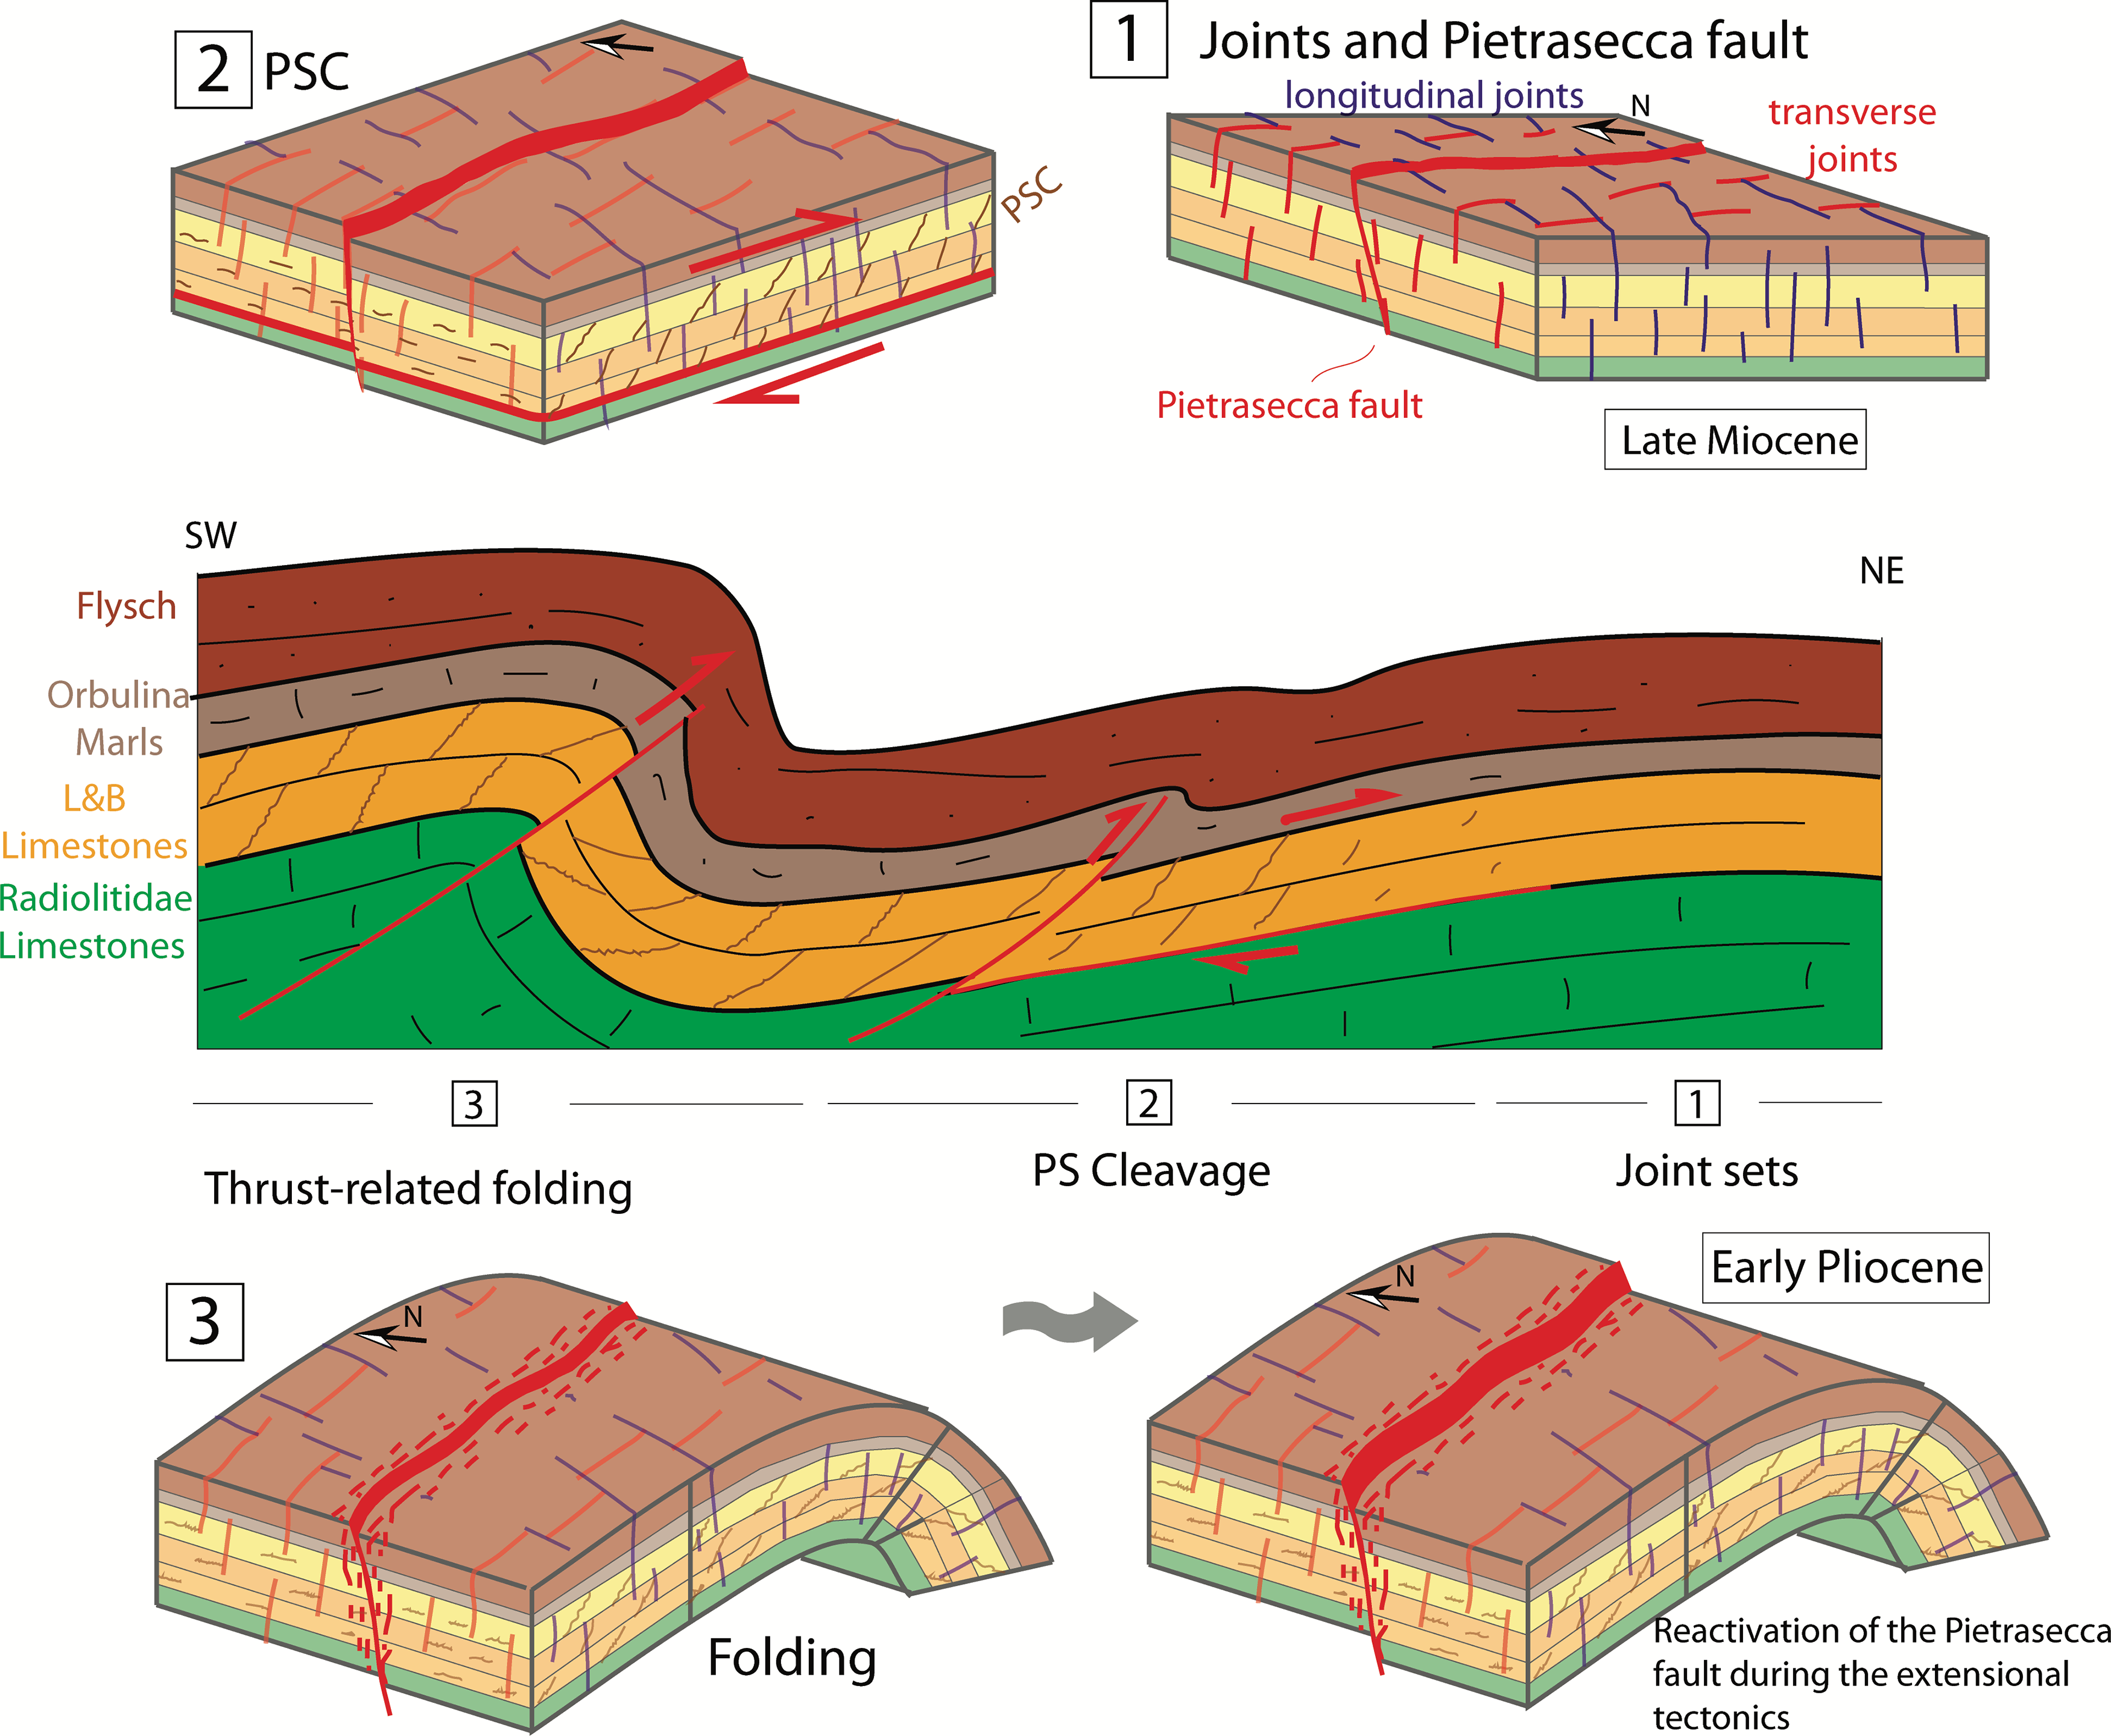
Fig. 11. Cartoon representing the tectonic evolution of the study area. (1) Development of longitudinal (blue) and (transverse) joint sets and Pietrasecca Fault in a foredeep environment. (2) WSW-SW-dipping pressure-solution (PS) cleavages develop because of a top to the NE-ENE layer-parallel shear. (3) The thrust-related Pietrasecca Anticline grows and joints, PSCs and Pietrasecca Fault passively rotate with bedding. (4) The Pietrasecca Fault eventually reactivates under the Pliocene extensional tectonics.
The longitudinal joints developed in the outermost sector of the foredeep in response to the Adria foreland subduction-related flexure (stage 1 in Fig. 11). Extensional structures that formed in a foreland-to-foredeep tectonic setting are widely documented worldwide (e.g. Tavani et al. Reference Tavani, Storti, Lacombe, Corradetti, Muñoz and Mazzoli2015) and in the Apennines (Calamita & Deiana, Reference Calamita and Deiana1980; Scisciani et al. Reference Scisciani, Calamita, Tavarnelli, Rusciadelli, Ori and Paltrinieri2001; Mazzoli et al. Reference Mazzoli, Pierantoni, Borraccini, Paltrinieri and Deiana2005; Tavani et al. Reference Tavani, Storti, Bausa and Munoz2012; La Bruna et al. Reference La Bruna, Agosta, Lamarche, Viseur and Prosser2018). Although our data do not unequivocally shed light on the origin of transverse strain, the mutual cross-cutting relationship between longitudinal and transverse joints (Fig. 6a) indicates that they are coeval on a geological timescale. Two possible explanations exist for the development of transverse joints at the same time as longitudinal joints. The first possibility is that the transverse joints are also related to foreland flexuring. In this scenario they can be cross-joints of longitudinal joints developing from temporal/local permutations between σ 2 and σ 3 causing transverse fracturing of blocks bounded by longitudinal joints (e.g. Gross, Reference Gross1993; Bai et al. Reference Bai, Maerten, Gross and Aydin2002; Billi, Reference Billi2005; Ferrill et al. Reference Ferrill, Smart, Cawood and Morris2021), or can be related to the damage zone of release faults (Destro, Reference Destro1995). A second possible explanation for cross-joints is that they accommodated along-foredeep stretching due to cross-sectional (e.g. Tavani et al. Reference Tavani, Granado, Corradetti, Seers, Casas and Muñoz2020) and/or planar (e.g. Doglioni, Reference Doglioni1995) arching of the foredeep. This latter mechanism is favoured in our view, as it is supported by the occurrence of a major transverse element, i.e. the Pietrasecca Fault, and by the lack of any remarkable longitudinal fault.
After the development of longitudinal and transverse bedding-perpendicular joints and formation of the Pietrasecca Fault, the advancement of the fold-and-thrust belt caused the development of a regional brittle–ductile basal décollement level (Tavani & Cifelli, Reference Tavani and Cifelli2010). This décollement includes pressure-solution cleavages regionally oriented at 45° with bedding and consistent with NE shearing accommodated within the entire LB limestones formation (stage 2 in Fig. 11). This regional décollement decoupled the deformation of the overlying clastic foredeep infill from the underlying pre-orogenic multilayer. The peculiarity of this regional décollement level, developing in ‘stiff’ carbonates at shallow structural levels (i.e. <5 km depth) instead of the overlying apparently weaker marly layer (Orbulina Marls), has already been pointed out (Tavani & Cifelli, Reference Tavani and Cifelli2010) and discussion of the reason for this puzzling observation is beyond the scope of this work.
With ongoing collision, the basal décollement of the accretionary wedge migrated to deeper structural levels. A blind thrust developed in the Mesozoic multilayer and the Pietrasecca Anticline grew (stage 3 in Fig. 11). Joints, pressure-solution cleavages and the Pietrasecca Fault were passively rotated with bedding during fold growth. In our opinion, the absence of folding-related deformation structures, contrary to what is observed in other anticlines of the Apennines (e.g. Beaudoin et al. Reference Beaudoin, Koehn, Lacombe, Lecouty, Billi, Aharonov and Parlangeau2016, Reference Beaudoin, Labeur, Lacombe, Koehn, Billi, Hoareau, Boyce, John, Marchegiano, Roberts, Millar, Claverie, Pecheyran and Callot2020; Labeur et al. Reference Labeur, Beaudoin, Lacombe, Emmanuel, Petracchini, Daëron, Klimowicz and Callot2021), is attributable to joints and pressure-solution cleavage already present during the onset of folding. Pre-existing discontinuities likely inhibited the formation of new fractures and were likely reactivated in opening or shear-mode during folding.
Finally, as witnessed by purely dip-slip grooves and slickenlines on the main fault surfaces (Fig. 7c), after the folding event the Pietrasecca Fault was reactivated as a dip-slip fault (stage 4 in Fig. 11).
6. Conclusions
Structural field data of joints collected along the Pietrasecca Anticline, in the central Apennines (Italy), highlight pre-orogenic fracturing events (pressure-solution cleavage and joints) which occurred in a foredeep setting, unrelated to folding. Although the arrangement of joints in two sets of orientations, longitudinal and transverse to the fold axis, would suggest a folding-related origin, the following pieces of field evidence suggest a pre-folding origin of joints: (1) cross-cutting relationships show that joints predate pressure-solution cleavages oblique to bedding, where this cleavage, in turn, certainly predates the folding event; (2) the intensity of both longitudinal and transverse joints does not relate to the structural position on the studied anticline (e.g. hinge, backlimb, forelimb). We thus conclude that both longitudinal and transverse joints must have formed in response to a foreland flexure-related strain. The procedure adopted in this study represents a robust approach to determine the timing of fracturing in outcropping analogues of anticline reservoirs, with important implications for the modelling of fluid migration.
Supplementary material
To view supplementary material for this article, please visit https://doi.org/10.1017/S0016756821001291
Acknowledgements
Funding by Sapienza Progetti di Ateneo 2017 and 2019 (E. Carminati) and Avvio alla Ricerca 2020 (M. Mercuri) are acknowledged. We warmly thank A. Cawood, two anonymous reviewers and the editor O. Lacombe, who contributed significantly to improving a previous version of this work.
Declaration of Interest
The authors declare none.


 Open access