Recognition of the link between healthcare-associated infections (HAIs) and the spread of multidrug-resistant organisms has increased. Although improved process measures have been shown to reduce the incidence of some HAIs (eg, central-line bloodstream infections, catheter-associated urinary tract infections, etc.Reference Anderson, Podgorny and Berrios-Torres 1 – Reference Marschall, Mermel and Fakih 3 ), the potential for cross-transmission of pathogens—particularly multidrug-resistant organisms—remains a growing concern. Significant efforts have been promoted internationally to reduce the incidence of cross-transmission events by improving hand hygiene and by using barrier precautions and enhanced environmental cleaning approaches.Reference Anderson, Chen and Weber 4 – Reference Ellingson, Haas and Aiello 7 However, given the limited data on the incidence of nosocomial infections and their cross transmission, these measures have often been advanced using hypothetical frameworks.
The current practice of investigation and verification of cross-transmission events includes the primarily manual, time-intensive process of identifying potential case clusters and the subsequent typing and comparison of these pathogens. Although this has previously been done via serotyping,Reference Fenoll, Jado, Vicioso and Casal 8 , Reference Sorensen 9 multilocus sequence typing (MLST),Reference Perez-Losada, Cabezas, Castro-Nallar and Crandall 10 and pulse-field gel electrophoresis,Reference Goering 11 these methods have significant limitations. Recent studies have shown that whole-genome sequencing (WGS) is the most effective approach for precise strain identification,Reference Gilchrist, Turner, Riley, Petri and Hewlett 12 , Reference Quainoo, Coolen and van Hijum 13 and this approach has now been applied to the investigation of both community- and healthcare-associated disease outbreaks.Reference Aanensen, Feil and Holden 14 – Reference Snitkin, Zelazny and Thomas 18
With the goal of facilitating rapid recognition of transmission clusters so that preventative measures could be initiated, we undertook an assessment of infection control surveillance by WGS of microbial pathogens as the first step in identifying cross-transmission events for epidemiologic review. To support this study, we developed and employed a cloud-based computing platform that performs genomic analysis and clinical correlate assessment of geospatial and temporal data from integrated medical records. However, for this approach to be effective, it is critical to determine the degree of genetic variation between 2 microbial strains that defines the strains as being so distinctly different as to effectively rule out a cross-transmission cluster. Because the clinical isolates that represent actual cross transmissions were unknown, we used intrapatient pathogen variation (ie, isolates from same patient) to estimate the lower limit of variation to be expected within cross transmissions. We compared this parameter to the larger variation seen in the pathogen population as a whole to define the single-nucleotide variant (SNV) thresholds that separate potential cross transmissions from unrelated samples (ie, interpatient samples).
We evaluated this methodology in a large-scale study at an academic medical center over the course of 1 year. The WGS was performed for 4 significant and common healthcare pathogens that collectively represent a sizable and persistent burden within the healthcare ecosystem: Staphylococcus aureus, Enterococcus faecium, Pseudomonas aeruginosa, and Klebsiella pneumoniae. A retrospective clinical review of patients with highly related bacterial isolates was then undertaken to determine the characteristics of apparent clusters and to identify potential routes of transmission.
Methods
Clinical
UMass Memorial Medical Center (UMMMC) is a 781-bed academic medical center encompassing 2 campuses in Worcester, Massachusetts. Patients who had isolates of S. aureus, E. faecium, P. aeruginosa, and K. pneumoniae identified in clinical or surveillance cultures obtained in the institution’s inpatient units or Emergency Departments between September 1, 2016, and September 30, 2017 were eligible for inclusion. Surveillance cultures for methicillin-resistant S. aureus (MRSA) and vancomycin-resistant enterococci (VRE) were routinely obtained on admission and weekly in the 7 adult intensive care units (ICUs), the pediatric ICU, the neonatal ICU, and the bone marrow transplant unit. For this study, we included 1 isolate per body site per patient per day.
Clinical and microbiological report data for all eligible patients were obtained from the UMass Medical School Integrated Data Lake environment, which is linked to the UMMMC electronic medical record. Clinical data were staged for deidentification in a commercially available electronic data management system, Philips IntelliBridge Enterprise (Philips Healthcare, Cambridge, MA) and housed within the secure University of Massachusetts Medical School computing environment. When a positive microbiology message was received from the laboratory system for a pathogen under study, the staged and codified patient data containing transactions of care were deidentified and sent to the Philips IntelliSpace Epidemiology (PIE) cloud platform for correlate assessment (Supplementary Methods online).
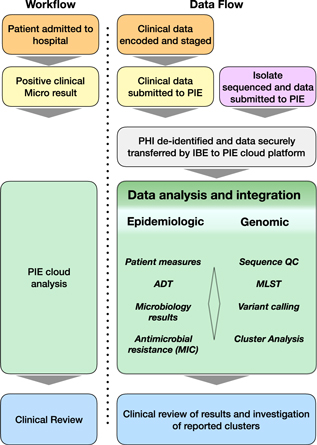
When the genomic sequence for an isolate became available, the FASTQ files were uploaded to the PIE cloud with the same deidentified tag as the patient correlate data. The PIE cloud-computing environment (Fig. 1) identifies potential related infections based on the genomic relatedness of bacterial isolates. Codified patient data in the PIE platform linked the genomic analysis results to patient medical records, including antimicrobial resistance profile, geospatial and temporal correlates. For PIE-identified genomic clusters, a retrospective manual chart review of all available clinical data was undertaken by the UMMMC clinical infection control department staff [ie, 6 APIC-certified infection control practitioners and the hospital epidemiologist (RTE III)] to determine whether the clinical evidence supported the cross transmission of the genomically related bacterial isolates between patients. Clusters were categorized as clinically supported if a common exposure could be identified, such as a shared ward, shared provider group, shared procedure, or a shared epidemiologic risk (eg, active injection drug use), and further classified as hospital acquired (ie, collected >2 days after admission), community acquired (ie, collected at time of or <2 days after admission without significant prior healthcare exposures), or healthcare associated (ie, collected at time of or <2 days after admission with significant prior healthcare exposures). 19 , Reference Shorr, Tabak, Killian, Gupta, Liu and Kollef 20 Patient clusters for which the classification was unclear or there was no identifiable epidemiologic link were classified as not supported by the available retrospective information.

Fig. 1. Workflow summary diagram of methods used in this study. Patient encounters occurred within the academic medical center. Patient samples are routinely sent to an external laboratory for clinical microbial diagnostics. Isolates were obtained from the clinical microbiology lab for genomic sequencing. The Philips IntelliBridge Enterprise (IBE) platform resides within the secure clinical environment and receives clinical data from patient encounters and microbiology results through an interface with the UMass Medical School Integrated Data Lake environment. IBE processes the clinical data protected health information (PHI) by first deidentifying the data on the IBE platform and sending the deidentified data to the Philips IntelliSpace Epidemiology (PIE) cloud-based application. When sequence data are generated from the genomics lab, they are delivered to the IBE platform, which performs sequence quality control; MLST, multi-locus sequence typing; and SNV, small nucleotide variants analysis. The PIE platform maps the isolate sequence data to the same deidentified ID of the previously transmitted clinical data, processes relevant epidemiological measures, and identifies isolates with high degrees of genomic relatedness as potential transmission clusters. Potential clusters and the associated clinical correlate data are re-identified and reported to physician via the PIE application.
The study was approved by the University of Massachusetts Medical School Institutional Review Board (no. H00010132).
Microbial
All isolates from patients meeting the eligibility criteria described above were requested from the clinical microbiology laboratory, and all received isolates were processed for sequencing. Isolates were excluded from the analysis if the obtained sequence coverage failed to meet target thresholds. Key factors contributing to exclusion included normal variation in sequence output, low-input DNA quality or quantity DNA, and/or inadequate bacterial growth. Detailed methods are provided in the Supplementary Materials online. Overall, 69.9% of all isolates received were successfully analyzed; by species, 75.6% of S. aureus isolates were analyzed, 47.8% of K. pneumonia were analyzed, 61.8% of P. aeruginosa were analyzed, and 61.9% of E. faecium were analyzed.
Results
During the study period, isolates were received from 1,073 patients with a positive culture for the 4 species of interest. Sequencing was undertaken on all isolates, with adequate data for analysis available for 823 patients, 87% of whom were inpatients. Patient ages ranged from infancy to >89 years (median age, 56 years) (Table 1). In total, 1,257 isolates were analyzed: S. aureus (75.8% of the total), E. faecium (6.8%), P. aeruginosa (9.4%), and K. pneumoniae (8.0%). The body site distribution of these isolates is presented in Table 1. No device-related isolates were included, and 57 MRSA and 11 VRE were obtained from surveillance cultures. Vancomycin resistance was reported in 83.7% of E. faecium isolates; resistance due to extended-spectrum β-lactamases (ESBL) was reported in 11.0% of K. pneumoniae; and methicillin resistance was reported in 48.4% of S. aureus.
Table 1. Patient Demographics and Isolate Clinical Characteristics

Note. MRSA, methicillin-resistant Staphylococcus aureus; VRE, vancomycin-resistant enterococci; ESBL, extended-spectrum β-lactamase.
a Patient and isolate counts for isolates obtained from clinical diagnostic lab.
b Patient and isolate counts for isolates for which genomic analyses were completed.
The number of SNV differences between all pairwise isolate combinations was determined for each species (Figs. 2 and 3). Each species exhibited a wide distribution of SNV distances among isolates. The median distance ranged markedly among species, with a median of 195 SNV for S. aureus at the low end and 4,400 for K. pneumoniae at the high end (Fig. 2A). Members within the same sequence type demonstrated less SNV distance variation between pairs, with median distances ranging from 65 to 317 SNV for S. aureus and K. pneumoniae, respectively (Fig. 2B).

Fig. 2. Distribution of single-nucleotide variant (SNV) differences by species, sequence type, and intrapatient isolates. Pairwise counts of SNV differences between isolates are presented for each of the species in the study. (A) The median distance and distribution varied markedly by species when all intraspecies isolates were considered. (B) Within sequence types, the SNV variation was much less, with median values ranging from 65 SNV for S. aureus to 317 SNV for K. pneumoniae. (C) Some patients produced isolates on multiple days or from multiple body locations. To better define SNV differences potentially indicative of transmission, we determined the median SNV differences for isolates from the same patient and of the same sequence type. These median values ranged from 4 to 16.5 SNV for S. aureus and K. pneumoniae, respectively.

Fig. 3. Intrapatient versus inter-patient single-nucleotide variant (SNV) distances inform thresholds for identification of transmission events. For each species (A–D), we compared the SNV distance distribution of pairwise SNV distance between intrapatient isolates to those of interpatient isolates. Although intrapatient differences are at the extreme low end of the interpatient distribution, there is overlap. (Left) The distribution of all pairwise differences is presented with the purple shaded region indicating the portion of the distribution expanded in the right panel. (Right) The distribution of interpatient (green) and intrapatient (orange) SNV difference overlap. A threshold value (dashed line) was selected to optimize detection of potential transmission events while attempting to limit false-positive results.
To establish a threshold for SNV differences that represents a closer genetic relationship, we considered differences among strains of the same sequence type isolated from the same patients (ie, intrapatient). These intrapatient values should approximate SNV differences expected for isolates associated with transmission between patients (ie, interpatient values). Our patient population with multiple isolates included 175 patients with S. aureus, 11 patients with E. faecium, 13 patients with P. aeruginosa, and 13 patients with K. pneumoniae. The different intrapatient samples were obtained over a range of 0 to 321 days. The median intrapatient SNV differences were substantially lower than interpatient SNV differences, ranging from S. aureus (n = 4), to E. faecium (n = 6), P. aeruginosa (n = 13), and K. pneumoniae (n = 16.5) (Fig. 2C). We further compared the distributions of intra- and interpatient distances with histograms (Fig. 3) and receiver operating characteristic (ROC) curves (Supplemental Fig. S1 online). The former shows the raw numbers and the latter the percentages of intra- and interpatient distances captured by each threshold.
By focusing on the specificity of the cutoff, we used the 2 visualizations as guidance to establish working thresholds of 12 SNV for S. aureus, 10 for E. faecium, 30 for P. aeruginosa, and 15 for K. pneumoniae. Applying single-linkage clustering and the species-specific thresholds, we identified interpatient clusters. In total, 34 clusters were defined involving 96 patients: 28 clusters involved S. aureus, 5 clusters involved E. faecium, and 1 cluster involved P. aeruginosa (Fig. 4A; Supplementary Table S3 online).

Fig. 4. Identification of suspect transmission events among patients. (A) 836 patient isolates were analyzed (dots color coded by species). Applying single-nucleotide variant (SNV) difference thresholds, we identified 34 interpatient isolate clusters representing potential transmission events (shaded groupings, exploded view). Clinical review found support for 9 of these clusters (red shading). (B) Table of clinical characteristics associated with each isolate. Six of these patients shared a history of recent or current intravenous drug use. In addition, 1 patient was an emergency medical technician who may have had occupational contact with intravenous drug users. Two other patients had no prior history of injection-related drug use but had chronic medical conditions for which they were being followed by the same clinical service. Four additional patients had no history of intravenous drug use and no obvious clinical connection to the other cases. The dendrogram indicates the degree of genetic relation among isolates. (C) Room trace analysis of a cluster of 6 patients with healthcare-acquired infection or colonization with highly genetically related MRSA isolates with no apparent clinical relationship and without colocalization on any clinical unit. Open circles indicate time of isolate collection.
Hospital infectious disease control personnel performed a clinical chart review of the 34 genetically identified clusters to assess clinical impact and support for potential transmissions within the hospital. Overall, 9 clusters had obvious clinical associations that were identified through retrospective investigation, while 25 did not (Supplementary Table S3 online). Of these clusters, the hospital infectious disease control personnel, as part of standard care practice, had identified patients in cluster 26 as belonging to a potential transmission group. No other clusters were suspected by infectious disease control personnel over the study period.
On average, clusters comprised 2.9 patients. Notably, the largest genetic cluster, cluster 2, included 21 MRSA isolates from 13 patients who all had community-onset MRSA infections (Fig. 4B; Supplementary Fig. S2 online). Of these patients, 6 shared a history of recent or current intravenous drug use. In addition, 1 patient was an emergency medical technician who may have had occupational contact with intravenous drug users. Two other patients with no prior history of injection-related drug use had chronic medical conditions for which they were being followed by the same clinical service, and 4 additional patients had no history of intravenous drug use and no obvious clinical connection to the other cases.
A second genetically identified cluster, cluster 14, involved 6 patients who had 7 MRSA isolates collected over a 192-day span, and this cluster lacked any obvious clinical support (Fig. 4C; Supplementary Fig. S3 online). The 7 isolates were highly genetically related, with a maximum of 12 SNV differences. Although all of the patients had apparent hospital-acquired MRSA, our retrospective chart review did not identify any obvious clinical relationship(s) among the patients. The cluster was not detected by the hospital’s routine infection control surveillance because all of the patients had cultures obtained on different dates and were associated with different inpatient units.
Discussion
Significant time demands are placed on infection control personnel for general surveillance, staff education, and mandatory reporting of select infections, including central-line–associated bloodstream infections, catheter associated urinary tract infections, and surgical site infections.Reference Storr, Twyman and Zingg 21 , Reference Carrico 22 Infection control departments are expected to monitor, investigate, and control potential outbreaks; however, traditional approaches have significant limitations. If there is no obvious geotemporal relatedness, it can be difficult to identify patients with cross transmissions. Moreover, chance geotemporal clustering of patients with phenotypically similar but genetically unrelated bacterial strains can lead to infection control personnel instituting unnecessary control measures for pseudo-outbreaks (ie, false alarms). Thus, there are benefits to excluding or validating potential cross-transmission events based on high-resolution genomic data.
An initial finding of this study is the relatively marked differences in the pairwise variant distribution of the 4 bacterial species. As demonstrated in the SNV difference distance histograms (Fig. 3), the 2 gram-positive pathogens showed notably fewer genetic differences overall and appeared to have some clustering that suggests differing circulating clades within the hospital’s patient population. Pseudomonas aeruginosa also showed evidence of genetic distance clustering, albeit with far greater genetic diversity. For K. pneumoniae, most isolates appeared to have a Gaussian distribution of genetic distances. These species-specific differences were likely related to differences in the biology and ecologic niches of the 4 species.Reference Fitzgerald and Musser 23 – Reference Shapiro and Polz 27
A second finding was that most strains within this institution appeared to be unique, likely representing endogenous flora of individual patients acquired outside the institution as opposed to cross transmissions—an observation in agreement with similar studies analyzing isolates of S. aureus, E. faecium, and K. pneumoniae from single institutions or cities.Reference Gorrie, Mirceta and Wick 16 , Reference Long, Beres, Olsen and Musser 28 , Reference Raven, Gouliouris and Brodrick 29 Thus, in most instances, the finding of a phenotypically similar bacterial strain in 2 or more patients, on a given hospital unit, in a given time period, likely does not represent an actual cross transmission. The ability to disambiguate this rapidly can reduce or eliminate personnel time and resources devoted to the management of pseudo-outbreaks—and could eventually impact penalties that hospitals may acquire for infections inaccurately characterized as hospital acquired.
Importantly, we also identified a subset of clinical isolates that showed a relatively high degree of genetic relatedness, with 0–50 SNV differences between pairs or clusters of isolates; these may represent isolates involved in cross-transmission events in either the hospital or the community. In our WGS analysis of 1,257 isolates from 823 patients, we identified 34 clusters involving 96 patients that carried highly genetically related bacterial isolates. Only 1 transmission cluster had been suspected by traditional infection control surveillance methods over the course of the study. Through retrospective clinical review, we were able to identify likely routes of cross transmission in 9 of the clusters, with cross transmission appearing to have occurred in both the inpatient and outpatient settings. Significantly, we noted apparent ongoing cross transmission of 1 MRSA isolate (cluster 14) over a >6-month period in the healthcare setting, in which the persistent lack of typical geotemporal clustering prevented recognition by standard infection control surveillance. Thus, a third major finding of this study is that routine genomic sequencing can identify and inform infection control personnel of patient transmission events, allowing appropriate follow-up and investigation for better outbreak control.
Although the determination of thresholds used to define apparent clusters was not arbitrary, as shown in the pairwise SNV histograms (Fig. 3) and the ROC curve analyses (Supplementary Fig. S1 online), the application of threshold values requires ongoing assessment. This need is highlighted by an apparent cluster involving 2 patients in which we identified very strong clinical support for cross transmission of E. faecium. The isolate from 1 patient was vancomycin susceptible and the isolate from the other patient was vancomycin resistant, and the SNV difference between the patient isolates was 11 SNVs (compared to the defined threshold was 10 SNVs) (Supplementary Fig. S4 online). Further refinement of analytic analyses and the expansion of the genomic datasets should allow improved characterization of SNV thresholds for determining highly likely and likely cross-transmission clusters.
The study undertaken in this report has several limitations. First, this study was performed in a single academic medical center and was influenced by the characteristics of the patient population and the institution’s infection control program. Second, only a subset of all the inpatient and emergency department isolates of the 4 pathogens underwent genomic sequencing and analysis; thus, some clusters were likely missed. Third, the predominant use of clinical isolates and the inclusion of surveillance isolates on only select units may have led to some selection bias. Fourth, most intrapatient isolates were obtained during a relatively restricted time period, limiting our ability to define genetic variation over time and the determination of thresholds to define potential clusters. Fifth, although the PIE system is intended to operate in near real time to make recommendations on infections that might be related and merit investigation, the manual clinical validation of clusters determined by PIE was undertaken retrospectively, at least several months after the cross transmissions might have occurred, which limited our ability to perform more granular clinical investigations. Sixth, this initial trial did not incorporate environmental isolates that may have helped further elucidate potential reservoirs and associated routes of transmission.
This work supports the integration of genomic and clinical epidemiologic data analyses to augment surveillance of nosocomial infections. This initial trial was not designed to be performed in real time but, with present technology, the potential turnaround time for WGS analysis of a cultivated isolate could be <48 hours. Thus, our cloud-computing approach has potential to inform infection control practice proactively. Using the PIE cloud-computing environment, we were able to analyze and generate potential relatedness matches for the entire dataset in ~3 hours, which is consistent with another estimate by Chen et al,Reference Chen, Xu and Fortunato-Habib 30 who also used the platform. Thus, we were able to achieve a time scale that is relevant for more rapid clinical investigation and intervention to identify and limit outbreaks, which contributes to improving overall patient outcomes.
Rapid, genomically informed surveillance efforts also have the potential to mitigate healthcare costs. According to published estimates, adult patients infected with multidrug-resistant bacteria present added costs ranging from $6,000 to $30,000.Reference Cosgrove 31 In a K. pneumoniae outbreak involving neonates, costs averaged $42,700 per infant.Reference Stone, Gupta and Loughrey 32 These costs represent a significant economic burden that is avoidable with proper tools and newer surveillance strategies.
Within a broader context, as rapid WGS analysis will allow for genotypic antimicrobial susceptibility analyses in addition to assessment for genetic relatedness, we anticipate that methodologies such as ours will also facilitate better antimicrobial stewardship programs (ASPs)Reference Barlam, Cosgrove and Abbo 33 , Reference Ostrowsky, Banerjee and Bonomo 34 within healthcare. These are critical points to highlight because current ASP initiatives must be aimed at improving the tracking of infections, their nuanced analysis, and the reporting of antibiotic use coupled with monitoring of resistance patterns. This study has demonstrated approaches that, if implemented with near real-time surveillance capability, may hold promise to reduce infection rates and care costs in hospitals.
Author ORCIDs
Doyle V. Ward, 0000-0002-4952-824X
Supplementary material
To view supplementary material for this article, please visit https://doi.org/10.1017/ice.2019.75.
Acknowledgments
The authors thank Gail E. Cormier, MPA, RN, CIC, Rosemarie Erlichman, RN, BSN, CIC, Gail Frigoletto, MS, RN, CIC, Zita S. Melvin RN, BSN, CIC, and Azalea Wedig, BS, CIC for their contributions to the retrospective manual chart review, and thank Desiree Bumanglag, BS, and Elizabeth Kasputis, M(ASCP), for picking and plating isolates.
Financial support
This work was supported by funds from Philips Healthcare.
Conflicts of interest
The following authors received sponsored project support from Philips Healthcare during the study: D.V.W., D.J.B., B.A.B., J.M., R.T.E. III. The following authors received sponsored project support from Philips Healthcare outside of the study: R.T.E. III. The following authors received salary from Philips healthcare during and outside of the study: S.A.S., R.Ka., J.A.H., B.E.W., J.L.A., M.M.F.-H., J.J.C., I.S.S., and B.D.G. The following authors received salary from Philips Research North America during and outside of the study: A.G.H., R.Ko., H.C.v.A., and J.L. The following authors have patents issued or pending: H.C.v.A., BDG. The following authors have vested or nonvested stock from Philips Healthcare: J.L., B.E.W., I.S.S., B.D.G. Authors receiving salary from Philips Healthcare and Philips Research North America were involved in the preparation, submission, and review of the manuscript.