


Introduction
Many studies have investigated species compositions in soils of extreme environments (Bontognali et al. Reference Bontognali, Vasconcelos and McKenzie2010, Reference Bontognali, Vasconcelos, Warthmann, Lundberg and McKenzie2012; Farías et al. Reference Farías, Contreras, Rasuk, Kurth, Flores, Poiré, Novoa and Visscher2014; Jay et al. Reference Jay, Rusch, Tringe, Bailey, Jennings and Inskeep2014); however, most of these have focused on the top layers or subsurface of soils from areas such as hypersaline sediments and Sabkhas (Kjeldsen et al. Reference Kjeldsen, Loy, Jakobsen, Thomsen, Wagner and Ingvorsen2007; Abdeljabbar et al. Reference Abdeljabbar, Cayol, Hania, Boudabous, Sadfi and Fardeau2013; Al-Najjar et al. Reference Al-Najjar, Ramette, Kühl, Hamza, Klatt and Polerecky2014), or saline/soda lakes (Sorokin et al. Reference Sorokin, Berben, Melton, Overmars, Vavourakis and Muyzer2014). In such environments, the biogeochemical cycle of nitrogen and sulphur is very important and shapes the microbial communities (Oren Reference Oren2008; Al-Thani et al. Reference Al-Thani, Al-Najjar, Al-Raei, Ferdelman, Thang, Al Shaikh, Al-Ansi and de Beer2014). Therefore, the abundance and the diversity of species from these sites correlate tightly with the availability of the terminal electron acceptors (oxygen, sulphate, nitrate, ferric ion) that act as source of energy. Recently, novel isolates have been recovered from extreme environments. For example, the extremely halophilic bacterium Limimonas halophila was isolated from the mud of hypersaline Lake Aran-Bidgol in Iran (Amoozegar et al. Reference Amoozegar, Makhdoumi-Kakhki, Ramezani, Nikou, Fazeli, Schumann and Ventosa2013), while Salinibacter iranicus and Salinibacter luteus were isolated from Aran-Bidgol salt lake in Iran (Makhdoumi-Kakhki et al. Reference Makhdoumi-Kakhki, Amoozegar and Ventosa2012). Moreover, volcanic environments (mud, groundwater, aquifers, soil and lakes in craters) have attracted a great deal of attention from many research groups worldwide owing to their microbial diversity and distribution of indigenous species (Herrera & Cockell Reference Herrera and Cockell2007). This is because the geochemistry of active volcanoes changes frequently, especially in lakes of craters (Mapelli et al. Reference Mapelli, Marasco, Rolli, Daffonchio, Donachie, Borin, Rouwet, Christenson, Tassi and Vandemeulebrouck2015) and their related streams and springs. The typical conditions in these surrounding areas are extreme as they have high temperatures, high concentrations of dissolved metals/minerals and developing patterns of biominerals (Glamoclija et al. Reference Glamoclija, Garrel, Berthon and L´opez-Garc´ıa2004), low pH (Löhr et al. Reference Löhr, Laverman, Braster, van Straalen and Röling2006). Therefore, screening for new novel species from these volcanic sites has resulted in development of new methods for DNA extraction and isolation (Herrera & Cockell Reference Herrera and Cockell2007). For example, Cupriavidus pinatubonensis and Cupriavidus laharis are novel isolates from volcanic mudflow deposits from Mt. Pinatubo, Philippines (Sato et al. Reference Sato, Nishihara, Yoshida, Watanabe, Rondal, Concepcion and Ohta2006). Methanococcoides and Methanosarcina were isolated and detected in the subsurface of mud volcanoes (Wang et al. Reference Wang, Chiu, Cheng, Chang, Tu and Lin2014). Fluid samples collected from the volcano mud field of Salse di Nirano, Northern Apennines, Italy contained species typical of other saline sediments as well as the sulphate reducers, Clostridium thiosulfatireducens and Desulfovibrio psychrotolerans, which were involved in cycling of sulphur compounds (Kokoschka et al. Reference Kokoschka, Dreier, Romoth, Taviani, Schäfer, Reitner and Hoppert2015).
Identifying species in samples collected from volcanic sites is challenging because they include members of the domains Archaea, Bacteria and Eucarya (Mapelli et al. Reference Mapelli, Marasco, Rolli, Daffonchio, Donachie, Borin, Rouwet, Christenson, Tassi and Vandemeulebrouck2015). Archaea are present in most volcanic environments, including those with very low pH (Löhr et al. Reference Löhr, Laverman, Braster, van Straalen and Röling2006). A study of four recent volcanic deposits of different ages (Gomez-Alvarez et al. Reference Gomez-Alvarez, King and Nüsslein2007) showed that Acidobacteria, Alphaproteobacteria, Gammaproteobacteria, Actinobacteria and Cyanobacteria predominated, but the majority of the species were unclassified phylotypes. That study concluded that microorganisms could survive and establish diverse communities in recent volcanic deposits, and the generated consortium shaped their profile according to local deposit parameters. Similarly, many studies have investigated the Atacama Desert (Desierto de Atacama) located as a plateau in South America along the Pacific coast to the west of the Andes mountains. It is the driest, non-polar and oldest desert on Earth (Farías et al. Reference Farías, Contreras, Rasuk, Kurth, Flores, Poiré, Novoa and Visscher2014; Rasuk et al. Reference Rasuk, Kurth, Flores, Contreras, Novoa, Poire and Farias2014, Reference Rasuk, Fernández, Kurth, Contreras, Novoa, Poire and Farías2016). Recent findings (Rasuk et al. Reference Rasuk, Fernández, Kurth, Contreras, Novoa, Poire and Farías2016) have indicated that a large proportion of 16S sequences could not be classified at the phylum level, which may indicate a new phylum is present in this Desert.
The present study was conducted on Wahbah Crater, Saudi Arabia, which is closer in its structure and its morphology to desert crusts (Chennu et al. Reference Chennu, Grinham, Polerecky, de Beer and Al-Najjar2015). The Crater experiences rare rainfall, high evaporation rates, long exposure time to Sun radiation as well as high temperature and it is surrounded by desert from all direction (Table S1). We aim to investigate the abundance and the diversity of microorganisms in soil samples collected at different soil depths in the Crater. Additionally, study the chemical composition of this remote and archaeological site, which is characterized by extreme environment, is a try to link the microbial community structure with its chemical composition. We focused on revealing the bacterial and archaeal communities that might be considered extreme species, which might provide insight into historical eras and subsequently might help to draw some outlines about life and aspects of astrobiology.
Materials & methods
Site description
Al Wahbah Crater is the deepest and largest crater in Saudi Arabia, being 250 m deep and 2000 m wide. The crater is located in western Saudi Arabia as a part of the Harrat extinct volcanic chain (22°54′5.0004′′N and 41°8′22.9992′′E). Al Wahbah Mountain is 1105 m above sea level. Very few geological studies on Al Wahbah crater have been conducted (Grainger Reference Grainger1996; Moufti et al. Reference Moufti, Németh, El-Masry and Qaddah2013; AbdelWahab et al. Reference Abdelwahab, Stuart, AbulMaaty, Awad and Kafafy2014); however, all of them agreed that the crater was formed by explosive eruptions or volcanic explosions as a result of the interaction between magma and groundwater. Continuous volcanic eruptions resulted in phreatic activities that led to deposition of rocks, lava and debris around the crater and created multiple lava flows, the tuff ring, tephra ring, basement, dolerite plug, scoria cones and wall. Although this unique geotope resulted in different geological components in terms of time and age, the age of the crater is still not known. However, as per the calculation of age using the yield 40Ar/39Ar, dolerite plug of 1.147 ± 0.004 Ma, lower basalt flows, 1.261 ± 0.021 Ma and upper basalt flows 1.178 ± 0.007 Ma (AbdelWahab et al. Reference Abdelwahab, Stuart, AbulMaaty, Awad and Kafafy2014). But age of 1.147 ± 0.004 Ma is the best estimation time of Al Wahbah crater formed. The present study focused on the flat floored crater that hosts an ephemeral lake (Grainger Reference Grainger1996; Moufti et al. Reference Moufti, Németh, El-Masry and Qaddah2013; AbdelWahab et al. Reference Abdelwahab, Stuart, AbulMaaty, Awad and Kafafy2014). This location is occasionally exposed to heavy rainfall (32 mm max. and 0.2 mm on average; Table S1) and subject to intense sunlight (incident irradiance of PAR was more than 1800 µmol photon m−2 s−1) and temperature varies between 20 and 35°C (in daytime) and 5–15°C (in night time) around the year. In addition, the nature of the flat floor allows prompt desertion to any rainfall, resulting in existence of shallow saline water producing salt pans and aeolian silt bars (Moufti et al. Reference Moufti, Németh, El-Masry and Qaddah2013) that mimic extreme environments. Finally, this geotope is considered an ecosystem with a rich palaeo-environmental record that offer its sediments, especially the flat floor, as a potential source to provide a record to serve different sciences and fields. Moreover, flat floor can provide a potential source to disclose the life for the last one million years, where precipitation and evaporation are the most effective factors here.
Sample collection
A pit of approximately 100 cm deep with a diameter of 40 cm was dug using a flat plastic spade in the centre of the Al Wahbah Crater and samples were collected from the following depths: I = 2 cm, II = 20 cm, III = 40 cm, IV = 60 cm, V = 80 cm and VI = 100 cm. The core sediments were solid enough to allow gentle handling. Heavy duty plastic bags were used to store and transfer the samples from the field to the laboratory. Each sediment sample was divided into two aliquots, one for geoanalysis parameters and kept at the room temperature while the other for DNA extraction kept in −80°C freezer.
Measurements of geoanalysis parameters
Soil samples were dried thoroughly, then sieved through a 2 mm sieve. Next, 0.50 g sieved soil was digested in a mixture of 5 ml of HNO3, 2 ml of HF and 2 ml of HCl. Trace elements (Na, Mg, K, Ca, Cr, Mn, Fe, Co, Ni, Cu, Zn, As, Se, Sr, Mo, Cd, Ba, Pb, Ti, U) were measured by Inductively Coupled Plasma Mass Spectrometry (ICP-MS), whereas a recovery of 98–100% was achieved using certified reference soil of Internal Atomic Energy Agency soil IAEA-SOIL-7. Sulphate, sulphite, nitrate, nitrite, ammonium and ferric were determined with a DR-3900 spectrophotometer (HACH, Loveland, CO 80 539, USA). Physicochemical parameters (pH, TDS) were measured using an Ultrameter II (Myron L® Company, Carlsbad, CA, USA).
DNA extraction, PCR amplification and pyrosequencing
An amount of 0.25 g of each sediment sample was taken for bacterial identification and analysis. Genomic DNA was extracted using a PowerSoil DNA Isolation Kit (MO BIO Laboratories Inc., Solana Beach, CA, USA) according to the manufacturer procedure. The concentration of the extracted DNA was quantified using Nanodrop 1000 spectrophotometer (Thermo Fisher Scientific, Wilmington, DE, USA). PCR, purification and sequencing of DNA were then carried out in Mr DNA Lab (Molecular Research LP, Shallowater, TX, USA). Polymerase chain reaction (PCR) amplicon sequencing for 454 pyrosequencing was performed using (bTEFAP®) according to Dowd et al. (Reference Dowd, Callaway, Wolcott, Sun, McKeehan, Hagevoort and Edrington2008a, Reference Dowd, Sun, Wolcott, Domingo and Carrollb). Technology of 454 pyrosequencing, which is performed using a Roche 454 FLX titanium instrument, is a high throughput DNA sequencing method that uses a single strand of DNA with a length of 400–500 bp. All DNA samples were adjusted to 100 ng µl−1 and 100 ng (1 µl) aliquots of each sample were used for a 50-μl PCR reaction. Forward and reverse 16S universal eubacterial primers 515F (GTGCCAGCMGCCGCGGTAA) and 806R (GGACTACHVGGGTWTCTAAT) for bacteria were used for a single-step 30 cycle PCR. The PCR amplification was accomplished using a HotStar Tag plus Master Mix Kit (Qiagen, Valencia, CA, USA) under the following condition: 94°C for 30 min, followed by 28 cycles of 94°C for 30 s, 53°C for 40 s and 72°C for 1 min and then final elongation step at 72°C for 5 min was performed. All amplicon products from different samples were mixed in equal concentrations and purified using Agencourt Ampure beads (Agencourt Bioscience Corporation, Beverly, MA, USA), then subjected to PCR.
Microbial analysis
The sequence data were processed using a proprietary analysis pipeline owned by Molecular Research Lab (http://www.mrdnalab.com, MR DNA, Shallowater, TX, USA). Briefly, the following sequences were removed; sequenced are encoded with barcodes and primers that shorter than 200 bp, sequences with ambiguous base calls and sequences with homopolymer runs exceeding 6 bp. Finally, chimeras were removed after denoizing sequences. After removal of singleton sequences, operational taxonomic units (OTUs) were defined and clustered at 3% divergence. Taxonomic classification of OTUs obtained was conducted by BLASTn searches against a curated Greengenes/RDP/NCBI-derived database (DeSantis et al. Reference DeSantis, Hugenholtz, Larsen, Rojas, Brodie, Keller, Huber, Dalevi, Hu and Andersen2006) and compiled into each taxonomic level. A compact package of different statistical analyses including XLstat, NCSS 2007, ‘R’ and NCSS 2010 was used. Alpha and beta diversity analysis was conducted (Swanson et al. Reference Swanson2011) using Qiime (http://www.qiime.org). A p < 0.05 was considered to indicate significance for all analyses. A dual hierarchal dendrogram constructed to provide a visual overview of a combined heatmap for predominant genera and connection lines as clusters with more similar consortium of genera based on matching similarity. The overall phylogenetic distance-based, Jackknife, on the OTU data showing the biodiversity of bacterial communities among each other using Fast UniFrac and principal coordinate analysis (PCoA) images were captured to illustrate differences in the microbiota. UniFrac PCoA analyses for the three principal coordinates (PCs) were unweighted UniFrac with PC1 = 46%, PC2 = 19% and PC3 = 13% (p = 0.001).
Results
Geoanalysis results
All six soil samples (different depths) were saline (~23 000–29 000 ppt; Table 1), which is very close from TDS value of the seawater (~33 000 ppm). The pH in the different depth layers is slightly alkaline (average pH = 8.69; Table 1). Generally, Al Wahbah soil contained higher concentrations of trace elements than those of the reference soil (IAEA 1984) especially Na, Sr and Cu, which were present at 19, 7 and 4%, respectively (Table 2). However, the concentration of elements such as Ca, Se and Pb were less in Al Wahbah soil than that of the reference soil.
Table 1. Physicochemical proprieties of Al Wahbah soil samples
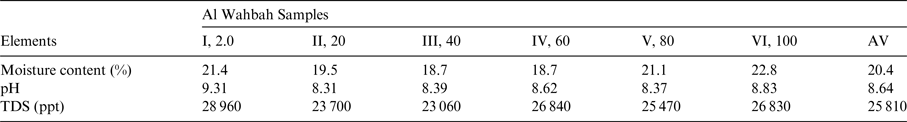
Table 2. Trace elements concentration of Al Wahbah soil samples relative to reference soil

In the upper 60 cm of Al Wahbah studied soil, sulphate and sulphite concentrations did not considerably vary (from 26.5 to 27.5 mM for sulphate and it was around 37 mM for sulphite; Fig. 1). The concentrations for both sulphate and sulphide decreased ~18 and 13%, respectively, which suggest consumption of sulphate through probably sulphate reducing bacteria. The concentration of other nutrients such as nitrate, nitrite, ammonium and iron containing nutrients were below detection limits. The concentration of sulphates and sulphites exceeded 25 mM and they showed similar depletion profiles.
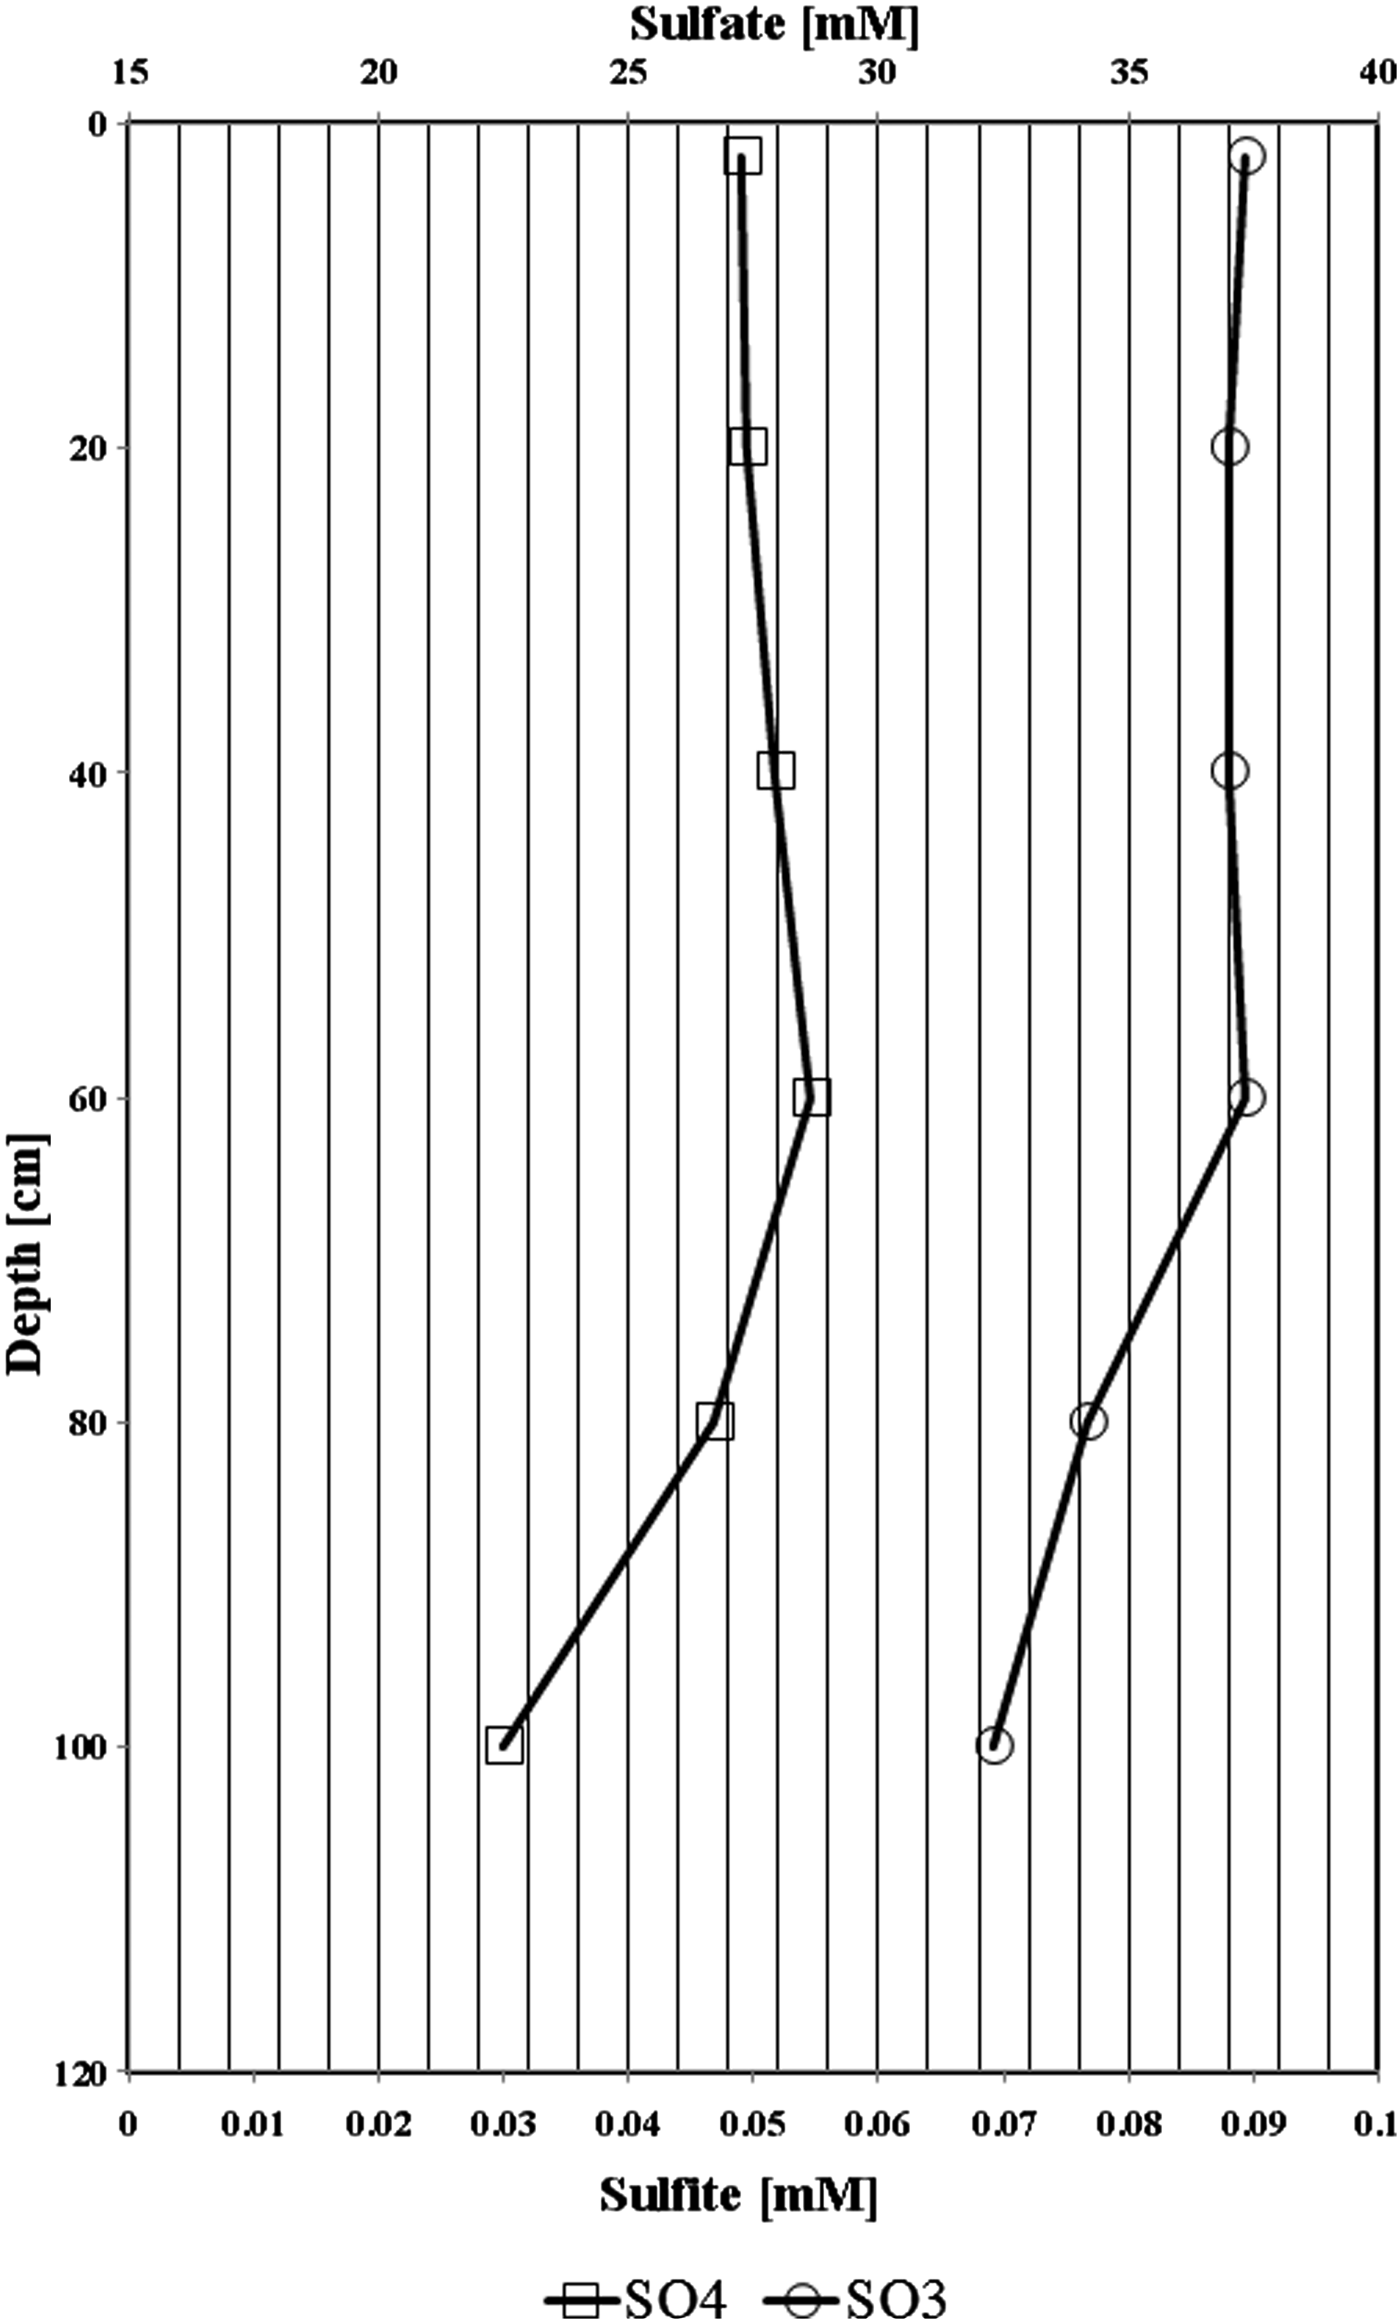
Fig. 1. Vertical depth profile of sulphate and sulphite behaviour in the collected samples of Al Wahbah soil.
Microbial community structure
After stringent quality sequence curation, 41 524 sequences were parsed and 33 081 were then clustered. A total of 33 063 sequences identified as bacteria or archaea were used for the final analyses. The average number of reads per sample was 2755. For alpha and beta diversity analysis, samples were rarefied to 1000 sequences and bootstrapped at 800 sequences. Table 3 summarizes the number of sequences and OTUs at 97% similarity, as well as the diversity indices for bacteria.
Table 3. Number of sequences and OTUs at 97% similarity diversity indices for bacteria
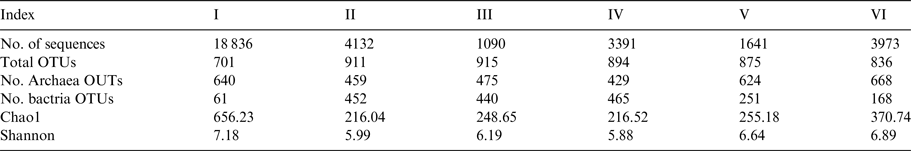
The Shannon–Wiener Index curve plot (Fig. 2) reached a plateau at just over 100 sequences, indicating that sequencing depth was sufficient to capture the full scope of microbial diversity and the rarefaction curve was sufficient to reflect the full coverage of bacterial and archaeal richness. The biodiversity was very high among samples, with that of sample I being highest (7.18) and sample IV (i.e., 60 cm) lowest (5.88). Interestingly, the deepest layer (i.e., 100 cm) showed the second highest biodiversity, based on Shanon–Wiener index, after the uppermost layer (Table 2). Additionally, the greatest microbial richness (bacteria and archaea) was observed in sample I (i.e., 2 cm).
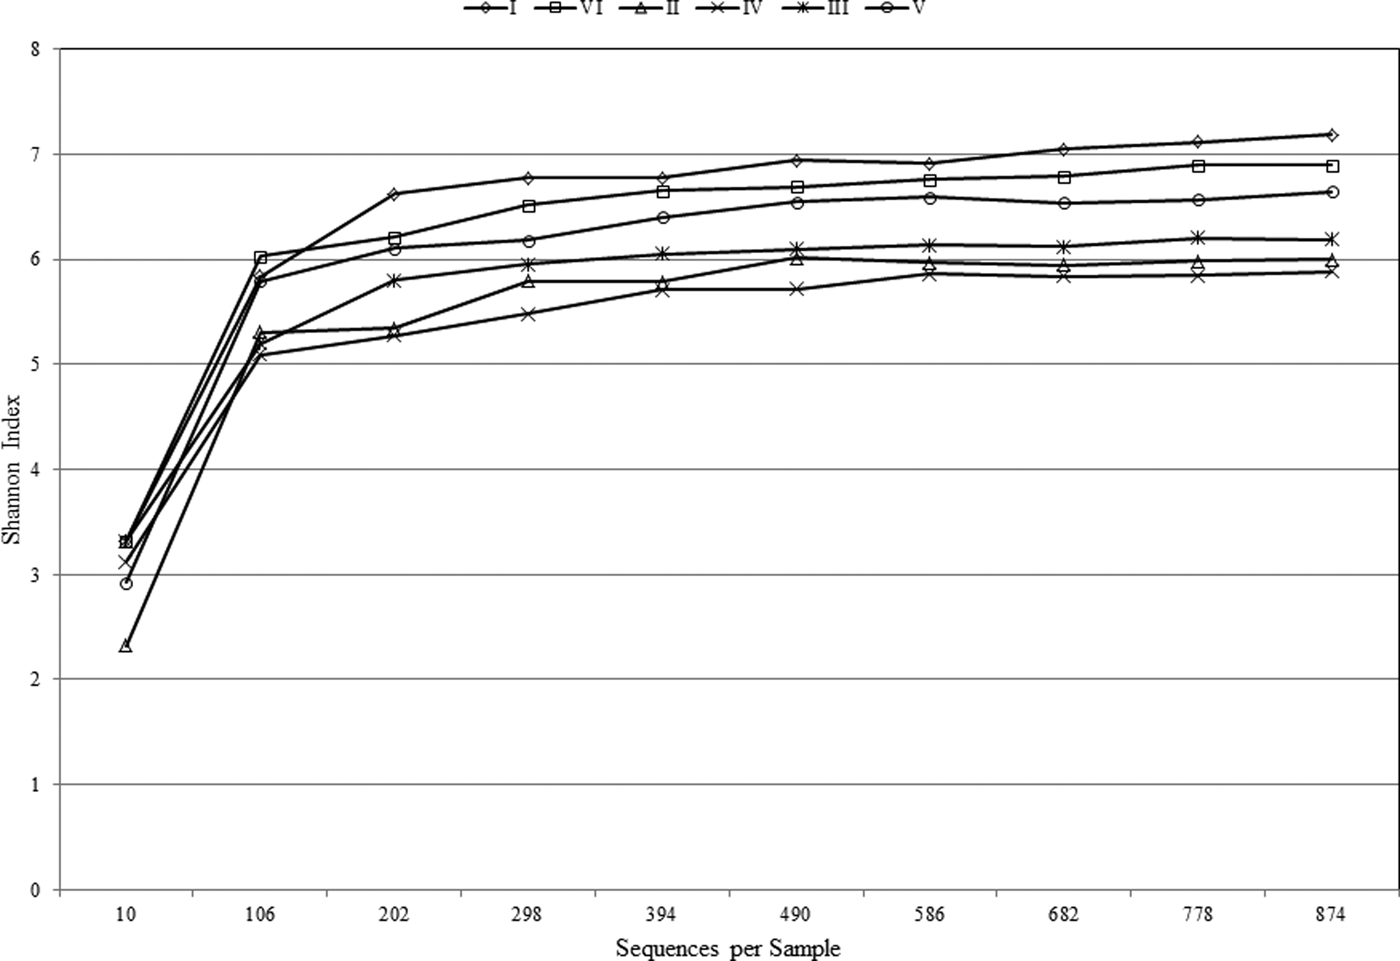
Fig. 2. Shannon–Wiener curve of the samples at different depths.
Archaea genera dominated the uppermost layer and the deepest two layers (at 2.0, 80.0 and 100.0 cm), while bacteria genera comprised ~50% of the microbial community in the middle section of the pit (20.0–60.0 cm), Fig. 3. The most predominant phylum identified from Al Wahbah Crater soil was Euryarchaeota, which comprised ~91% of the total microbial population for sample I (Fig. 4). As depth increased, the relative abundance of Euryarchaeota decreased to ~50% for samples II, III and IV. However, the abundance of Euryarchaeota increased again to ~70 and ~80% for samples V and VI, respectively (Fig. 4). Moreover, when considering genera accounting for >5% of the relative abundances, the archaeal halophilic genera Halorhabdus and Halorubrum showed the greatest abundance across samples, with average values of 30 and 14%, respectively. Conversely, Bacillus accounted for an average of 17% of the community in the middle section (Fig. 5).
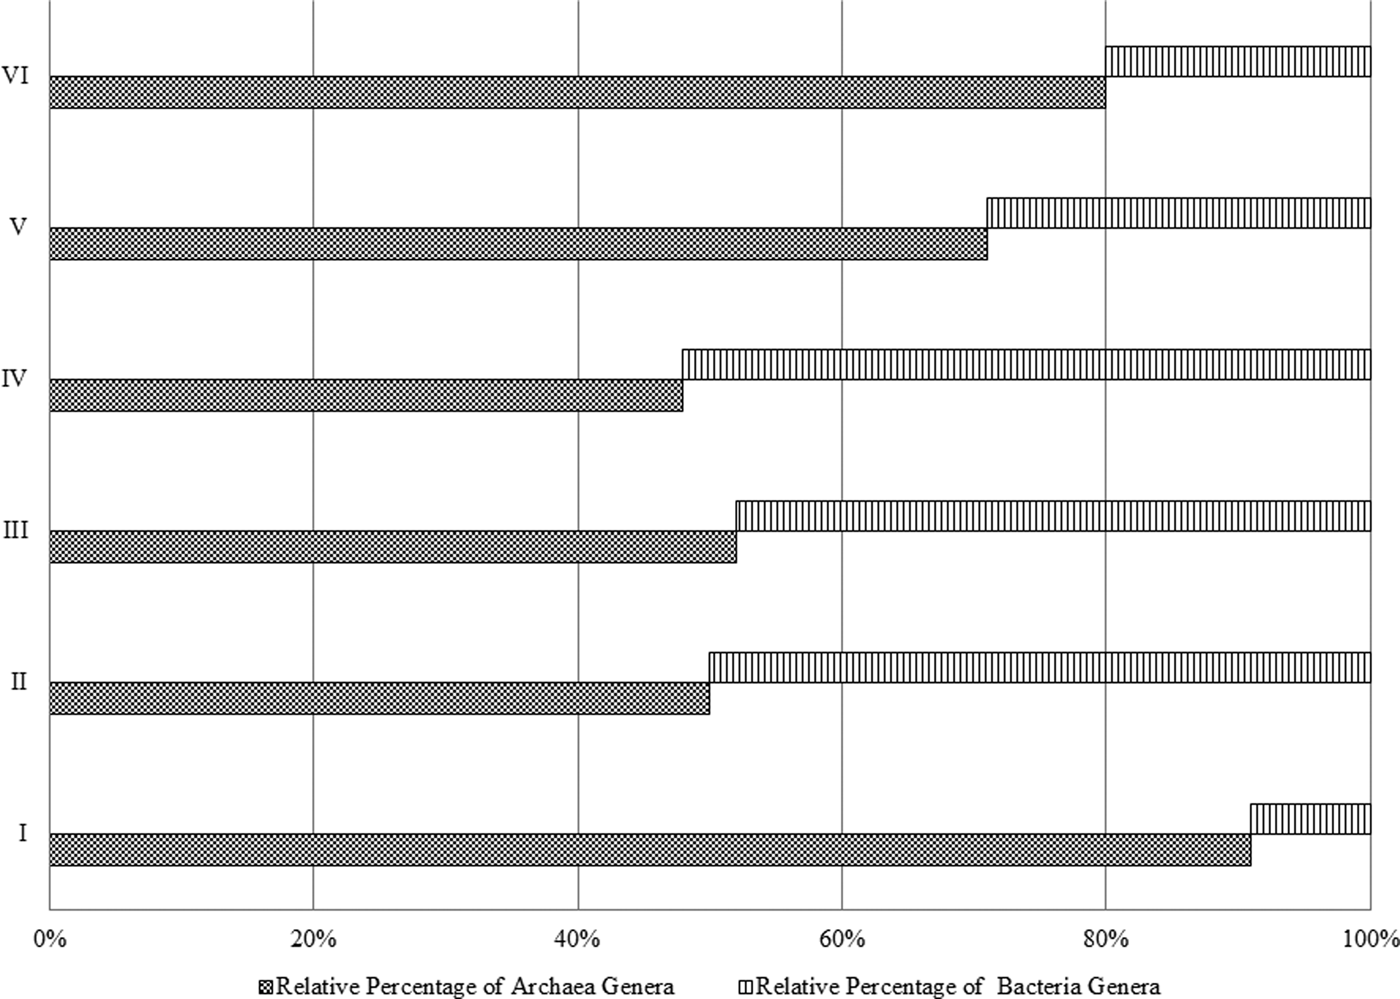
Fig. 3. Relative percentage of bacteria and archaea per sample.
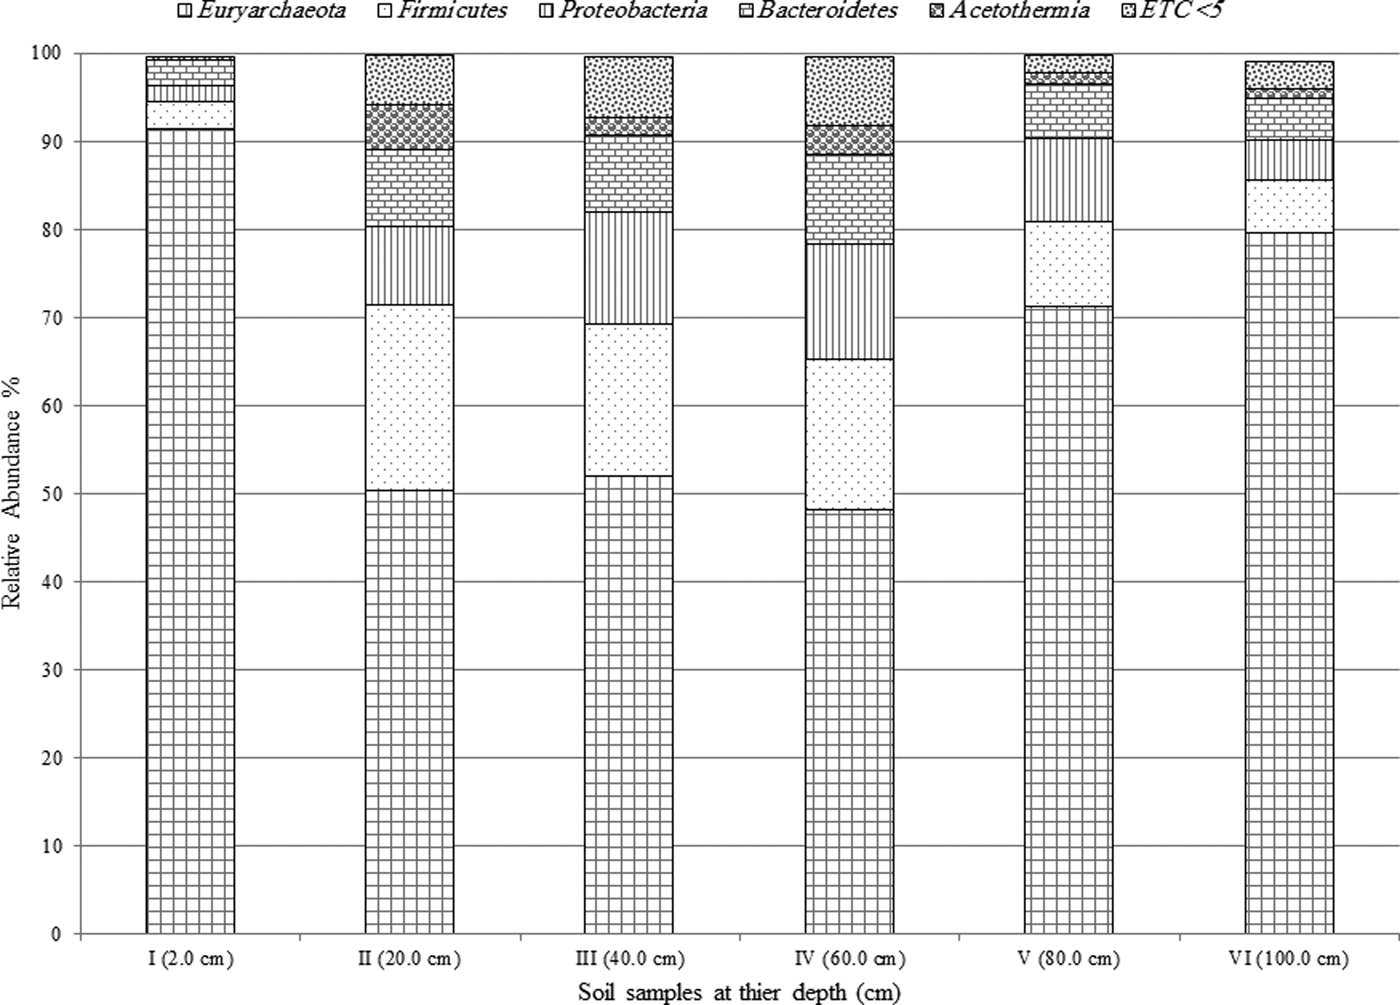
Fig. 4. Relative abundance of the predominant phyla >5% across samples.
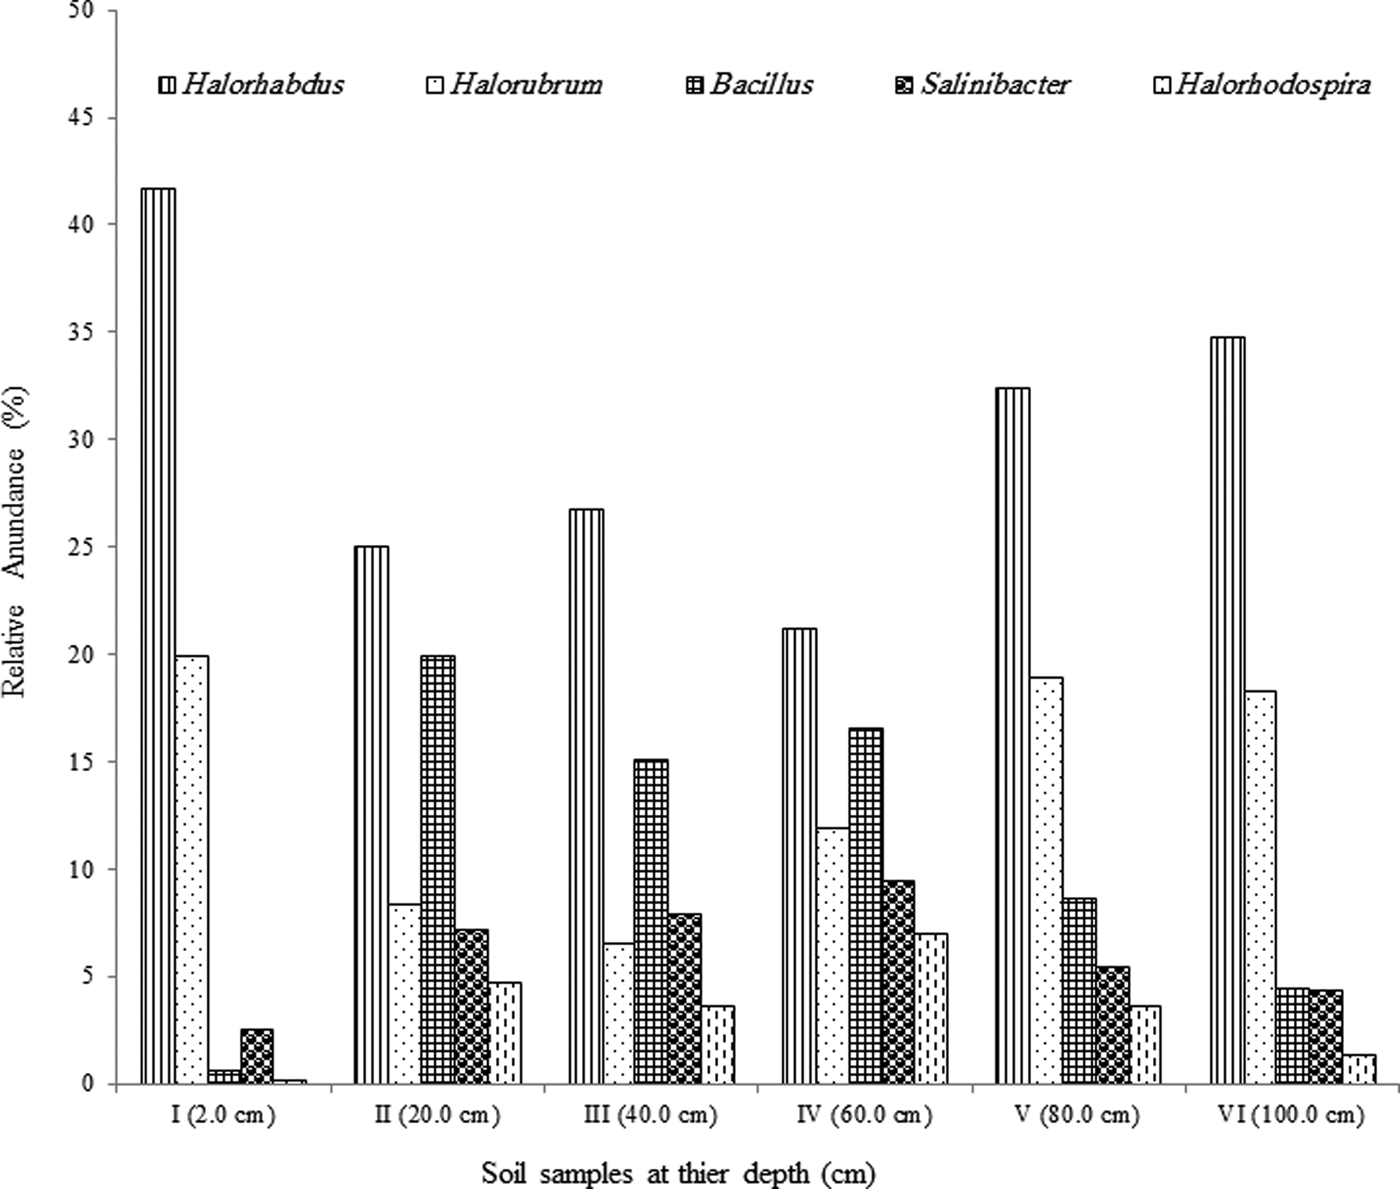
Fig. 5. Relative abundance of the predominant genera >5% across samples.
Figure 6 shows a dual hierarchal dendrogram constructed to provide a visual overview of a combined heatmap for predominant genera and connection lines as clusters with more similar consortium of genera based on matching similarity. Samples I, V and VI formed a cluster separate from that of samples II, III and IV, indicating a significant difference between the two clusters.
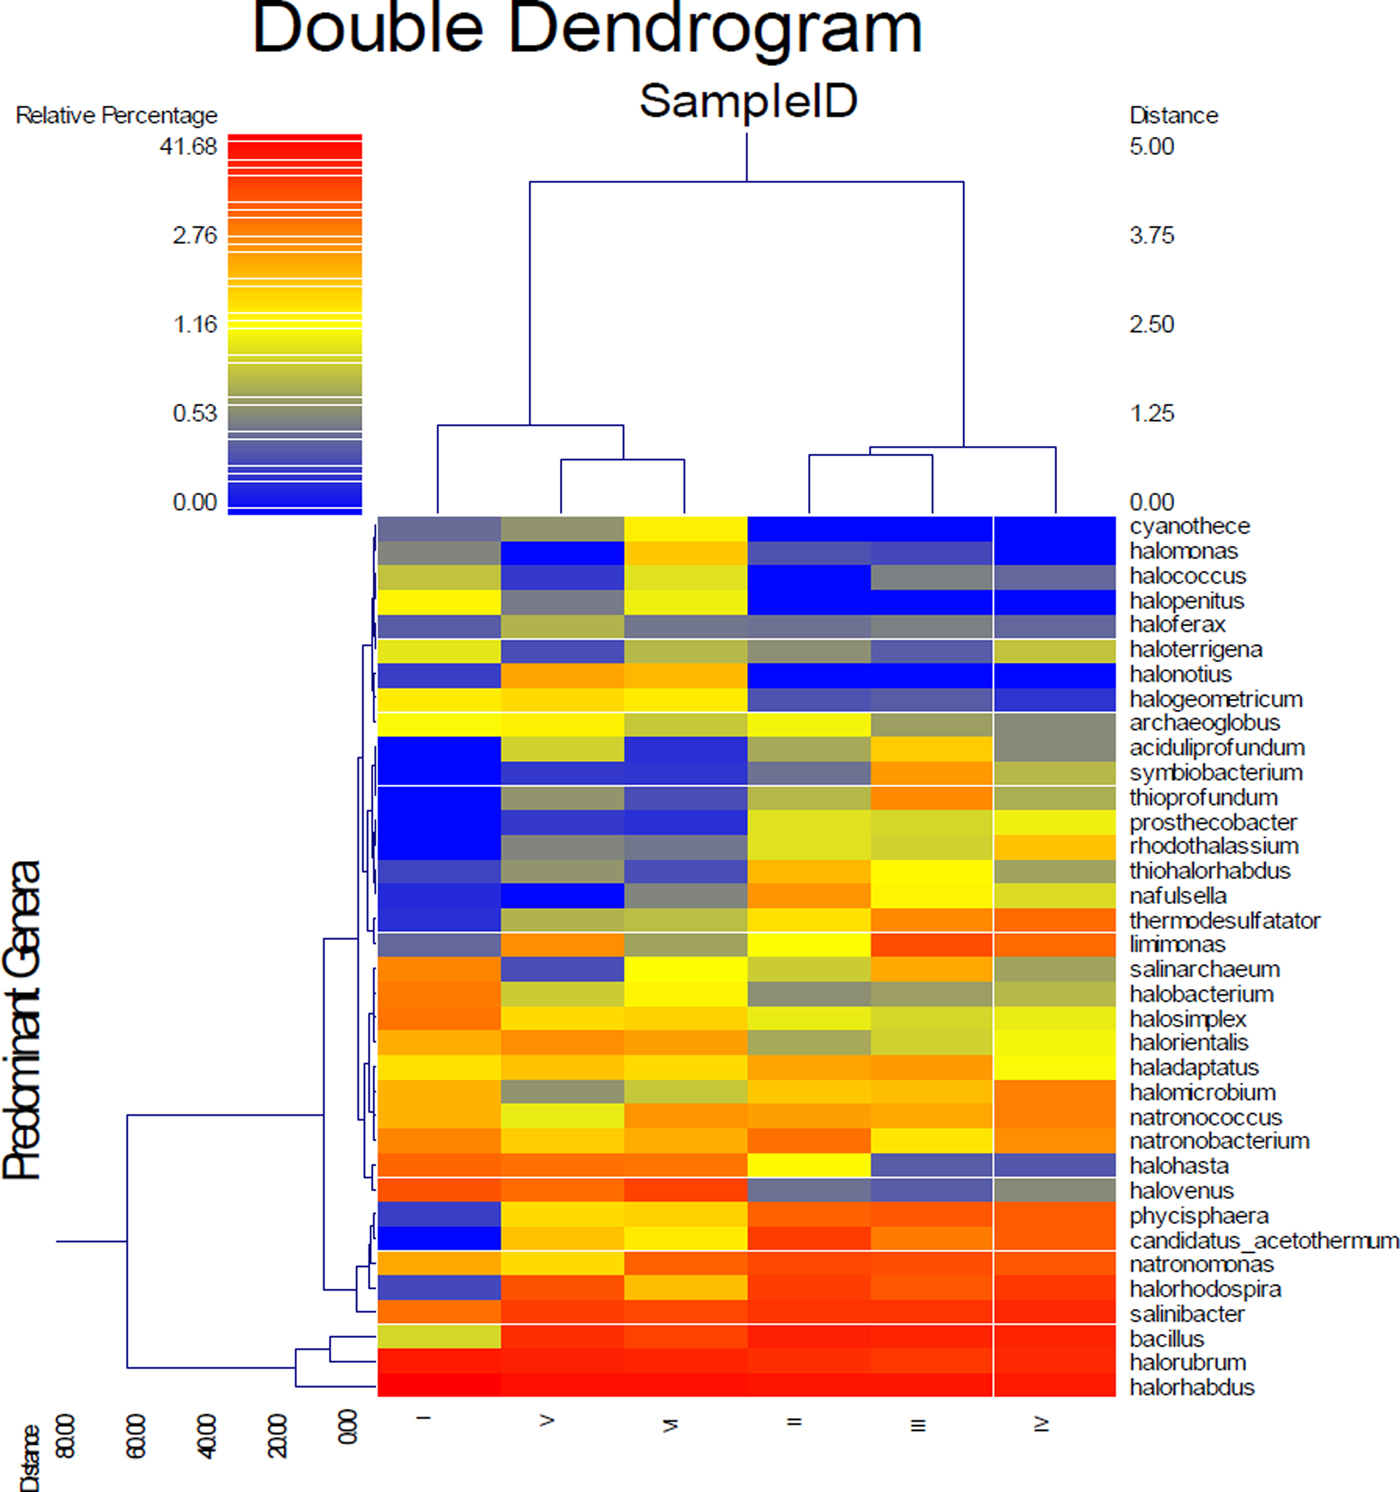
Fig. 6. Dual hierarchal dendrogram evaluation of the taxonomic classification data.
UniFrac significance tests (Table S2) were made based on comparisons with 1000 randomized trees and p values were only listed if they were >0.05. Hence, all other pairwise comparisons indicated a significant difference between samples.
Discussion
Extreme habitats comprise one of the few ecological systems that can benefit several other fields such as biotechnology and site remediation. Additionally, extreme habitats provide valuable historical information that help scientists to recover and to draw vital findings about past life and about the adaptations for survival. For example, the theory of life possibility on Mars might be supported by the presence of active microbial life in Earth's extreme habitats, which are similar to that on Mars. In this study, the bacterial and archaeal communities associated with soil in an ancient, inactive and remote crater in Saudi Arabia, Al Wahbah, were investigated in the upper 100 cm. The geochemical parameters and the physicochemical parameters were measured and were linked to the microbial community structure of the Al Wahbah Crater to evaluate vibrant performance. Rare rainfall on the studied site, together with high evaporation rate will evaporate the water shortly leaving dry surface. This will select against the microorganisms that cannot tolerate these conditions, which are most likely the ones introduced to the system by the rain and will keep those who can survive the extreme conditions.
The level of trace elements in the soil samples did not show any metal contamination or radioactivity, although extreme salinity was observed, with an average total dissolved salts of approximately 25 810 ppt. The absolute pH values (I = 9.3, II = 8.3, III = 8.4, IV = 8.6, V = 8.4, VI = 8.8) were slightly alkaline while the moisture content ranged from 18 to 23%. Electron donors and acceptors used usually by the microbial community, such as nitrate, nitrite, sulphate, ferric ions and manganese, were almost negligible at along the depth. Specifically, nitrate, nitrite, ammonium and ferric ions were present at less than 2, 0.05, 1.5 and 0.2 mg l−1, respectively, indicating poor conditions for most microorganisms. Sulphates and sulphites showed similar behaviour throughout the depth profile (Fig. 1), where the substances slowly depleted from approximately 27.2 and 0.090 mM down to 22.5 and 0.070 mM for sulphates and sulphites, respectively. This depletion of sulphate and sulphite coincided with increase in the relative abundance of members belonging to the family Thermodesulfobacteriaceae that are well known by their sulphate reduction activities. The relative abundances of this order increased gradually with the depth reaching to the highest at 60 cm (Fig. S1), where sulphate concentrations started to decrease steeply (Fig. 1). These conditions have resulted in formation of obvious stratification in the bacterial and archaeal communities (Löhr et al. Reference Löhr, Laverman, Braster, van Straalen and Röling2006; Al-Thani et al. Reference Al-Thani, Al-Najjar, Al-Raei, Ferdelman, Thang, Al Shaikh, Al-Ansi and de Beer2014; Mapelli et al. Reference Mapelli, Marasco, Rolli, Daffonchio, Donachie, Borin, Rouwet, Christenson, Tassi and Vandemeulebrouck2015). Although the changes in the measured sulphur species content were small, they may contribute to the proliferation of sulphates/sulphites reducers (Kokoschka et al. Reference Kokoschka, Dreier, Romoth, Taviani, Schäfer, Reitner and Hoppert2015). Higher relative abundances of archaeal OTUs were observed than bacterial OTUs throughout the depth profile, which suggests that the available conditions are more suitable for archaeal growth than those for bacteria. Additionally, there were higher Shannon and Chao1 values (Fig. 2 and Table 3) for sample I than the other samples suggesting much more biodiversity in that layer. Indeed, this increased biodiversity can be seen from the presence of different groups of microorganisms including sulphate reducers (Fig. S1) and photosynthetic cyanobacteria (Fig. S2). This microbial composition is very similar to that for hypersaline microbial mat ecosystems (Frank & Stolz Reference Frank and Stolz2009; Al-Najjar et al. Reference Al-Najjar, Ramette, Kühl, Hamza, Klatt and Polerecky2014). Typically, in a microbial mat, the upper most layer is characterized by having photosynthetic microorganisms such as cyanobacteria, which are efficient light utilizing microorganisms. They use light energy to reduce CO2 and subsequently produce organic material that acts, normally, as C and energy source for the subsequent layers in the mat. The deeper layers of a microbial mat, where O2 is depleted, are typically dominated by anaerobic microorganisms such as sulphate reducers, methane producers and other fermenting bacteria. The microbial community structure in Al Wahbah crater showed the presence of cyanobacteria in the upper most layer (Fig. S2); however, the presence of the cyanobacteria in the deeper layers suggests burial events. It is well documented that cyanobacteria in the deeper layers shift their metabolism to heterotrophy or to fermentation (Jørgensen et al. Reference Jørgensen, Cohen and Revsbech1988). The deep layers of Al Wahbah Crater were dominated by other groups of microorganisms (Figs. 3 and 4). Moreover, heatmap analysis and RDP classifiers revealed that five diverse genera were commonly present among samples, Halorhabdus, Halorubrum, Bacillus, Salinibacter and Halorhodospira (Fig. 6). Among these, Halorhabdus was dominant and consistent, followed by Halorubrum and Bacillus, which comprised 19% of the population (at upper and lower depth) and 17% (at the middle section), respectively. The variability of this diversity and distribution among the halophilic genera (Fig. 6) are controlled by adaptation to the saline ecosystem (Wainø et al. Reference Wainø, Tindall and Ingvorsen2000; Antunes et al. Reference Antunes, Taborda, Huber, Moissl, Nobre and da Costa2008). H. tiamatea, which was isolated from the hypersaline anoxic basin of the Red Sea, might have a common origin with the organisms identified in this study as the Red Sea is about a 100 km to the west from Al Wahbah crater. H. tibetense, which is known as an aloalkaliphilic organism, accounted for 19% of the archaeal community in all samples (Fan et al. Reference Fan, Xue, Ma, Ventosa and Grant2004), while several other Halorubrum species were detected at very low levels (≤2.0%) by 454 pyrosequencing. Similarly, Bacillus and Salinibacter comprised an average of 27 and 20%, respectively, of the bacterial community. However, B. cellulosilyticus and S. iranicus were the major identified species among Bacillus and Salinibacter, respectively and they are known for extremely halophilic (Makhdoumi-Kakhki et al. Reference Makhdoumi-Kakhki, Amoozegar and Ventosa2012).
Another pattern of diversity was constructed among phyla to measure the consistency among the six soil samples. The defined archaeal phylum was identified as Euryarchaeota, which probably reflected the marked functional diversity (Suh et al. Reference Suh, Park, Hwang, Kil, Jung and Lee2015) of halophiles. Three other observed phyla, Firmicutes, Proteobacteria and Bacteroidetes, showed the same pattern and consistency throughout sequencing data, with Firmicutes showing slightly more abundance (~4%) (composed mostly of Bacillus as soil consortium) than the other two. Overall, 13% of the phyla consisted of Proteobacteria (8%) and Bacteroidetes (7%). Moreover, the Unifrac PCoA image and UniFrac distance-based Jackknife clustering (Fig. 7) of the whole community (bacterial and archaeal) associated with the six soil samples revealed three clusters, sample I alone, samples II, III and IV, and samples V and VI.
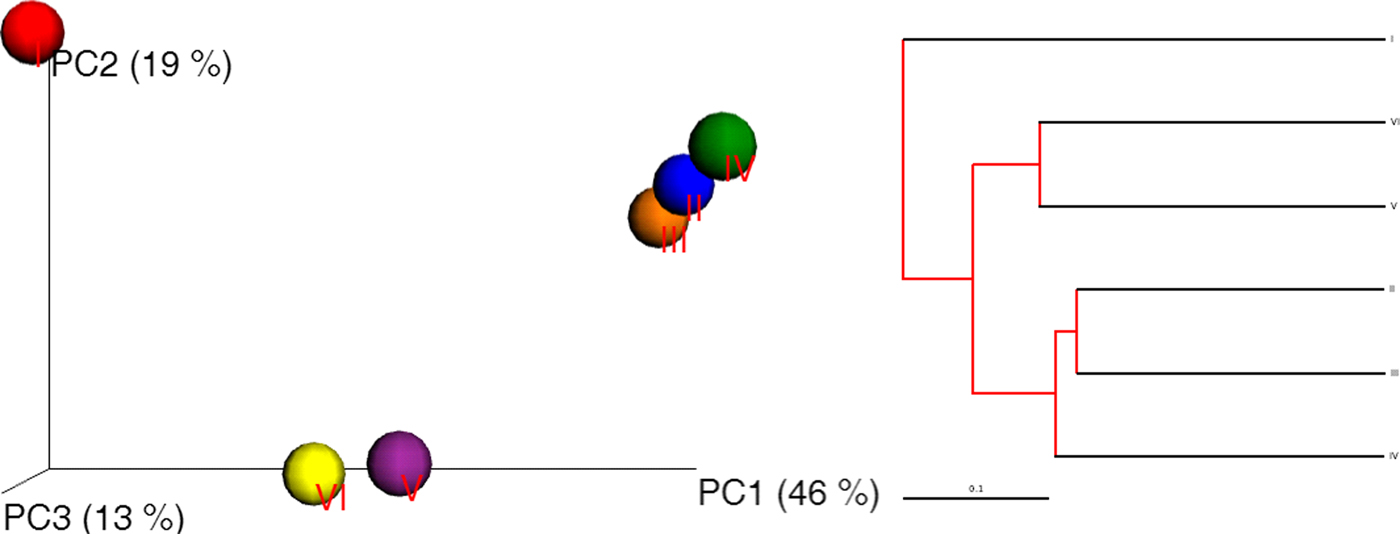
Fig. 7. Unifrac PCoA image (left) and UniFrac distance-based Jackknife clustering (right) showing differences among the six soil samples based on the OTU data.
This comparison of the whole microbial community structure for 16S rRNA gene sequences clearly differentiates the bacterial communities among the six soils. Taken together, the geo-analysis parameters and 454 pyrosequencing data analysis indicate that Al Wahbah has been undisturbed, the communities present are similar to those in microbial mats and the crater reflects the historical formation of the site. However, this should be confirmed by advanced dating techniques such as 14C analysis that may determine the age of the soil samples and reflect, especially at the lower layer (60.0–100.0 cm) or deeper, the nature of extreme microbial communities.
Conclusion
Overall, the microbial diversity and structure observed for the six samples in the Al Wahbah Crater site clearly responded to the soil constituents and surrounding environmental conditions. Soil texture, salinity and nutrient levels were found to be the main geochemical parameters influencing variations in the microbial community. Additionally, Euryarchaeota was the major phyla and Halorhabdus was the dominant genus. This study with the geoanalysis has provided close insights of what the flat floored of Al Wahbah Crater site made of to facilitate the survival of microbial community, which turned to be halophiles. The community observed at 100.0 cm likely reflects the profile of biological activity for a historical era and the isolates can be considered extreme species.
Supplementary material
The supplementary material for this article can be found at https://doi.org/10.1017/S1473550417000295.
Acknowledgements
This work was financed by King Abdulaziz City for Science and Technology (KACST) under grant No. 33– 874 and 33– 875.


 Open access