


1. Introduction
Coffee is one of the most popular drinks and valuable agricultural commodities traded in the world. Coffee provides a livelihood for almost 125 million people around the world, generating cash returns in subsistence economies and providing employment to both men and women living in rural areas (Fairtrade Foundation, 2012). From 1962 to 1989, the coffee market was regulated by the International Coffee Agreement (ICA). The ICA was a collection of agreements that set the production quotas and governed the quality standards for most coffee-producing countries. After the disintegration of the ICA and the liberalization of the coffee market, global coffee production increased leading to a decline in producer prices and quality of coffees (Ponte, Reference Ponte2002). As a reaction to the decline in coffee quality, specialty coffee was born. Specialty coffee is defined as coffee grown in special and ideal climates, with distinctive taste and flavor, and with little to no defects. To be classified as specialty coffee, a coffee needs to obtain a quality score of 80 or higher on a 100-point scale from the coffee-tasting process (Specialty Coffee Association of America [SCAA], 2016).
The specialty coffee market is growing rapidly in many countries, and the United States has the most developed specialty coffee market, followed by Europe and Asia (SCAA, 2016). In the United States, for example, specialty coffee has increased its market share from 1% to 25% over the last 20 years, and the percentage of adults drinking specialty coffee daily has increased from 9% in 1999 to 34% in 2014 (SCAA, 2016). The growing demand for specialty coffee is attributable to consumers’ awareness regarding issues of quality, taste, health, environment, equity, and fair wages (Bacon, Reference Bacon2005).
Quality standards and quality control are key aspects of the development of the specialty coffee market. Specialty coffee companies often distinguish themselves from mainstream coffee companies because of their strict quality requirements. Quality control from the green beans to the roasting method helps bring the best coffee flavors and aromas, which are the main sensory components experienced by coffee drinkers. Coffee quality can be assessed using three attributes: material, symbolic, and in-person service attributes (Daviron and Ponte, Reference Daviron and Ponte2005). Material attributes result from physical, chemical, or biological processes that create specific characteristics that can be measured using human senses (e.g., taste, smell, vision, hearing, or touch). Symbolic attributes are based on reputations, trademarks, geographic origins, and sustainability practices, whereas in-person service attributes are similar to customer service. In-person service attributes are the result of the human interaction between producers/retailers and consumers and involve effective as well as affective work from the producer/retailer to deliver a good-quality product and gain consumers’ trust; in return, consumers are willing to pay high premium prices (Daviron and Ponte, Reference Daviron and Ponte2005).
Much of the economic literature pertaining to specialty coffee has focused on determining the value buyers place on symbolic attributes. Donnet, Weatherspoon, and Hoehn (Reference Donnet, Weatherspoon and Hoehn2008), Teuber and Herrmann (Reference Teuber and Herrmann2012), Wilson et al. (Reference Wilson, Conley, Harris and Lafone2012), and Wilson and Wilson (Reference Wilson and Wilson2014) mentioned quality score, ranking, country of origin, coffee tree variety, altitude, and farm size as key factors explaining specialty coffee price formation. Although these previous studies extensively used the Cup of Excellence (CoE) data set to predict specialty coffee prices, none assessed how specialty coffee material attributes such as flavors, aromas, body characteristics, mouthfeel, and aftertaste influence specialty coffee quality scores and purchasing prices.
Therefore, the main objective of this study is to measure the impact of material as well as symbolic attributes on specialty coffee quality scores and purchasing prices using the CoE data set from 2004 to 2015. Specifically, this study aims at determining which material attributes yield high-quality scores and premium prices. To the best of our knowledge, this is the first study conducted and reported on the effects of material attributes (flavors, aromas, body characteristics, mouthfeel, and aftertaste) on specialty coffee quality scores and prices. Therefore, this article adds to the existing literature by providing benchmark information concerning coffee tasters’ and buyers’ preferences for specialty coffee material attributes.
2. Theories and Hypotheses
2.1. Theory on Coffee Quality Attributes
Specialty coffee roasters and buyers depend on high-quality beans and are generally willing to pay premium prices for those beans. According to Daviron and Ponte (Reference Daviron and Ponte2005), coffee quality can be assessed either based on material, symbolic, or in-person service attributes. Material quality attributes of a product are attributes embedded in or intrinsic to the product and exist regardless of the identity of sellers and buyers. They result from physical, chemical, or biological processes that create specific characteristics. These characteristics can be measured using human senses (taste, smell, vision, hearing, or touch) or by using sophisticated devices such as spectrographs (Daviron and Ponte, Reference Daviron and Ponte2005). In the CoE competition, material quality attributes are measured through “cupping,” a process through which highly trained experts estimate aroma, taste, and flavor according to the grading system developed by the SCAA. The grading system consists of evaluating the presence of material attributes such as aroma, flavor, aftertaste, acidity, body, balance, clean cup, defects, mouthfeel, and sweetness of each coffee before an average quality score is attributed. Through this system, cuppers use “cupping notes” to record information about material attributes of a coffee (for the cupping form, see Figure A1 in the Appendix). In addition to the cupping notes, cuppers provide a quality score for each coffee, and generally, the higher the quality grade, the higher the price and vice versa.
Symbolic quality attributes are based on trademarks, geographic origins, and sustainability practices (Daviron and Ponte, Reference Daviron and Ponte2005). Trademarks and geographic origin are similar in many ways as they enable consumers or buyers to differentiate products, reduce asymmetries of information, and create value. Sustainable practices are practices that allow for ethical production and consumption (Fairtrade Foundation, 2012). Many organizations such as the Fairtrade Foundation, the Rainforest Alliance, and UTZ work with specialty coffee producers to ensure they follow their standards in terms of chemical usage and other environmental friendly practices. Consequently, these coffees receive certifications that generally translate into premium prices in the market.
In-person service quality attributes are like customer service and are the result of the interaction between producers/retailers and consumers. They involve effective and affective work from the producer or retailer to get attention or trust from consumers, who in return are willing to pay premium prices (Daviron and Ponte, Reference Daviron and Ponte2005). In the specialty coffee industry, in-person service quality attributes can take place between producers and green coffee buyers or between roasters and final consumers. These attributes include the quality of the product delivered to the buyer or final consumer and the human interaction between consumers and the producer/barista (e.g., a barista calling consumers by their name or remembering their favorite drink). The CoE program does not collect information about in-person quality attributes; therefore, the analyses conducted in this study are based on material and symbolic attributes only.
2.2. The Model
Since Waugh published “Quality Factors Affecting Vegetables Prices” in 1928 and the seminal work of Rosen (Reference Rosen1974), hedonic price modeling has been widely used to relate the price and attributes of various agricultural, food, real estate, and environmental products. Theoretically, the hedonic price method consists of measuring the contribution of the attributes of a product to its price. The analysis involves modeling the price of the product as a function of its attributes to estimate the marginal money value of each attribute. Consequently, a regression is used to predict the quality score and price of coffees based on various attributes:
 $$\begin{equation}
p\left( z \right) = \left( {{a_1},{a_2}, \ldots ,{a_n}} \right),
\end{equation}$$
$$\begin{equation}
p\left( z \right) = \left( {{a_1},{a_2}, \ldots ,{a_n}} \right),
\end{equation}$$
where p is the price of product z and (a 1, a 2, . . ., an) represents a set of attributes of product z. The implicit or hedonic price is defined as follows:
 $$\begin{equation}
\frac{{\partial p}}{{\partial {a_1}}} = \ {p_i}\left( {{a_1},{a_2}, \ldots ,{a_n}} \right).
\end{equation}$$
$$\begin{equation}
\frac{{\partial p}}{{\partial {a_1}}} = \ {p_i}\left( {{a_1},{a_2}, \ldots ,{a_n}} \right).
\end{equation}$$
In the case of specialty coffee, the hedonic price method enables us to determine the impact of material as well as symbolic attributes on specialty coffee quality scores or prices. That is, through hedonic price analysis, one can determine the price or the value buyers attach to the intrinsic (material) and the symbolic attributes of each coffee (Wilson and Wilson, Reference Wilson and Wilson2014).
An industry comparable to the specialty coffee industry where the use of hedonic technique is well established is the wine industry. The wine industry uses a tasting system similar to the coffee cupping process to assess material and symbolic attributes of wines, and at the end of the tasting process, expert tasters assign a quality grade to each wine. Material attributes and quality grades are usually displayed on each bottle of wine to reduce asymmetries of information. Generally, the price of each bottle of wine is correlated to the quality grade (the higher the quality grade, the higher the price, and vice versa). Several studies have been conducted using the hedonic method to assess factors explaining differences in the price of wines from numerous regions/countries of the world. Combris, Lecocq, and Visser (Reference Combris, Lecocq and Visser1997) applied the hedonic price method to Bordeaux wines, Oczkowski (Reference Oczkowski2001) used the same technique to study the prices of Australian premium wines, Schamel and Anderson (Reference Schamel and Anderson2003) estimated hedonic price functions for premium wines from Australia and New Zealand, and Lecocq and Visser (Reference Lecocq and Visser2006) applied the hedonic technique to Bordeaux and Burgundy wines, two of the most important French wine regions.
As stated before, most studies conducted in the wine industry use the hedonic price model to explain the effects of material and symbolic attributes on wine quality grades and prices. Therefore, this study adopts the same technique to determine the effects of material and symbolic attributes on specialty coffee quality scores and prices.
2.3. Hypotheses
As suggested by the literature, a product quality can be determined by three attributes (material, symbolic, and in-person service). In the context of the CoE program, only two quality attributes are measured—namely, material and symbolic attributes. Therefore, these two attributes are focused on throughout the rest of the article. Theoretically, specialty coffee quality scores should not be affected by symbolic attributes because of the blind tasting process. However, we predict that specialty coffee prices will be explained by both material and symbolic attributes. Therefore, the following hypotheses are tested:
H1: Specialty coffee quality score is based solely on material attributes, which means that symbolic attributes have no influence on quality score.Footnote 1
H2: Specialty coffee purchasing price is based on both material and symbolic attributes.
3. Data
Data for the present study include 2,123 observations from the CoE e-auctions that took place in 11 countries (Bolivia, Brazil, Burundi, Colombia, Costa Rica, El Salvador, Guatemala, Honduras, Mexico, Nicaragua, and Rwanda) over the period 2004 to 2015. The CoE hosts at least one competition per year in most participating countries, and the competition is open to any coffee grower free of charge. Each participating coffee in the CoE competition is tasted at least five times by a local and international jury panel. During the evaluation, cuppers record a set of material attribute descriptors, such as flavor, aroma, aftertaste, acidity, body shape, balance, cleanness of the cup, defects, mouthfeel, and sweetness, and they provide an average quality score for each coffee sample. Only coffees with an average score of 84 or higherFootnote 2 out of 100 receive the CoE Award and can participate in the national auction. Buyers interested in the CoE specialty coffees can either buy them directly at the live auction or buy samples to do their own tasting before buying the coffees at the live auction (ACE/CoE, 2016).
The CoE live auction is an eBay-style auction where buyers bid against each other for ownership of the winning coffees, and the highest bid wins (Wilson and Wilson, Reference Wilson and Wilson2014). The CoE auction prices are on average 4.5 times higher than the International Coffee Organization (ICO) composite price (Wilson and Wilson, Reference Wilson and Wilson2014). Coffee growers receive more than 80% of the final price, and the remaining amount is a commission paid to the in-country (the country where the CoE competition is taking place) organization committee to help run the program (ACE/CoE, 2016).
The data set includes information on the final auction price of each coffee excluding shipping costs, rank of the coffees, number of coffees in the market, farm data (quantity of coffee bags per lot, certification, coffee tree varietals, altitude, and processing method), and name and origin of buyers.
Material attributes for each coffee participating at the CoE are recorded in the cupping notes (for cupping form, see Figure 1A in the Appendix). Cuppers have used a variety of words to describe the sensory properties of coffees through the years. A total of 112 different flavor/aroma descriptors were used to describe coffees’ flavors and aromas in the data set. To reduce the number of descriptors, the Coffee Taster's Flavor Wheel was used (see Figure A2 in the Appendix). Created by the SCAA using the lexicon developed by World Coffee Research, the Coffee Taster's Flavor Wheel is the largest piece of research on coffee flavor (SCAA, 2016). The 112 flavor/aroma descriptors are classified into 9 groups per the SCAA's Coffee Taster's Flavor Wheel. The most recurrent coffee body types, mouthfeel, and aftertaste descriptors are used, and dummy variables are created to indicate whether the cup is clean and balanced.
4. Estimation Procedures
This study adopts a two-equation estimation procedure to explain how material and symbolic attributes affect the CoE specialty coffee quality scores and prices. In the first step, the method estimates the quality score equation, because price depends mainly on quality score:
 $$\begin{equation}
{Q_i} = M_i^{'}\beta + {\varepsilon _i},
\end{equation}$$
$$\begin{equation}
{Q_i} = M_i^{'}\beta + {\varepsilon _i},
\end{equation}$$
where Qi is the quality score, Mi represents the vectors of material attributes (flavors/aromas, cup type, body characteristics, mouthfeel, and aftertaste) that influence coffee quality score, and εi is an error term. Equation (3a) is also run with the incorporation of symbolic attributes in order to assess their impact on coffee quality score:
 $$\begin{equation}
{Q_i} = M_i^{'}\alpha + R_i^,\gamma + {\mu _i},
\end{equation}$$
$$\begin{equation}
{Q_i} = M_i^{'}\alpha + R_i^,\gamma + {\mu _i},
\end{equation}$$
where Ri is the vector of symbolic variables. In each case, these variables are dummies taking the value 1 if the coffee has the attribute and 0 otherwise, or continuous variables for altitude, number of coffees in the market, or lot size (see Table 1 for the data summary). Variable Mi is defined as in equation (3a), and μi is an error term. Theoretically, the symbolic attributes should not have any impact on a coffee quality score. Therefore, equation (3b) is estimated to assess the effects of symbolic attributes such as country of origin, certification, or number of coffees in the market on specialty coffee quality scores.
Table 1. Summary Statistics
Source: Based on Cup of Excellence data, 2004–2015 (Cup of Excellence, 2016b).
To participate in the CoE live auction, a coffee must obtain a quality score of 84 or higher.Footnote 3 This causes a truncation of quality score, and the estimation of equations (3a) and (3b) is therefore conducted using a truncated maximum likelihood regression model with 84 as a truncation point.
Once the quality score is determined, the second step involves estimating the price equation as follows:
 $$\begin{equation}
{\rm{Ln}}Pric{e_i} = Q_i^{\prime}\varphi + Q_i^{'2}{\rm{\Omega }} + R_i^{\prime}\eta + {\vartheta _i},
\end{equation}$$
$$\begin{equation}
{\rm{Ln}}Pric{e_i} = Q_i^{\prime}\varphi + Q_i^{'2}{\rm{\Omega }} + R_i^{\prime}\eta + {\vartheta _i},
\end{equation}$$
where LnPricei is the logarithm of the price of coffee i (i = 1 to 2,123). All prices are in 2010 prices based on the producer price index. Qi and Ri are defined as discussed previously, and ϑi is the error term. The use of the logarithm is to normalize price. Equation (4a) is just an updated version of Wilson and Wilson (Reference Wilson and Wilson2014) and estimated for comparison purposes. To fulfill our objective, equation (4a) is estimated by replacing quality score by its determinants that are material attributes to assess their direct impact on coffee prices and avoid multicollinearity:
 $$\begin{equation}
{\rm{Ln}}Pric{e_i} = M_i^{\prime}\sigma + R_i^{\prime}\zeta + {\psi _i},
\end{equation}$$
$$\begin{equation}
{\rm{Ln}}Pric{e_i} = M_i^{\prime}\sigma + R_i^{\prime}\zeta + {\psi _i},
\end{equation}$$
where LnPricei, Mi, and Ri are defined as discussed previously, and ψiis the residual.
Recall that any coffee participating in the CoE live auction has a score of 84 or higher; thus, the distribution of price is incidentally truncated, taking the form:
 $$\begin{equation}
{P_i} = \left\{ {\begin{array}{@{}*{1}{l}@{}} {P_i^*\ \ \ \ \ \ \ \ \ \ \ \ \ \ \ \ \ \ \ \ \ when\ Q \ge 84}\\ {unobserved\ \ \ \ \ \ \ when\ Q < 84} \end{array}}\right..
\end{equation}$$
$$\begin{equation}
{P_i} = \left\{ {\begin{array}{@{}*{1}{l}@{}} {P_i^*\ \ \ \ \ \ \ \ \ \ \ \ \ \ \ \ \ \ \ \ \ when\ Q \ge 84}\\ {unobserved\ \ \ \ \ \ \ when\ Q < 84} \end{array}}\right..
\end{equation}$$
Therefore, equations (4a) and (4b) are estimated using a truncated maximum likelihood method with the lowest price for each auction as the truncation point (Hausman and Wise, Reference Hausman and Wise1977; Maddala, Reference Maddala1983; Wilson and Wilson, Reference Wilson and Wilson2014).
5. Results
5.1. Descriptive Statistics
Descriptive statistics presented in Table 1 show that coffees participating in the CoE competition have an average quality score of 87, with 95.76 the highest score, and a mean purchasing price of $7.4 per pound, which is 4.5 times higher than the ICO composite price of 2015. The most common flavors and aromas are fruity, found in 95.7% of the coffees; sweet, present in almost 85% of the coffees; and sour acid, present in 58% of the coffees. The wet processing method is widely used by farmers, and almost 66% of the coffees are processed through this method. The data show that Bourbon, Caturra, and Catuai are the most popular coffee tree varieties, planted respectively by 23%, 14%, and 11% of the farmers. The average farm is located at an altitude of 1,500 m above sea level, and very few (4%) of the farms have some type of certification (Organic, Rainforest Alliance, or UTZ). In general, there are 30 bags of 70 kg/bag that are supplied by each farmer participating in the CoE live auction, and the average number of coffees per auction is 27. As stated previously, the CoE program is held in 11 coffee-producing countries worldwide, but our data set indicates that coffees are mainly from El Salvador (14.3%), Honduras (13.9%), Brazil (13%), and Nicaragua (12.7%). The CoE live auction attracts buyers from all around the world, and the data set indicates that almost 50% of buyers are from Asia and 29% are groups of buyers not necessarily from the same country or continent.
5.2. Grading Equations
Equation (3a) estimated through truncated regression shows that the relationship between coffee quality score and material attributes is positive and significant except for other flavors and roasted flavors that have a significant but negative impact on quality score (Table 2). Sweet, floral, fruity, and sour acid flavors/aromas have the largest effect on quality score. For example, having an extra flavor/aroma of fruity, floral, and sweet increases quality score by 3.3, 1.3, and 1.01 points, respectively. Having a lot of flavors and aromas is good, but a balanced combination of them is rewarded an extra 0.36 quality score point. Clean and transparent attributes have a significantly positive effect on quality score, confirming the expectation that specialty coffees have little or no defects. Mouthfeel is another important factor affecting coffee quality score. Smooth and juicy mouthfeel are all positive and significant at the 1% level, while a buttery mouthfeel is positive and significant at the 5% level. Aftertaste is another attribute valued by cuppers. Long aftertaste is positive and significant at the 5% level, but a lingering aftertaste is not significant. These latter results suggest that material attributes significantly influence coffee quality scores.
Table 2. Quality Score Equations Estimation

Note: Asterisks (*, **, ***) indicate significance at the 10% level, 5% level, and 1% level, respectively.
Source: Based on Cup of Excellence data, 2004–2015 (Cup of Excellence, 2016b).
The introduction of symbolic attributes in equation (3b) tremendously improves the grading equation. Equation (3a) has an Akaike information criterion (AIC) of 9,661 and a Bayesian information criterion (BIC) of 9,789, whereas the additional inclusion of the processing method, coffee tree variety, certification, number of coffees in the market, country of origin, and year decreases the AIC to 8,264 and the BIC to 8,576. The Pacamara tree variety with respect to the base tree variety Bourbon, Rainforest Alliance certification versus no certification, and altitude have a positive and significant effect on quality score, whereas the number of coffees in the market has a negative and significant effect on quality score. For example, certification is worth almost an extra 1.5 points in quality score, and an extra meter in altitude is worth 0.3 point in quality score, but a one-unit increase in the number of coffees in the market decreases the quality score by 0.028 point. The estimated coefficients for all countries of origin are significant but negative, which means that compared with Brazil, coffees from other countries have relatively lower quality scores. Introduced as correction variables for the quality score over time, the coefficients for competition year are negative and significant. This means that compared with the base year 2004, quality score has been decreasing over the years. This is indeed true because the highest mean quality score and the highest single score ever recorded in the CoE program (95.76) were recorded in year 2004. The improvement of the grading equation (3a) with the inclusion of symbolic attributes suggests their importance in the grading system.
The conclusion of this analysis is that quality score not only depends on material attributes as expected, but also on symbolic attributes such as the country of origin, certification, number of coffees in the market, and altitude. This result shows that symbolic attributes matter in the grading process and means that coffee quality improves with altitude, certification, and certain tree varieties, whereas it decreases with the number of coffees.
5.3. Price Equations
Equation (4a), which is an updated version of Wilson and Wilson (Reference Wilson and Wilson2014), confirms the nonlinear relationship between quality score and price (Table 3). The coefficients of quality score and the quality score square are both positive and highly significant (99% significance level). The model (equation 4a) predicts that an additional quality score pointFootnote 4 increases price by 18.68%. However, after 93.10 the effect of a one-unit increase in quality score becomes negative. As in Wilson and Wilson (Reference Wilson and Wilson2014), this result is supported by examples in the data set where higher-scoring coffees garnered lower prices than lower-scoring coffees in another auction. The number of descriptors used to describe coffees is a significant predictor of prices, and any additional descriptor is associated with a 0.74% increase in price.
Table 3. Price Equations Estimation

Note: Asterisks (*, **, ***) indicate significance at the 10% level, 5% level, and 1% level, respectively.
Source: Based on Cup of Excellence data, 2004–2015 (Cup of Excellence, 2016b).
Ranking matters, and according to the estimates, obtaining the first placeFootnote 5 gives the highest premium at 133.08% more than coffees not ranked in the top four coffees; obtaining the second, third, or fourth place gives a premium at 44.02%, 26.71%, and 15.06%, respectively. These results suggest that ranking, which is based on quality score, is perhaps more important than having the quality score alone (Donnet, Weatherspoon, and Hoehn, Reference Donnet, Weatherspoon and Hoehn2008; Wilson and Wilson, Reference Wilson and Wilson2014).
Variables such as market size (number of coffees in the auction) and processing methods have significant impact on coffee prices. When the number of coffees in the market increases by one for example, price decreases by 0.76%. Results also show that the effect of other processing methods (semiwashed, pulped natural, and honey processing) is positive and highly significant (99% level of significance).
Altitude has a positive and highly significant effect on prices, which suggests that coffees grown at high altitude are regarded as superior quality coffee by buyers. Contrary to Donnet, Weatherspoon, and Hoehn (Reference Donnet, Weatherspoon and Hoehn2008), where Pacamara was the only tree variety with a significant effect on price, or Teuber and Herrmann (Reference Teuber and Herrmann2012), where Bourbon and Pacamara were the tree varieties with significant effects on coffee prices, our results show that Caturra and Pacamara tree varieties have a positive and significant impact on coffee prices, whereas Typica has a negative and significant effect on coffee prices. Furthermore, this study shows that organic certification is valued by buyers, and compared with coffees with no certification, organic certification increases a coffee price by 14.95%.
Another attribute valued by buyers is the size of the lots, which represents the quantity of coffee supplied by farmers. Buyers prefer small lot sizes, and a unit increase in lot size decreases price by 0.47%. Country of origin significantly affects coffee prices as well. For example, coffees from Bolivia, Colombia, Costa Rica, El Salvador, Guatemala, and Mexico have higher purchasing prices compared with Brazil. Also, it is worth noticing that coffees from African countries (Burundi and Rwanda) are not statistically different than Brazilian coffees.
Compared with the base year 2004, other years exhibit positive and highly significant coefficients suggesting an increase in the price of CoE coffees because of either their high quality or their popularity in the coffee industry. Origin of buyers has little effect on coffee price as only the estimate for Asian buyers is significant but negative. This means that compared with North American buyers, Asian buyers value CoE coffees less or buy a wide range of coffees (high and low quality).
The biggest contribution and the most significant difference between this study and previous studies is the inclusion of material attributes in the price equations. In equation (4b), quality score is replaced by its determinants—namely, material attributes to assess their direct effects on prices. Results show that all aroma and flavor attributes have a positive impact on prices except for other flavors (chemical and papery) and roasted flavors, which have a negative but nonsignificant effect. Spices (3.20%), sweets (3.75%), floral (6.87%), fruity (40.32%), and sour acid (14.78%) have positive and significant effects on coffee prices. Results also indicate that having a balanced coffee is rewarded by a 3.10% increase in price, while transparent and coffees with a smooth mouthfeel are valued at a 5.09% and 3.12% price premium, respectively. The effect of aftertaste (lingering and long aftertaste) was negative but not significant, which probably means that buyers do not value those sensory attributes. This result might be because most buyers do not taste the coffees before buying them and therefore do not put any value on those attributes. Surprisingly, creamy and round body types are significant in the price equation. This result is surprising because body types were not significant in the grading equations, suggesting that buyers and cuppers value specialty coffee attributes differently. Because many buyers of the CoE are roasters, body type is an important quality characteristic in their process, which is not the case for coffee cuppers.
As in equation (4a), symbolic attributes have the same effect, with tree variety having little effect, while altitude, lot size, number of coffees in the market, and rank were all significant with the same sign and magnitude. The effect of country of origin was less pronounced, but still present with four countries being highly significant. The variable for year was positive and significant except for the year 2005. Regression with the inclusion of material variables shows all buyers have significant estimates. However, only buyers from Nordic countries and groups of buyers were paying high prices compared with North American buyers.
6. Discussion and Conclusions
The objectives of this study were three-fold: first, to add to the existing literature on specialty coffees by estimating factors affecting coffee quality scores; second, to determine the effects of material attributes on coffee prices; and, third, to provide coffee professionals with information that allows them to make accurate investment decisions.
The first implication of the study is that although specialty coffee quality scores should in theory be based on material attributes only, symbolic attributes such as altitude, certification, market size, and country of origin play a major role in their determination as well. As an indicator of quality and primary requirement to enter the market, the relation between quality score and symbolic variables suggests that one can improve the quality score by having a farm at high altitude, planting a single tree variety such as Pacamara, and having a certification (Organic or Rainforest Alliance). The increase in quality score pays off in two ways: at least 18% increases in price for each additional point and from 15% to 133% increases in price for being ranked in the top four. Results of the price equation estimations show that buyers favored small quantities; pulped, semidry, or honey processing methods; and coffee tree varieties such as Caturra and Pacamara. These are some factors that farmers can take into account in order to make sound investments and profit-maximizing decisions.
On the buyer side, the implication of our analysis is that one should refer to the cupping notes before making buying decisions about CoE specialty coffees. This is because of the fact that high-quality coffee does not necessarily translate into high grade especially when comparing coffees across countries. That is, a high-scoring coffee in one country may have the same or lower quality compared with a coffee from another country with a low score, so the cupping notes can help differentiate coffees.
For the coffee industry, our analysis revealed cuppers’, buyers’, and therefore consumers’ preferences for coffee material attributes such as aromas and flavors. Results show that fruity, floral, sweet, spice, and sour acid aromas and flavors are the favorite flavors and aromas. Also, the analysis reveals that buyers (consumers) prefer balanced coffee. The recognition of these material attributes is important especially for coffee buyers because it allows them to buy high-quality coffees. Finally, the analysis shows that buyers place more value on symbolic attributes than material attributes.
Appendix
Table A1. Flavors/Aromas Used to Describe Coffees from the Cup of Excellence Competitions (data from 2004 to 2015)
Figure A1. Cup of Excellence Cupping Form (source: Cup of Excellence, 2016a)
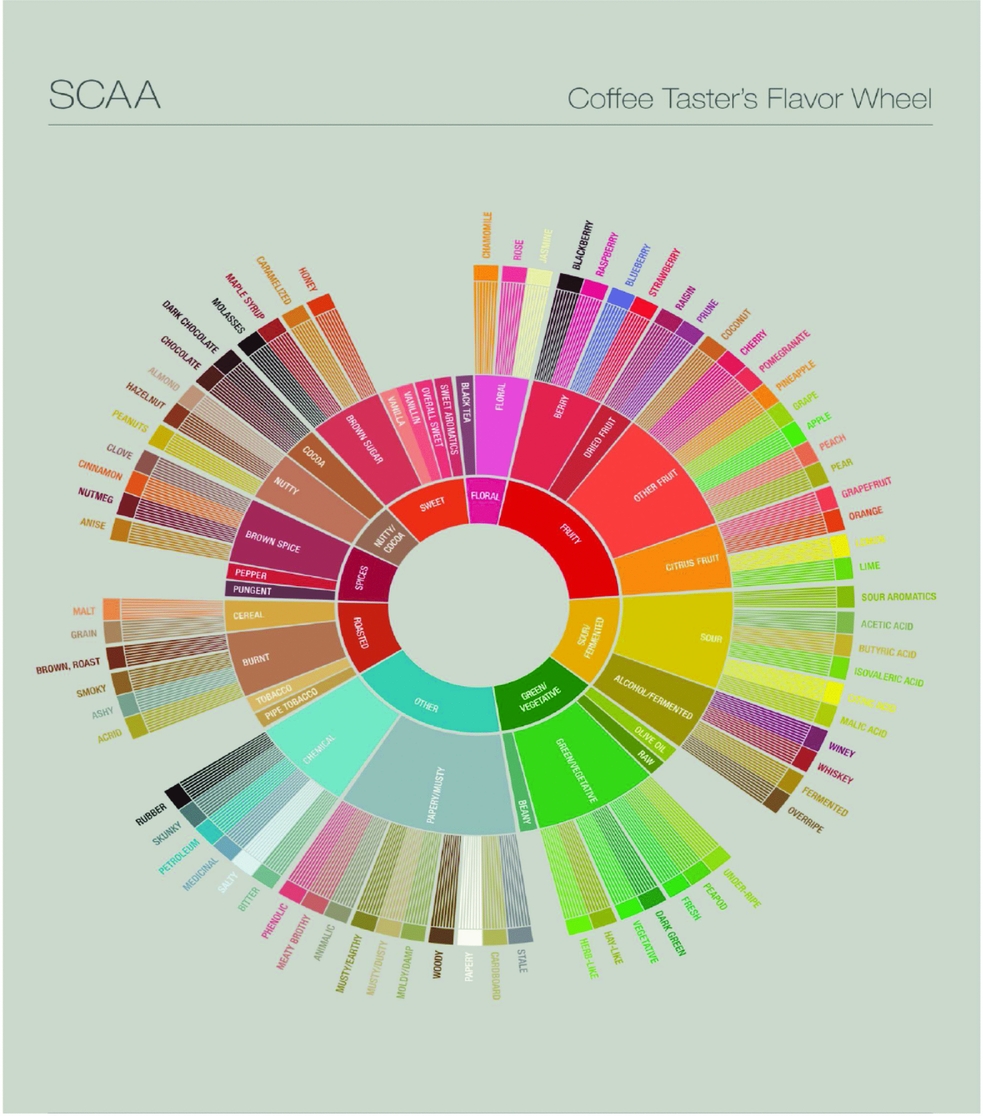
Figure A2. Specialty Coffee Association of America (SCAA) Coffee Taster's Flavor Wheel (source: SCAA, 2016)


 Open access