


1. Introduction
Fluid flows are known to exhibit shock waves across which there is an abrupt change in properties, such as pressure and temperature in the case of gases, velocity and depth in the case of shallow water and volume fraction, velocity and height in the case of granular flows. While shock waves in gases have been extensively studied in the past, granular shocks have recently received much attention because of their relevance to many industrial as well as naturally occurring flows (Brennen, Sieck & Paslaski Reference Brennen, Sieck and Paslaski1983; Savage Reference Savage1984; Jaeger, Nagel & Behringer Reference Jaeger, Nagel and Behringer1996; Faug et al. Reference Faug, Childs, Wyburn and Einav2015; Vilquin, Boudet & Kellay Reference Vilquin, Boudet and Kellay2016; Delannay et al. Reference Delannay, Valance, Mangeney, Roche and Richard2017). Of particular interest are the landslides and snow avalanches, which have been, time and again, witnessed in many parts of the world (Gray, Tai & Noelle Reference Gray, Tai and Noelle2003; Gray & Cui Reference Gray and Cui2007; Delannay et al. Reference Delannay, Valance, Mangeney, Roche and Richard2017).
Dynamics of granular flows is dominated by inelasticity and frictional resistance between colliding grains, which makes the entire system highly dissipative. Because of the macroscopic size and the lack of thermal motion of the grains, granular flows have small wave speed in comparison with the flow speed. Therefore, granular flows easily become supersonic, even at speeds as low as 1 m s $^{-1}$, and exhibit shock waves (Heil et al. Reference Heil, Rericha, Goldman and Swinney2004; Amarouchene & Kellay Reference Amarouchene and Kellay2006; Khan et al. Reference Khan, Verma, Hankare, Kumar and Kumar2020). Granular shocks can be produced in laboratories by placing obstacles, such as a triangular wedge, in a stream of granular material (Gray et al. Reference Gray, Tai and Noelle2003; Gray & Cui Reference Gray and Cui2007; Garai, Verma & Kumar Reference Garai, Verma and Kumar2019; Khan et al. Reference Khan, Hankare, Kumar, Kumar, Verma and Prakash2019, Reference Khan, Hankare, Verma, Jaiswal, Kumar and Kumar2022; Patel et al. Reference Patel, Tiwari, Khan, Verma, Kumar and Kumar2022). These shock waves are characterised by abrupt change in velocity and packing fraction of grains across a shock front. For slender bodies, which offer less deflection to the free stream, oblique attached shock waves may be formed, whereas, for bluff bodies that offer larger deflection to the incoming grains, detached bow shock waves are formed. Salient features of these shock waves are studied and modelled using a continuum approach (Gray et al. Reference Gray, Tai and Noelle2003; Gray & Cui Reference Gray and Cui2007; Johnson & Gray Reference Johnson and Gray2011; Cui & Gray Reference Cui and Gray2013; Johnson Reference Johnson2020; Tregaskis et al. Reference Tregaskis, Johnson, Cui and Gray2022) and particle-based simulations such as the molecular dynamics and discrete element methods (Goldshtein et al. Reference Goldshtein, Shapiro, Moldavsky and Fichman1995; Buchholtz & Pöschel Reference Buchholtz and Pöschel1998; Rericha et al. Reference Rericha, Bizon, Shattuck and Swinney2001; Boudet, Amarouchene & Kellay Reference Boudet, Amarouchene and Kellay2008; Pudasaini & Kröner Reference Pudasaini and Kröner2008; Padgett, Mazzoleni & Faw Reference Padgett, Mazzoleni and Faw2015; Mathews et al. Reference Mathews, Khan, Sharma, Kumar and Kumar2022).
The present article investigates the formation of dynamic granular heaps past an array of three triangular obstacles in a quasi-two-dimensional channel. Such flows were recently investigated by Khan et al. (Reference Khan, Hankare, Kumar, Kumar, Verma and Prakash2019, Reference Khan, Verma, Hankare, Kumar and Kumar2020) with two wedges using the shadowgraphy flow visualisation technique. It was reported that, for larger spacings, separate shock waves are formed on both the wedges that interact in the central region resulting in the formation of a granular streak at the centre. On the other hand, a single curved shock wave is formed when the two wedges are very close to each other. In the present work, flow past an array of three wedges is investigated not only due to it being a natural extension to the previous work but also because it will provide important insights regarding the generalised behaviour of these flows as one moves from a single obstacle to a system of two and more than two obstacles. As will be shown in the remaining part of this article, a system of three obstacles offers much more interesting flow features than the two-obstacle case. In the present work, image processing and particle image velocimetry techniques are used alongside shadowgraphy to reveal intricate flow features that were not observed before.
2. Experimental set-up and procedure
The set-up consists of two parallel rectangular glass sheets of dimension  $300\times 900$ mm $^2$ separated by a gap of 5 mm, creating a thin rectangular channel that can be inclined at different angles. The experimental set-up is similar to the one used in earlier studies by Khan et al. (Reference Khan, Hankare, Verma, Jaiswal, Kumar and Kumar2022), which may be referred to for more details. Figure 1(a) shows the schematic of the array of three identical wedge obstacles placed in line with symmetrical spacing ( $S$) at a distance of $l = 500$ mm downstream from the hopper opening. The triangular wedges are isosceles with semi-wedge angle $\theta = 60^\circ$ and the length of base $b = 34.6$ mm, such that, from the schematic in figure 1(a), $R= 3b + 2S$ is the effective blockage offered by the array to the incoming stream. These wedges are manufactured by laser cutting the triangles from 5 mm thick brass sheets. The grains used are spherical transparent glass beads with a nominal diameter of $\sigma = 0.125 \pm 0.025$ mm, while the channel thickness, $t \approx 40\sigma$. For each experiment, an equal amount of grains are loaded into the hopper, and experiments are repeated several times for error/uncertainty analysis and repeatability.

Figure 1. (a) Schematic of the three-wedge array; (b) mean free-stream velocity  $V$ at the location of wedge, where the solid line is for a point particle sliding on a frictionless incline.
The hopper has a rectangular slit of size  $300\times 4$ mm $^2$ that is aligned with the base sheet of the channel. Opening this slit once the hopper is loaded releases grains into the channel under the influence of gravity. Different flow features are formed when the flowing granular material encounters obstacles, which are captured as regions of different shades in shadowgraph images due to flow thickness and density variations using a high-resolution camera. We have analysed around 10 000 such images to extract geometric information. The mean velocity of the free stream ( $V$) at the location $l = 500$ mm downstream from hopper opening is measured by particle image velocimetry using images acquired with a high-speed camera, as illustrated in Khan et al. (Reference Khan, Verma, Hankare, Kumar and Kumar2020), for different values of channel inclination $\phi$. Figure 1(b) shows the variation of measured $V$ with $\sin \phi$ that follows a linear trend. The solid line here represents an ideal case where the velocity of a particle sliding on a frictionless inclined plane is obtained using the basic kinematics and is given as $V_{Ideal} = \sqrt {2gl\sin \phi }$, where $g = 9.81$ m s $^{-2}$ and $l = 500$ mm is the distance travelled by a particle on the incline starting from rest. The middle dashed line represents the velocity obtained using the kinematic equation with a constant frictional value of 0.4 between the grains and the chute wall (Viroulet et al. Reference Viroulet, Baker, Edwards, Johnson, Gjaltema, Clavel and Gray2017). The separation between the calculated and experimental curves reduces as $\phi$ increases because the energy loss due to the basal friction and inelastic collisions decreases with an increase in the channel inclination. An equivalent Mach number can also be defined for these flows based on the gas dynamic analogy, which is not presented here but the reader is referred to Khan et al. (Reference Khan, Hankare, Verma, Jaiswal, Kumar and Kumar2022), where a similar set-up and flow conditions are used.
3. Results and discussion
The present experiments are performed for a single value of the semi-wedge angle  $\theta = 60^\circ$, whereas the wedge spacing $S$ and the channel inclination $\phi$ are varied systematically. Different flow structures are observed for this parametric space, as shown in the shadowgraphs of figure 2 and are broadly categorised into three types. Figure 2(a) represents the type-I category where the wedges are placed in contact with each other such that the wedge spacing $S = 0$. In this case, all three wedges act as a single obstacle resulting in the formation of a single detached shock wave with a large heap of static grains. The shock stand-off distance, $\delta$, is the distance between the apex of the central wedge and the tip/nose of the bow shock wave, as shown in figure 2(a). The thin incoming stream (with flow depth $h \leq 8\sigma$) on the base plate sees this heap as an effective body and forms a circulating region of grains enveloping the heap due to the constraint by the upper plate of the channel, similar to a juncture flow in fluids (Simpson Reference Simpson2001). The upstream boundary of the circulating region is referred to as a shock wave, due to the clustering of grains at the periphery under deceleration from gravity. When a small gap is introduced between the wedges, the type-II category of the shock wave structure is formed. Figure 2(b) represents one such case with $S = 0.4d$, where grains emanate through the inter-wedge spacing as dense granular jets that expand into the wake. The motion of grains through inter-wedge spacing complicates the dynamics of the granular heap due to the simultaneous presence of static and flowing grains.

Figure 2. Three types of flow morphologies depending on the value of  $S$ and $\phi$. (a) Type-I, $S = 0$ and $\phi = 39.5^\circ$; (b) type-II, $S = 0.4d = 8$ mm and $\phi = 39.5^\circ$ with exit jets from gaps; and (c) type-III, $S =d = 20$ mm and $\phi = 40^\circ$ with small heap on each wedge.
Consequently, the shape of the shock wave also changes such that the outer profile bends inwards due to the downward motions of grains just above the wedge spacing. When the spacing is further increased to large values (for example,  $S = d$, as shown in figure 2c), it is observed that a single large shock wave that encapsulates all three wedges does not form. Instead, three separate shock waves are formed on each of the wedges that interact in the inter-wedge region, resulting in the formation of streaks of concentrated grains. This structure is referred to as a type-III shock wave.
In the present experiments, the shock stand-off distance,  $\delta$, is assumed to depend on the following geometric and kinematic parameters: effective blockage length, $R$, total wedge base, $B$ (
$B$ ( $=3b$), channel thickness, $t$, grain size, $\sigma$, flow depth, $h$, free-stream velocity, $V$ (
$V$ ( $\propto \sin \phi$, see figure 1b), and the component of gravity normal to the plate $g\cos \phi$. The assumed relation is expressed as
 \begin{equation} \delta = G (R,\ B,\ t,\ \sigma,\ h,\ V,\ g\cos\phi ). \end{equation}
There are perhaps other parameters, such as grain–grain friction, restitution coefficients, etc. that have been omitted here as they are not controlled and are assumed constant during the experiments. The relation in (3.1) can be written in the following non-dimensional form:
 \begin{equation} \frac{\delta}{R} = H \left( \frac{V}{\sqrt{hg\cos\phi}},\ \frac{R}{B},\ \frac{B}{t},\ \frac{t}{h}, \frac{h}{\sigma} \right). \end{equation}
The variation in flow depth  $h$ could not be measured accurately; however, it was approximately found to vary from 0.65 to 0.9 mm with channel inclination. Therefore, an ensemble-averaged value ( $h = 0.8$ mm) over all the inclination angles is used for normalising the parameters. Using the above assumption, three out of six non-dimensional groups ( $B/t$, $t/h$, and $h/\sigma$) came out to be constant. Finally, the functional relation reduces to
 \begin{equation} \delta^* = f ( Fr,\ R^*), \end{equation}
where  $\delta ^* = \delta /R$, the Froude number $Fr = V/\sqrt {hg\cos \phi }$ and the spacing ratio $R^* = R/B$.
Figure 3 shows the variation of the normalised shock stand-off distance,  $\delta ^*$, with Froude number $Fr$, for different values of the wedge spacing, $S$. It is evident that $\delta ^*$ decreases monotonically with $Fr$ such that it decreases approximately linearly for $Fr$ ranging from 16 to 24, and then asymptotically approaches a constant value for high $Fr$ depending on spacing. The decreasing trend in the shock stand-off distance suggests that the shock wave becomes stronger with increasing $Fr$ and is consistent with the general trend of the shock waves that have been widely reported in the literature for single-obstacle cases. Even though the heap's internal structure changes with wedge spacing, the shock stand-off distance follows the same qualitative trend with $Fr$. This behaviour is possibly due to the fact that the stable heap angle strongly depends on the channel inclination and mass influx but not on the arrangement of the wedges since the entire wedge array is shielded by a heap formed on it. Similar static heaps were observed by Tregaskis et al. (Reference Tregaskis, Johnson, Cui and Gray2022) in their experiments on open channel flows i.e. without the presence of an upper wall. They used a rough wall as the base and demonstrated the formation of a nearly triangular static heap around a single obstacle with a dependence on the chute inclination.

Figure 3. Variation of non-dimensional stand-off distance ( $\delta ^* = \delta /R$) with Froude number ( $Fr = V/\sqrt {hg\cos \phi }$) for different spacing choices; inset shows the variation of $\delta ^*$ with spacing $S$ (or $R^*$) at a given Froude number.
Since the present study involves an array of obstacles, the inter-wedge spacing would play an essential role in governing  $\delta ^*$ (also suggested by (3.3)). The inset in figure 3 depicts this effect of spacing ratio $R^*$, on $\delta ^*$ at a given Froude number $Fr$. The variation of $\delta ^*$ is non-monotonic, with maximum at $R^* = 1.04$ (or $S = 2$ mm) for all values of $Fr$, and then it undergoes a continuous decrease with increasing $R^*$. Thus, introducing a small spacing between the wedges increases $\delta ^*$ instead of decreasing it, which can be explained as follows. Introducing the spacing between the wedges influences the heap height in two ways. The first is related to the motion of grains through the gaps such that, for higher spacing, the granular mass efflux through gaps is higher, and thus, the heap height will be smaller. The second is related to the effective blockage ( $R$) offered by the wedge array to the oncoming stream; such that, for large gaps between the wedges, the effective blockage is more significant to the free stream, thus giving a larger heap height. These two mechanisms go hand-in-hand; therefore, the net effect of the spacing on the heap height depends on the dominating mechanism. Thus, when the spacing $S$ between the wedges is very small (say, around $0.1d$ or 2 mm), the grains do not flow easily through the gap because of friction and jamming. For this reason, the effect of an increase in the effective blockage ( $R^*$) dominates for small values of $S$ because of which the heap height increases with the increase in $S$. For higher spacing, on the other hand, the grains flow easily through the gaps because of which the effect of mass efflux dominates over the effective blockage ratio and eventually leads to smaller heap height as the value of $S$ increases.
Figure 4(a) shows the variation of  $\delta ^*$ for $16\leq Fr \leq 24$ (or $\phi \leq 45^\circ$) with linear-fitted dash lines corresponding to each spacing ratio $R^*$. The slope, $m$, and $\delta ^*$-intercept, $C$, of each straight line is a function of spacing ratio $R^*$ only. Therefore, each line can be expressed as
 \begin{equation} \delta^*|_{R^*} = m(R^*) Fr + C(R^*). \end{equation}
The variation of  $C$ with $R^*$ is shown in figure 4(b), and it is found to be approximately constant, with a standard deviation of less than $1.1\,\%$ of the mean value (represented by a dashed line). The inset in figure 4(b) shows the variation of slope ( $\tan ^{-1}(m)$) with $R^*$, which follows a monotonically decreasing trend, but the difference in the extremum values is very small (less than $0.6^\circ$). This suggests that both $\delta ^*$-intercept, $C$, and slope, $m$, are weak functions of the spacing ratio, $R^*$. Although a weak function, the values of $m$ from the figure 4(b) inset can be used as an empirical rule to predict $\delta ^*$ for $R^*>1$ and $16\leq Fr\leq 24$; using a family of lines passing through an extrapolated point ( $\delta ^* =1.45,\ Fr = 0$) with different slopes, expressed as (3.5) with an error of less than $2\,\%$
 \begin{equation} \delta^*|_{R^*} = m(R^*) Fr + 1.45. \end{equation}
Figure 4. (a) Variation  $\delta ^*$ for $Fr$ between 16 and 24 (or $\phi \leq 45^\circ$) with linear-fitted dash lines corresponding to each spacing ratio; (b) $\delta ^*$-intercept $C$ of linear-fitted lines with spacing ratio $R^*$ and the inset shows the variation of slope for the same lines.
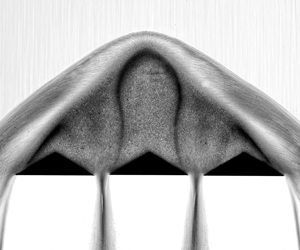
To better understand the heap structure, overexposed shadowgraph images were captured, and then with the help of tone mapping, a high dynamic range image was produced. This image (figure 5) reveals the internal structures of the heap that were previously hidden in dark shades of shadowgraphs (shown in figure 2). The process and mechanism of the formation of detached shock waves and associated granular heaps on a single obstacle have been discussed in earlier studies, for example Amarouchene, Boudet & Kellay (Reference Amarouchene, Boudet and Kellay2001), Khan et al. (Reference Khan, Hankare, Verma, Jaiswal, Kumar and Kumar2022) and Mathews et al. (Reference Mathews, Khan, Sharma, Kumar and Kumar2022). When rapid granular flow strikes an obstacle, grains undergo numerous collisions and start accumulating near the obstacle. Over time, these collisions lead to energy dissipation, eventually forming a nearly parabolic heap due to granular collapse. The static heap grows as long as the grains continue accumulating until a stable heap angle is attained.

Figure 5. Shocked granular flow for the case with  $S = 0.3d$ and $\phi = 65^\circ$.
Table 1. Mass flow rates.

In the case of three wedges, the opening between the wedges allows grains to escape into the wake, thereby inducing motion in the otherwise static heap. Thus, the inner structure of the heap appears far more complicated than the single-wedge case due to the simultaneous presence of the zones of static and flowing grains. The image in figure 5 has an exposure time of 1/125 s, so the flowing grains within the heap can be demarcated from the static grains through motion blur. Figure 5 reveals that the shocked structure has an inner heap with densely packed grains surrounded by a more dilute layer with fast-moving grains. The outer layer is formed when fast-moving grains strike the heap and reflect backwards, as evident through the outer zone's pathlines. This results in a circulatory flow of grains near the heap surface. It is therefore apparent that the flow field is three-dimensional due to the presence of the upper wall, and that what appears in the image is the manifestation of grains near the upper wall. The heap has three regions of static grains directly above each wedge. The static heaps on the side wedges have an asymmetric flow structure with a small triangular heap. On the other hand, the central wedge has a relatively larger static heap with a peculiar dome shape that has not been observed before to the best knowledge of the authors. The static grains within the heap are separated from the moving grains outside it through a thin shear layer that appears as a dark shade in figure 5. This dark band is formed when finer dust particles present in very small concentration (accumulated over time) start percolating inwards from the outer side of the heap to the inner side as grains from the free stream continue to slide over the heap. The dust particles are opaque and are nearly one order of magnitude smaller than the glass beads. Therefore, these dust particles tend to percolate inwards due to the sieving mechanism but cannot enter deeper into the static heap due to the complete absence of motion (this phenomenon can be seen in supplementary movie 1 available at https://doi.org/10.1017/jfm.2023.211; a top illuminated movie 2 is also presented where dust is not visible). It is for this reason that dust particles accumulate around the static heap and serve as an effective visualisation tool in demarcating the static and the flowing region. The formation of the tall central dome-like static zone in the present case is stabilised by two adjacent shear layers on the either side, which was not observed in the case of a single- or two-wedge case. It is this central dome that is responsible for the non-monotonic behaviour of  $\delta ^*$ shown in figure 3 inset.
3.1. Effect of mass flow rate
In all the results discussed so far the mass flow rate was not explicitly controlled, rather, it was dependent on the channel inclination. To study the effect of mass flow rate, modifications were made in the experimental set-up such that a vertical hopper is used. A vertical hopper ensures that the mass inflow rate is independent of channel inclination and can be controlled using different sizes of slit openings at the bottom of the hopper. With this approach, the effect of mass flow rate can be decoupled from the effect of channel inclination. Experiments are performed for four mass inflow rate values, as shown in table 1. Figure 6 shows that the free-stream velocity is higher for a higher mass flow rate. This is because, with a higher mass flow rate, a majority of grains remain unaffected by the basal friction from the chute lower wall. Figure 7 shows the flow structures at different mass inflow rates at an inclination of  $53^\circ$ (other parameters being constant). It is evident that the mass flow rate has a substantial influence on the inner heap and fast-moving outer layer. Both the inner heap as well as the outer layer thickness increases with the mass flow rate. The size of the inner dense zone increases due to a higher deposition rate during the transient stage whereas the size of the outer layer increases as a result of increased free-stream velocity due to increased mass flow rate, as shown in figure 6. Interestingly, the granular jets from the inter-wedge spacings seem unaffected by a change in the mass influx value at a constant inclination. This could be a manifestation of the Janssen effect (Janssen Reference Janssen1895).

Figure 6. Variation of free-stream velocity  $V$ with the channel inclination for different mass flow rate values. Dashed lines are linear fits to the experimental data.

Figure 7. Flow structures at different mass flow rates for a spacing ratio of  $R^* = 1.12$ or $S = 6$ mm; (a) $m_3$; (b) $m_4$; (c) $m_5$; (d) $m_6$ at a constant inclination $\phi = 53^\circ$.
Figure 8(a) shows the variation of  $\delta ^*$ with the tangent of inclination $\phi$. Here, $\tan (\phi )$ is used as abscissa for comparison since the Froude number would differ for each mass flow rate value. One can see that $\delta ^*$ decreases monotonically with $\tan (\phi )$, irrespective of the mass flow rate. However, the shape of the curve is different for all the values of mass flow rate, indicating that there is no generalised curve that can be used to fit these data. Also, similar qualitative behaviour is observed for all values of the spacing and therefore only one case ( $R^* = 1.12$) is presented here. We also found that $\delta ^*$ scales linearly with mass influx $m^*$ for a given spacing ratio and inclinations less than $45^\circ$, as shown in figure 8(b) where $\delta ^*$ is plotted with $m^*$.

Figure 8. (a) Variation of normalised shock stand-off distance  $\delta ^*$ with $\tan (\phi )$ for different mass flow rates, and (b) variation of normalised shock stand-off distance $\delta ^*$ with $m^*$ for different channel inclinations.
3.2. Velocity distributions
Figure 9 shows the velocity distribution at the top surface for a case with  $R^*=1.12$ and $Fr=27$ (or $S = 6$ mm and $\phi = 49^\circ$), obtained using particle image velocimetry. It must be pointed out that the velocity field presented is a two-dimensional field. This is perhaps true for most of the shocked region except for the circulating flow at the periphery, where the presented velocity is a projected field. The images are acquired at 2000 frames per second and analysed using the PIVlab software. The flow field shown here is for the steady flow averaged over 1000 frames to remove noise and fluctuations. A logarithmic scale is used for colour mapping due to the large-scale separation between the speeds in the slow-moving regions of heap and free stream. The right half of the figure is overlayed with streamlines and velocity vectors. Typical flow features visible from the velocity data are closely related to those evident from the shadowgraph shown in figure 5. Two asymmetric static zones and one large symmetric dome of static grains appear in the dark blue shade on the side wedges and the central wedge, respectively. Surrounding the heap is a thin layer of a white band across which abrupt velocity change occurs. This abrupt change in velocity is also evidenced by the sharp turning of the streamlines, which is a typical characteristic of a shock wave. Grains around the wedge spacing accelerate within the heap region such that they expand and attain high velocity as they move into the wake region. The velocity ( $y$-component) induced inside the heap due to wedge spacing is extracted on line A–B, and its variation is shown in figure 9(b). Since the motion of grains inside the heap is non-uniform, this results in the formation of shear layers predominantly due to nonlinear variation of the velocity. To capture this behaviour, the velocity ( $y$-component) and the velocity gradient (shear rate) along the line C–D are plotted in figure 9(c,d). It can be seen that there is a sudden increase in the shear rate while moving from static to dynamic zone and vice versa along line C–D.

Figure 9. (a) Velocity distribution for a type-II case with  $R^*=1.12$ and $Fr=27$; the flow is from top to bottom; (b,c) vertical velocity component over lines A–B, C–D and E–F with the normalised length of that line; (d) shear rate on line C–D.
4. Conclusions
This paper investigates the rapid granular flow past three triangular obstacles placed symmetrically in a thin rectangular channel. The spacing between the wedges strongly influences the detached bow shock wave and the dynamics of the heap formed around the obstacles. The following conclusions can be drawn from this study:
• Detached granular shocks are typically characterised by the presence of a static heap ahead of the obstacle. In the case of multiple obstacles, the inner heap consists of multiple regions of static and flowing regions and granular jets emanating into the wake through the narrow gaps between the wedges.
• The introduction of small symmetric gaps induces a non-monotonic behaviour in normalised shock stand-off distance with spacing due to the emergence of a new dome-like structure in the shocked region.
• Linear trends in shock stand-off distance variation with Froude number are identified in an otherwise nonlinear problem for a small range of parameters. These are used to obtain an empirical rule to estimate the normalised shock stand-off distance in that domain.
• A typical velocity distribution is presented in such configurations with velocity profiles in some interesting regions, which came out to be nonlinear.
• Present study shows that the shock stand-off distance or the heap size is a linear function of the mass flux irrespective of the wedge spacing.
• The present study demonstrates that the dynamics of granular shocks on multiple obstacles is much more complicated than that of a single obstacle. Some of the recent modelling techniques based on shallow flow continuum equations (see Cui & Gray Reference Cui and Gray2013; Johnson Reference Johnson2020; Tregaskis et al. Reference Tregaskis, Johnson, Cui and Gray2022) may be used to model and shed further light on many of the complicated flow features observed in these experiments.
Supplementary movies
Supplementary movies are available at https://doi.org/10.1017/jfm.2023.211.
Funding
This research was supported by Science and Engineering Research Board (SERB) through grant no. CRG/2020/000504.
Declaration of interests
The authors report no conflict of interest.


 Open access