


Introduction
In the winter of 1940, during the U.S. Antarctic Service Expedition, Reference WadeWade (1945) dug a pit into the floor of the ice laboratory at Little America III and installed three compression meters of the type designed by Reference Sorge and BrockampSorge (1935) in Eismitte, and later used by Reference MossMoss (1938) in Nordaustlandet and by Hughes and Seligman (1940) on the Mönchfirn. The compression meters were read until 8 January 1941, and left on the spot. Six years later, in January 1947, the pit was visited briefly by Reference HowardHoward (1948) during the U.S. Navy Antarctic Expedition 1946–47. All three compression meters were found broken, but remeasurements of the vertical intervals between their basal blocks were performed. Ten years later, on 12 March 1957, the present author, then a member of the USNC-IGY Antarctic Expedition 1956–58, had the opportunity to visit Little America III, and again on 17 November 1957, and on 29 January 1958. The station could be found because nine aerials still protrude through the otherwise undisturbed snow surface (Fig. 1, p. 112); all the buildings were accessible despite ten meters of snow accumulation above the 1940 surface. Thus the compression meters could he remeasured during the last visit, seventeen and a half years after they had been installed. This gave the rare opportunity of analyzing the settling of firn over a period of time longer than any other analyzed so far. Although there is some disturbance in the process of settling to be expected from the buildings of Little America III, the true picture might not be altered too much, at least not for the years after the station had been buried.

Fig. 1. The entrance to Little America III Station, Ross Ice Shelf, position in 1958 about lat. 78° 26′ S., long. 163° 52′ W.
Deformation of the Pit
The original dimensions of the pit as given by Reference WadeWade (1945) were 2 m. × 2m. × 7m. It was situated just outside the main building, near its north-west corner, and the ice laboratory was constructed around it. Reference HowardHoward (1948) reported the depth of the pit to be only 5 m., but since “there is an accumulation of about 2 ft. of ice rubble in the base of the pit”, the depth in January 1947 amounted to about 5.7 m. He observed the rim of the shaft to be about 1 ft. lower in the north-west corner than in the south-east corner, the walls of the shaft essentially plumb, but did not mention any changes with respect to the cross-section. In March 1957 the measured depth of the pit was 4.5 m., and, including the ice rubble, the entire depth should be about 5 m. Within seventeen years the depth of the pit has decreased from 7 to 5 m. which compares well with the amount of compaction as derived from the remeasurement of the compression meters (see next section). Table I shows the horizontal dimensions of the pit on 29 January 1958; they have diminished throughout, but considerably less for the east and west walls than for the north and south walls, and less for the top than for the bottom of the pit. Thus, the cross-section of the pit has changed from square to rectangular. Since the walls are slightly bent inwards, the corners of the pit are no longer right angles but rather acute ones. This is indicated on plate 1 in Howard’s report, but shows more clearly on Figure 2, taken on 17 November 1957. Due to irregularities in the walls the figures given in Table I are not accurate to the nearest centimetre, however they indicate clearly that the closing of the pit is or was overlaid by horizontal compressive stresses, acting roughly in an east-west direction. Only 15 km. south of Little America III, in the Camp Michigan area, very heavy horizontal stresses cause the formation of numerous firn anticlines with nearly parallel axes, roughly in north-south direction, which were studied in detail by J. H. Zumberge and others Reference Zumberge(1960). Although the present author does not remember any firn anticlines near Little America III, some minor compressive stress apparently acts in the same direction.
Table 1. Horizontal Dimensions of Pit in Metres

Wade observed vertical rows of closely spaced pins inserted in the walls of the shaft, but could not find any indication of differential motion during a three-month period. Since these pins were not found in January 1947, Howard again inserted two vertical rows of 15 cm. nails in the north and east walls of the shaft. Each line included fifteen spikes, which were placed one foot (30.48 cm.) apart. In January 1958 the nails did not show any systematic deviation from the plumb line, except for those caused by the squeezing out of certain firn layers. Figure 2 shows the vertical row of spikes in the east wall, Figure 3 (p. 114) the one in the north wall; the nails stick out on an average of 6.3 cm., but some up to 9 cm. The comparison of Figure 3 with plate 1 of Howard’s report is very interesting: Even minor details of the snow wall, especially below the wooden blocks of the compression meters, are essentially the same after eleven years, indicating the absence of evaporation. This is due to the absence of temperature changes below a depth of 8 to 10 m. On 17 November 1957, a temperature of −23.9° C. was measured in the shaft; according to Reference CourtCourt (1949) the mean annual air temperature at Little America III in 1940 was −23.7° C. Large and beaugiful crystals of hoar frost are restricted to the higher parts of the gangway connecting Little America III and IV, not deeper than about 6 m. below the surface, to which depth annual temperature variations penetrate to some extent.

Fig. 2. Glaciological pit at Little America III, dug in 1940 by Wade. The ladder broke because of contraction to pit due to settling of firn. Compression meters in north wall L1 (top right) L3 (below, partially hidden by ladder), L2 (displaced to the left). Vertical row of nails, placed by Howard in 1947 in east wall (right part of photo). Compare with plate 1 in Howard’s report Reference Howard(1948).

Fig. 3. North wall of pit with broken compression meters. The distances between wooden blocks were measured and analyzed as function of time. Vertical row of nails placed by Howard in 1947 (right part of photo). Comparison with plate 1 in Howard’s report Reference Howard(1948) shows even details of snow wall, especially below wooden blocks, unchanged since 1947.
The Settling of Firn
Three compression meters were originally installed in the north wall of the shaft, and measured the settling over a distance of 2 m. each. The uppermost (L1) was centered at 1.5 m. below the surface of 1940, the middle (L2) at 2.5 m., and the lowest (L3) at 3.5 m. The meters L1 and L3 were installed vertically one above the other; the meter L2 was displaced slightly towards east (see Figures 2 and 3). Howard, in January 1947, fund the three 2 m. intervals to have diminished to 1.61, 1.63 and 1.65 m. respectively, from top to bottom. On 12 March 1957 the distances measured were 1.43, 1.425 and 1.44 m. respectively, and on 29 January 1958 they were 1.421, 1.417 and 1.43 m. respectively. It may be mentioned that all the measurements on 12 March 1957 were taken with a. ruler having a metric scale, whereas on 29 January 1958, in order to avoid any remembrance with respect to the results, a ruler with an inch scale was used.
For each of the compression meters there are five pairs of corresponding values, giving the length of the interval in relation to the time elapsed since the meters were installed (Table II). The average rate of settling of the firn
calculated from differences for the four consecutive time intervals, gives 6.929, 2.852, 1.274 and 0.712 cm./m. yr. respectively. In order to find the law governing the process of settling Table II. Observed and Computed Data for Compression Meters at Little America III of firn in this case, a mathematical expression was fitted to the pairs of values. At first an exponential curve was tried of the type
and the constants were determined by the method of least squares (for details see Reference Brooks and CarruthersBrooks and Carruthers (1953)). For compression meter L1 the constants were a = 144.497 cm., b = 54.358 cm., and c = 0.204 yr.−1 respectively. This expression proved to be insatisfactory, because the limit to which the reduction of the length L by the process of settling is tending cannot be of the order of magnitude given by the constant a. The initial average density for compression meter L1 (−0.5 m. to −2.5 m.), according to Wade, was 0.384 g.cm.−3; thus, the original distance of 200 cm. should be reduced to 85 cm. by settling in order to reach the density of ice.
Table II Observed and Computed Data for Compression Meters at Little America III

A much better fit of the observed data could be obtained by using a logarithmic expression of the type
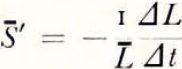
Differentiating (3) one gets

and

from which the best fitting values of 2.303/b and 2.303c/b were determined by substituting for dt/dL ratios of differences ΔL for time intervals Δt = 2 yr., t being the midpoint of the interval. Instead of evaluating the expression −b log (t+c) and calculating the constant a by subtraction from the observed values of L, only the value of the constant c was adopted, and the constant b was determined anew, together with a, from the expression L=a−bi′, where t′ = log(t+c), by least squares. The constants a, b and c, for the three compression meters L1, L2 and L3, are given in Table III. It is interesting to note that constant c (given in years) increases with increasing depth, indicating the earlier beginning of the process of settling in deeper layers of the firn. The agreement between observed and computed values is very satisfactory, as can be seen from Figure 4.
Table III Constants for Logarithmic Expression (3)


Fig. 4. Observed distances (centimetres) between basal blocks of compression meters L1 and L3 as function of time (years), logarithmic expression fitted to the data. Computed rate of settling S in cm./m. yr. and dS/dt (cm./m. yr2, same scale as for S, dotted curves in lower part of graph)
The rate of settling

was computed, using (4), and is shown as a function of time in Figure 4. In order to compare the settling rates as calculated from (1) for differences between single observations, (5) was integrated for the corresponding intervals of time

As can be seen from the values in the Table II, the agreement is good for the two long intervals January 1941 to January 1947 and January 1947 to March 1957, but rather poor for the two short intervals at the beginning and at the end. There is an almost perfect agreement between the average rates of settling for the whole 17.5 yr., indicating the suitability of the logarithmic expression (3) as an interpolation formula.
The change of the rate of settling with time,

shows great differences between compression meters L1 and L3 within the first two years, but becomes more or less uniform for all three compression meters beginning from the fourth year (Table II, and dotted curves in Figure 4). This agrees with Reference SchyttSchytt’s (1958) finding, who by comparison of rates of settling from Eismitte, Little America III (Howard’s value) and Maud-heim reached the conclusion that “differences in specific air content have a very great influence upon the rate of settling, and that this influence decreases rapidly with increasing depth”. A specific air content (0.917–p) below about 0.45 ought to be sufficient to avoid greater differences in the rate of settling, according to the present data.
The fourteen consecutive distances between the fifteen nails, driven into the north and east walls of the shaft by Reference HowardHoward (1948) in January 1947, were remeasured on 29 January 1958. As Figure 5 shows, all the distances have diminished from the original value of 30.48 cm., but surprisingly large deviations exist from the average of 27.90 cm. for the east wall, and 27.62 cm. for the north wall. The layer between spikes No. 6 and 7 (north wall) has settled least, its thickness being 0.968 of the original value, whereas the layer between spikes No. 8 and 9 on the same wall has shrunk most to 0.811 of the original distance. According to Howard there might be an error between each pair of spikes of about

Fig. 5. Distances (centimetres) between each two of fifteen nails in the north and east walls of pit on 29 January 1958. The spikes were placed in two vertical rows by Howard in January 1947. The rows are still essentially plumb, the deviations from the average distance reveal large differences in the rate of settling over short intervals
The Calculation of Average Accumulation
Reference Sorge and BrockampSorge (1935) found at Eismitte, where melting is absent, that the density of snow at a given depth remained constant. Sorge’s Law, as formulated by Reference BaderBader (1954), relates the steady-state condition of the density-depth curve to the accumulation and rate of settling, so that the accumulation can be computed from:

If S is given in cm./cm. yr., and the depth below the surface z in cm., the accumulation A results in g./cm.2 yr. Since melting is certainly insignificant at Little America, Sorge’s Law should be applicable. Figure 6 shows the position of compression meters L1 and L3 relative to the actual surface between 1940 and 1958. Entered into the diagram are density values as determined in the Little America III shaft by Reference WadeWade (1945) in 1940, Reference HowardHoward (1948) in 1947 and BoydFootnote * in 1957, Also entered are densities from a pit dug by Reference VickersVickers (1958) on 29 January 1958, near the entrance to Little America III, down to the “snow cruiser”. Despite the same high scatter of single values they show very nearly the same average density for the upper four metres as was measured by Reference WadeWade (1945) in 1940. These values were used to find an approximation to the density-depth relation (solid line in Figure 6). A possibility of checking the reliability of this simple linear relation was offered by the recent publication of the density determinations at and near Little America V in 1957 and 1958, by Reference CraryCrary (1961). Average densities from numerous shallow pits, average densities for one-metre-intervals from the deep pit, and for five-metre-intervals from the SIPRE drill hole are reported. The adopted linear relation fitted these values very well, except for the lowest two metres (12 to 14 m. depth below the surface of 1958). The linear density-depth relation, used in calculations by Reference CraryCrary (1961) is shown as a broken line in Figure 6.

Fig. 6 Position of compression meters L1 and L3, relative to the actual snow surface, between 1940 and 1958. Density determinations from different sources, and adopted densitty-depth relation (solid line)
With the aid of Sorge’s Law (formula (8)) the accumulation was calculated for the four periods of observation; the result is given in Table IV. For the first two periods a very high accumulation results, as one would expect because of snow drifts forming around the buildings. As Reference HowardHoward (1948) reported “In January 1947, all of the buildings of the expedition of 1939–41 (Little America III) were completely buried, only masts and ventilators projecting above the snow.” Therefore, beginning from 1947, undisturbed accumulation figures should result. The values obtained for these last two intervals give a mean accumulation for the eleven years 1947–58 of 19 g./cm.2 yr., which is probably the right order of magnitude. From the
Table IV Computation of Average Accumulation for Little America III

SIPRE drill hole an average accumulation of 21 g./cm.2 yr. was obtained in the Little America V area for approximately forty years (Crary, 1961). Vickers (1958) arrived at a lower average accumulation of 16.2 g. cm.2 yr. for the eight years 1950–57 near Little America III. From Table IV it is seen that 438 g. of snow accumulated during the 17.6 yr. from July 1940 to January 1958 by adding the results from the single intervals, and 451 g. of snow, if computed with average values for the whole period 1940–58. According to Figure 6, ten metres of snow with an average density of 0.45 g./cm.3, i.e. 450 g. of snow, are resting upon the surface of 1940. The agreement is quite good, if one considers the approximate character of the density-depth relation. Crary’s (1961) strain gauge observations in the deep pit at Little America V, 1957–58, led to similarly reliable accumulation figures, even though the period of observation was rather short, and the measuring site not entirely free from disturbances.
Conclusion
It should be worth while to install strain gauges in covered pits near the permanently occupied Byrd and South Pole stations, and extend the observations over as long a period as possible. The check on the accumulation figures as determined by other means, with Sorge’s Law, seems highly desirable in the interior of Antarctica. Another visit to Wade’s pit at Little America III, before it breaks off, could provide further interesting observations to the problem of densification of firn.
Acknowledgement
The author wishes to acknowledge with gratitude the help and understanding of his friends, both civilian and military, at Little America V, 1957–58, without which this little study could not have been accomplished. Mr. I. Vergeiner participated in the completion of the manuscript.


