


Introduction
Relaxor ferroelectrics (or relaxors in short) are among the most successful electronic ceramics because of their highly attractive dielectric, piezoelectric, pyroelectric, and electrocaloric properties [Reference Cross1, Reference Smolenskii, Isupov, Agranovskaya and Popov2, Reference Uchino3, Reference Kutnjak, Petzelt and Blinc4, Reference Alpay, Mantese, Trolier-McKinstry, Zhang and Whatmore5]. In addition, fundamental understanding of their physicochemical nature has drawn much attention because of various fascinating properties, such as a strong frequency-dependent maximum permittivity temperature (T M), deviation from Curie–Weiss law for ferroelectric phase transition, relatively large ∂P/∂T over a broad temperature range, and a large electromechanical response [Reference Alpay, Mantese, Trolier-McKinstry, Zhang and Whatmore5, Reference Samara6, Reference Bokov and Ye7, Reference Kleemann8]. The behavior of relaxors can be generally attributed to the presence of nanoscale polar clusters with correlated atomic disorder [Reference Fu, Taniguchi, Itoh, Koshihara, Yamamoto and Mori9, Reference Dmowski, Vakhrushev, Jeong, Hehlen, Trouw and Egami10], and in this regard, relaxors can be broadly compared with spin glasses and dipolar glasses [Reference Binder and Young11, Reference Angell12]. Lead (Pb)-based ABO3 perovskites, with the general formula of  ${\rm{Pb}}\left( {{\rm{B'}}_{1{\rm{/}}3}^{2 + }{\rm{B''}}_{2{\rm{/}}3}^{5 + }} \right){{\rm{O}}_3}$ (B′2+ = Mg, Co, Ni, Zn; B″5+ = Nb, Ta) and their solid solutions with prototypical ferroelectric PbTiO3, are the most studied and technologically important relaxor ferroelectrics [Reference Cowley, Gvasaliya, Lushnikov, Roessli and Rotaru13]. However, due to the negative environmental concerns surrounding the presence of Pb, design of new Pb-free relaxors has developed into an important research endeavor in materials science [Reference Shvartsman and Lupascu14]. In this regard, investigation of Pb-free compounds with similar structural characteristics to Pb-based relaxors is a promising approach toward developing new functional materials.
One salient feature of Pb-based relaxors is the existence of cooperative multisite atomic displacements, which are correlated over only nanometer length scales. The cooperative atomic displacements can be understood based on the classical picture provided for  ${\rm{Pb}}\left( {{\rm{B'}}_{1/3}^{2 + }{\rm{B''}}_{2/3}^{5 + }} \right){{\rm{O}}_3}$ relaxors [Reference Chen, Li and Wang15, Reference Davies and Akbas16]. In this model, the octahedral B-site is occupied by two sets of ions: B′2+ ions which are larger and ferroelectrically inactive, and B″5+ ions which are smaller and ferroelectrically active. For certain arrangements of the B′2+ and B″5+ ions, the intermediate oxygen ions can be forced to move toward B″5+, which consequently induces a movement of the A-site cation (Pb2+ in this case) toward B′2+ to form three shorter Pb–O– B′2+ and three longer Pb–O– B″5+ bonds. In this manner, the off-centered displacements of the A-site and B-site ions toward or away from the intermediate oxygen ions can lead to large electrical dipoles. At the same time, a disordered arrangement of B′2+ and B″5+ ensures that the dipoles are correlated over only short distances. The type of cooperative atomic displacements in Pb-based ferroelectrics described above is aided by two factors: (a) hybridization between the empty B″5+ d-orbitals and the O2− p-orbitals, which makes the B″–O bond ferroelectrically active in contrast to the inactive B′–O bond, and (b) the presence of lone pair electrons on Pb2+, which favors the formation of shorter Pb–O bonds and thus accommodates the A-site displacements [Reference Chen, Li and Wang15, Reference Cohen17]. Replication of these mechanisms for Pb-free chemistries can be a rational step for replacement of Pb in many electronic ceramics; nevertheless, such a possibility has not been systematically investigated.
In the present work, we have synthesized and characterized ceramics of a new composition, namely, Nb- and Sn-doped (Ba,Ca)TiO3. BaTiO3 is similar in structure to the prototype Pb-based ferroelectric PbTiO3 near room temperature (RT), i.e., both compounds exhibit a tetragonal crystal structure with relatively large c/a ratio. However, there are significant differences between BaTiO3 and the Pb-based ferroelectrics in terms of chemical bond formations [Reference Cohen17, Reference Cohen and Krakauer18]. In Pb-based ABO3 compounds, the lone-pair 6s electrons on the A-site Pb atoms hybridize strongly with the O-2p orbitals, which reinforces cooperative atomic displacements. By contrast, the Ba–O bond in BaTiO3 is more ionic in nature, which hinders the formation of shorter and longer A–O bonds. Nevertheless, A-site displacements in solid solutions of BaTiO3 could be induced through various mechanisms. One such mechanism is quantum fluctuations, which can be introduced by forming a solid solution with ions of smaller radii. In this case, by substituting Ba2+ with Ca2+, Ca2+ become off-centered along the 〈113〉 direction [Reference Fu, Itoh, Koshihara, Kosugi and Tsuneyuki19]. Another possibility is the stereochemical effect, which is introduced by incorporating small amounts of Sn2+ at the A site of BaTiO3. Similar to Pb2+, Sn2+ has a lone-pair of electrons, and thus it can be expected to increase A–O bond covalency and consequently lead to off-centered atomic displacements [Reference Suzuki, Takeda, Ando and Tkagi20, Reference Laurita, Page, Suzuki and Sehadri21]. Exclusive inclusion of Sn2+ onto the A site is however difficult because of disproportion of Sn2+ and Sn4+. Here, it has to be noted that a natural distribution between the two oxidation states has been reported earlier [Reference Moreno, Punte, Rigotti, Mercader, Weisz and Blesa22, Reference Kwoka, Ottaviano, Passacantando, Santucci, Czempik and Szuber23], and such a distribution can also be expected for Sn-doped (Ba,Ca)TiO3 [Reference Suzuki, Takeda, Ando, Oyama, Wada, Niimi and Takagi24].
To induce cooperative atomic displacements as indicated in Fig. 1, we need to introduce different ions at the B site of BaTiO3, which form bonds to oxygen with different degrees of covalency [Reference Chen, Li and Wang15, Reference Davies and Akbas16]. As shown earlier by Cohen, hybridization between the empty d-orbitals of the transition metal ions and oxygen 2p states can form strong covalent bonds and stabilize ferroelectricity [Reference Cohen17]. Here, Nb5+ is introduced at the B site to form stronger covalent bonds with oxygen. At the same time, Sn4+ at the B site is expected to form weakly covalent bonds because of lack of d and p orbitals’ hybridization. In such a scenario, the larger O anions can be expected to move closer to Nb5+ ions and away from the Sn4+ ions, thereby facilitating the off-centered displacements of the A-site cations. The proposed mechanism is illustrated in Fig. 1.

Figure 1: Proposed substitution scheme for BaTiO3 to induce multisite atomic displacements.
Following the ideas outlined earlier, we successfully designed a solid solution composition of Nb- and Sn-doped (Ba,Ca)TiO3 that exhibits relaxor-like properties with temperature for maximum permittivity (T m) near RT. The relaxor-like properties of the material are confirmed from dielectric spectroscopy, specific heat capacity, and piezo force microscopy (PFM) measurements. The dielectric permittivity spectrum showed two anomalies, as evident from a peak at T m ∼ 300 K and a broad shoulder at a lower temperature T s ∼ 270 K. These two anomalies can be correlated to temperature dependent transition to a tetragonal polar phase and further increase in tetragonality in the polar phase, respectively, which are characterized from synchrotron X-ray diffraction. The pyroelectric coefficient (∂P/∂T) and electrocaloric properties for this material are furthermore examined. Interestingly, the material exhibits two peaks for temperature dependence of pyroelectric coefficient with values of -(∂P/∂T) ∼ 563 µC/(m2 K) at T ∼ 270 K and -(∂P/∂T) ∼ 1021 µC/(m2 K) at T ∼ 320 K, which correlates to the temperature-dependent structural changes. In addition, a broad peak for electrocaloric temperature change near 320 K is predicted from Maxwell relations, which gives rise to a high relative cooling power of ∼17 J/kg. The study shows that length scale–specific structural changes can be induced at different temperature ranges in this material, which can be selectively used for pyroelectric energy harvesting or electrocaloric cooling.
Results and discussion
Dielectric properties
The real part of dielectric permittivity (ε′) and dissipation factor (tan δ) of the BCST-Nb0.04 samples were measured in the frequency (f) range of 100 Hz ≤ f ≤ 100 kHz and for temperature (T) range of 173–373 K. The results are shown in Fig. 2(a). The ε′ versus T curve exhibits a main peak at T m ∼ 300 K, whereas an additional shoulder (T s) is noticed between 225 and 270 K. We also observe that T m shifts up by 2.5 K, and the maximum permittivity at ∼T m decreases in magnitude, when the frequency is increased from 0.1 to 100 kHz. This behavior provides evidence of the relaxor-like behavior for the BCST-Nb0.04 ceramics [Reference Cowley, Gvasaliya, Lushnikov, Roessli and Rotaru13, Reference Shirane, Axe, Harada and Remeika25, Reference Cowley26, Reference Kakimoto, Masuda and Oshato27].

Figure 2: (a) Temperature-dependent real part of dielectric permittivity εʹ(T) and dissipation factor (tan δ) of BCST-Nb0.04 ceramics measured at various frequencies (100 Hz ≤ f ≤ 100 kHz). (b) The logarithmic inverse frequency variation of transition temperature T m (shown by round symbols) and the corresponding solid continuous line is the best fit to the Vogel–Fulcher law. (c) Specific heat measurement shows a broad hump in the temperature range of 305–328 K. Such broad phase transition is typically observed for ferroelectrics which deviate from Curie–Weiss law.
In the case of normal ferroelectrics, the temperature-dependent dielectric permittivity follows the Curie–Weiss law; 1/ε′ = (T − T C)/C, where C is the Curie constant and T C is the Curie–Weiss temperature [Reference Jonker28]. By contrast, the relaxation of the electric dipoles can lead to significant deviation from Curie–Weiss law above T m [Reference Wu, Wang and Li29]. In such cases, ε′ (T) can be modeled following the Uchino and Nomura formula, also known as the modified Curie–Weiss law [Reference Uchino and Nomura30].
 $$\left( {{1 \over {\varepsilon '}} - {1 \over {{\varepsilon _{\rm{m}}}}}} \right) = {{{{\left( {T - {T_{\rm{m}}}} \right)}^\gamma }} \over C}\quad ,$$
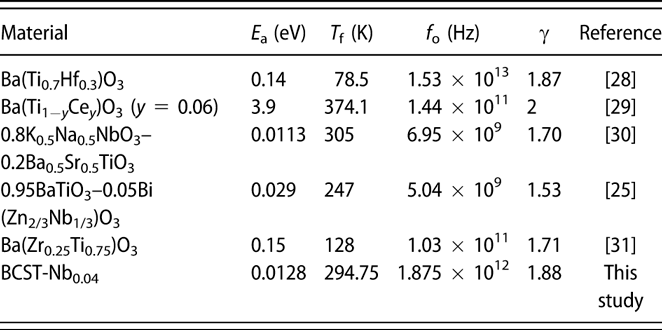
where εm is the maximum of ε′ at T m, and the coefficient γ represents the degree of diffuseness for the transition across T m. γ is equal to 1 for normal ferroelectric behavior, and it varies between 1 and 2 for relaxor ferroelectrics [Reference Uchino and Nomura30]. Accordingly, the γ value has been evaluated from the slope of the log(1/ε′ − 1/ε′m) versus log(T − T m) graph, (see Supplementary material Fig. S1). The obtained value of γ for the BCST-Nb0.04 ceramics is 1.89 ± 0.01 (f = 1 kHz) (γ is close to 2 at higher frequencies), which is comparable to that of other Pb-free ferroelectric relaxors listed in Table I [Reference Wu, Wang and Li29, Reference Diez-Betriu, Garcia, Ostos, Boya, Ochoa, Mestres and Perez31, Reference Anwar, Sagdeo and Lalla32, Reference Ang, Jing and Yu33, Reference Du, Zhou, Luo, Zhu, Qu and Pei34, Reference Badapanda, Rout, Cavalcante, Sczancoski, Panigrahi, Longo and Li35]. The critical exponent γ depends on the underlying ordering mechanism; γ ∼ 1 for pure Curie–Weiss behavior or mean field theory, γ ∼ 1.3 for 3D random bond Ising model, whereas γ is higher for random field Ising models and approaches values close to 2 [Reference Jug36, Reference Reiger37, Reference Kleemann, Dec, Lehnen, Blinc, Zalar and Pankrath38]. The relatively high values of γ for the current material and others listed in Table I might be related to the strong random field interactions in these materials, although it needs to be carefully evaluated with high-precision dielectric measurements over broader frequency ranges.
TABLE I: Comparison of various parameters of Pb-free perovskite relaxor ferroelectrics along with results from the present study.
To further examine the relaxor behavior in this material, we analyze the frequency dispersive dielectric permittivity using Arrhenius model and Vogel–Fulcher model [Reference Vogel39, Reference Fulcher40]. The unphysical parameters obtained from the fitting analysis using Arrhenius model (shown in Supplementary material Fig. S2) indicate that dipole dynamics appear only above the freezing temperature (T f). The concept of T f, which is similar to spin or dipolar glass, is incorporated in the Vogel–Fulcher model and can be expressed as [Reference Ogihara, Randall and Trolier-McKinstry41]
 $$\omega = {\omega _{\rm{o}}}\exp \left[ {{{ - {E_{\rm{a}}}} \over {{k_{\rm{B}}}\left( {{T_{\rm{m}}} - {T_{\rm{f}}}} \right)}}} \right]\quad ,$$
where ω = 2πf (f = is the measured frequency), ωo = 2πf o, (f o = is the attempt jump frequency), E a is the activation energy, and k B are the Boltzman constant. Figure 2(b) shows fitting of the dielectric permittivity data using Vogel–Fulcher model. From the analysis, we obtained E a = 0.012 ± 0.001 eV, f o = 1.88 × 10¹² Hz, and T f = 294.75 ± 2 K. Corresponding values for other relaxor ferroelectrics are also listed in Table I. The attempt jump frequency obtained in the present case are similar those observed for relaxor ferroelectrics, which lies between 109 Hz and 1014 Hz [Reference Cowley, Gvasaliya, Lushnikov, Roessli and Rotaru13, Reference Vogel39, Reference Fulcher40, Reference Ogihara, Randall and Trolier-McKinstry41]. The value of E a of BCST-Nb0.04 is quite low compared with other Pb-free relaxor materials, e.g., 0.95BaTiO3–0.05Bi(Zn2/3Nb1/3)O3 [Reference Wu, Wang and Li29] and 0.8K0.5Na0.5NbO3–0.2Ba0.5Sr0.5TiO3 [Reference Du, Zhou, Luo, Zhu, Qu and Pei34], and signifies easier reorientation of local dipoles in the BCST-Nb0.04 ceramics.
The microscopic phase below T m can be furthermore ascertained from specific heat measurements. For transition below T m from polar nano regions (PNR) to a ferroelectric state with nanoscale domains, one can expect heat capacity C p in excess of what is predicted from classical thermodynamic laws [Reference Moriya, Kawaji, Tojo and Atake42, Reference Novak, Pirc, Wencka and Kutnjak43]. By contrast, if no excess heat capacity is observed near T m, the nanoscale ferroelectric model can be dismissed in favor of a transition to a dipolar glass state. For the present system, a broad anomaly in the form of excess C p is observed in the range of 305–328 K [Fig. 2(c)], which indicates transition from PNRs at higher temperatures to ferroelectric domains below T m. Nevertheless, the rather weak and broad nature of the peak for excess specific heat point to the lack of establishment of a true long-range order [Reference Nayak, Dasari, Joshi, Pramanik, Palai, Waske, Chauhan, Tiwari, Sarkar and Thota44]. Piezoresponse force microscopy corroborates the findings above as only nanoscale domains can be observed at RT (see Fig. S3 in Supplementary material).
Analysis of average and local atomic structures
The structural transitions accompanying the different anomalies observed in the dielectric spectrum are analyzed using X-ray diffraction and total scattering data, as presented below.
Average atomic structure
The average atomic structure was modeled from the X-ray diffraction patterns in the temperature range of 220 K ≤ T ≤ 380 K using Rietveld refinement implemented in the FULLPROF suite software [Reference Rodríguez-Carvajal45]. First, to determine if Sn disproportionate into Sn2+ and Sn4+ oxidation states, we performed the X-ray photoelectron spectroscopy (XPS) measurements. The XPS spectra of BCST-Nb0.04 along with the pure SnO (Sn2+) and SnO2 (Sn4+) are shown in the Supplementary material Fig. S4. Two peaks are observed for Sn in BCST-Nb0.04 ceramics, indicated as Sn-3d 5/2 and 3d 3/2. A high energy tail is present on the 3d 3/2 peak, indicating that both oxidation states are present in the compound. Both peaks are deconvoluted into two peaks centered at 485.48 eV (P1) and 485.68 eV (P2), and 493.93 eV (P3) and 495.15 eV (P4), respectively. Peaks P1 and P3 correspond to Sn2+, and peaks P2 and P4 correspond to Sn4+. All of these closely match the reference energies obtained from SnO and SnO2 [Reference Manikandan, Tanabe, Li, Ueda, Ramesh, Kodiyath, Wang, Hara, Dakshanamoorthy, Ishihara, Ariga, Ye, Umezawa and Abe46, Reference Vysochanskii, Baltrunas, Grabar, Mazeika, Fedyo and Sudavicius47]. From peak fitting analysis of XPS data, we estimate close to equal concentration of Sn2+ and Sn4+ (Sn2+:Sn4+ = 0.57:0.43). These values are therefore used as initial parameters for concentration of Sn2+ and Sn4+ in Rietveld models.
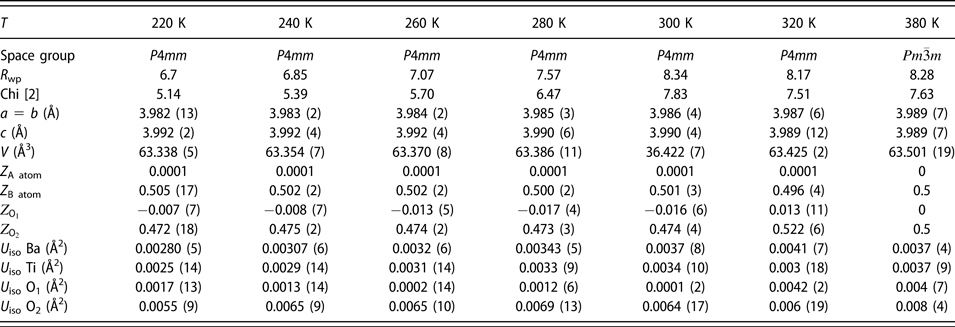
Figure 3(a) shows a representative fit for the diffraction pattern measured at 300 K. The peaks were fit using a Pseudo-Voigt profile. The background was fitted with a Chebychev polynomial. The scale factor, zero-point correction, isotropic thermal parameters, lattice parameters, and positional coordinates were refined. It was observed that from 220 to 360 K, the best fit was achieved for a tetragonal phase with P4mm space group, whereas for 380 K, the best fit was achieved for a cubic phase with the  $Pm\bar{3}m$ space group. All the structural parameters obtained from the final Rietveld refinement analysis are listed in Table II. Figure 3(b) shows “tetragonality” or “c/a” ratio of the structure as a function of temperature. The c/a ratio increases with decreasing temperature. However, the increase in not linear and a sharper increase is observed below T ∼ 270 K. The nonlinear deviation in the c/a ratio of the average structure below 270 K is most likely due to an increase in the medium–range correlations arising as a result of growth of polar nanodomains. The onset of nonlinear increase in tetragonality coincides with T s in Fig. 2(a).
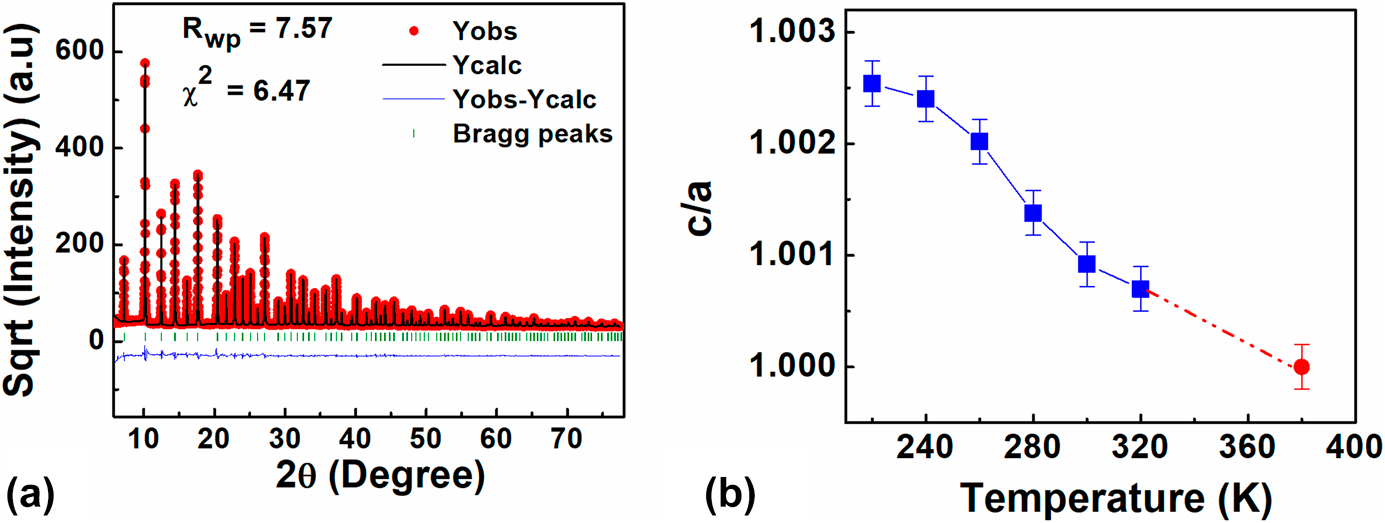
Figure 3: (a) The measured X-ray diffraction pattern of BCST-Nb0.04 ceramics at RT along with the calculated pattern from Rietveld refinement. (b) The temperature-dependent change in tetragonality (c/a) of the unit cell. The dotted line in between 320 and 380 K indicates that no diffraction data were collected in this temperature range, and therefore no claim for structural changes in this range is made.
TABLE II: List of structural parameters obtained from Rietveld refinement of Ba0.77Ca0.21Sn0.02(Ti0.94Nb0.04Sn0.02)O3.
Above 320 K, we use dotted line to show the variation in c/a ratio because no diffraction data were measured in the intervening temperatures. Nevertheless, the temperature-dependent C p measurement [Fig. 2(c)] shows an anomaly beginning at 328 K, which closely corresponds to the starting temperature for transition from cubic to tetragonal structure.
Local structure analysis from X-ray total scattering
The temperature-dependent evolution of the local atomic structure within the polar nanodomains are analyzed using the X-ray pair distribution function (PDF) method [Reference Egami and Billinge48]. Figure 4(a) shows the PDFs in the region 1.5 < r < 9.5 Å (full range shown in Fig. S5), in the temperature range of 80–400 K. Each of the different bond lengths contained within a single unit cell is labeled. The bond between the A-site and the 2nd nearest B-site atoms is also included because of its close proximity to the M–M3 bond. The peaks between 8.3 < r < 9.5 Å correspond to contributions from all possible ionic pairs and relate to the medium range order [Reference Jeong, Darling, Lee, Proffen, Heffner, Park, Hong, Dmowski and Egami49].

Figure 4: X-ray PDF results for BCST-Nb0.04 (a) The temperature evolution of the PDF over the local-scale structural region with 2 unit-cell inset illustrating bonds between A and B sites (A–B) and bonds between equivalent A–A or B–B sites, labeled as M–M. The subscript numbers refer to the shortest–longest bond lengths, respectively. (b) Rietveld PDF refinement results at 300 K, with orthorhombic, tetragonal, and cubic fits overlaid on the raw data and difference plots below. (c) Pseudocubic equivalent lattice parameters from whole and box-car orthorhombic PDF refinements at 100, 200, 280, and 300 K. Markers correspond to the box-car refinements and are plotted with respect to the center of the box r-range, whereas the horizontal lines correspond to the lattice parameters from fitting the whole PDF. Vertical lines on the markers correspond to the error bars.
At 80 K, each peak is well defined, and small peaks corresponding to split in A–O bond lengths are visible. A split in the A–O PDF peak demonstrates that substitution of Ca2+ and Sn2+ at the A site breaks the degeneracy of the A–O bond distances. At higher temperatures, the thermal motion increases, causing this detail to “smooth” out. Rietveld-type fits of the whole PDF data across the region 1.0 < r < 60.0 Å were carried out using the software TOPAS [Reference Evans50]. Representative fits are shown in Fig. 4(b) at 300 K for models of orthorhombic (Amm2), tetragonal (P4mm), and cubic  $\left( {Pm\bar{3}m} \right)$ symmetries [Reference Coelho, Chater and Kern51]. The residuals show that the orthorhombic structure produces the best fit. This indicates that although the long-range average structure (from Rietveld refinement of X-ray diffraction data) shows tetragonal symmetry, the local structure appears to have orthorhombic distortions. Similar behavior was also reported earlier by Laurita et al. for inclusion of Sn2+ at the A site, even at very small concentrations [Reference Laurita, Page, Suzuki and Sehadri21].
To further assess the length scales of the distortions, present in the structure, orthorhombic box car refinements were performed, and the results are shown in Fig. 4(c). Here, fitting boxes with r-ranges of 6.5 Å starting from 1 Å and overlapped by 0.5 Å were used. To have a clear comparison with the pseudotetragonal perovskite structure, the monoclinic equivalent lattice parameters were calculated for the orthorhombic unit cell [Reference Jaffe52]. Interestingly, the short-range lattice parameters are smaller than the long-range average, which then tends toward average values with the increase in r. An explanation could be that the A- and B-site atoms have both positive and negative local correlations that result in the nearest-neighbor A–B and M–M peaks to display an overall cubic local structure, see Fig. 4(a). This indicates that the short-range atomic correlations in this material are significantly more complicated than an orthorhombic model, which is rather unusual compared with other box-car studies based on relaxors [Reference Usher, Iamsasri, Forrester, Raengthon, Triamnak, Cann and Jones53] and warrants further investigation via other techniques, e.g., neutron PDF, and EXAFS or big box modeling.
Hysteresis loops and electrothermal properties
Relaxor ferroelectrics exhibit attractive electrothermal properties, viz. pyroelectric and electrocaloric effects. The pyroelectric effect is defined as a change in spontaneous polarization as function of temperature. The resultant short-circuit pyroelectric current i p is given by
 $${i_{\rm{p}}} = A\left( {{{\partial P} \over {\partial T}}} \right)\left( {{{{\rm{d}}T} \over {{\rm{d}}t}}} \right)\quad ,$$
where A is a constant, ∂P/∂T is the pyroelectric coefficient P(T) and dT/dt is the temporal rate of change in temperature. In recent years, pyroelectric effect has received much attention for potential application to recover electrical energy from waste heat [Reference Alpay, Mantese, Trolier-McKinstry, Zhang and Whatmore5]. The converse of pyroelectric effect is the electrocaloric effect or reversible change in temperature as a function of applied electric field. It is well known that the electrocaloric effect and pyroelectricity are related by the Maxwell relation in thermodynamics, and it can be expressed as:
 $${\left( {{{\partial {P_{}}} \over {\partial T}}} \right)_E} = {\left( {{{\partial S} \over {\partial E}}} \right)_T}\quad ,$$
where S is the entropy, E is the applied electric field, and P is the total macroscopic polarization. Using the above relation, we can calculate the adiabatic temperature change ΔT and isothermal entropy change ΔS from the following equations:
 $$\Delta T = - {1 \over {{C_{\rm{p}}}\rho }}{\int_{{E_1}}^{{E_2}} {T\left( {{{\partial P} \over {\partial T}}} \right)} _{\rm{E}}}{\rm{d}}E\quad ,$$
 $$\Delta S = - {1 \over \rho }{\int_{{E_1}}^{{E_2}} {\left( {{{\partial {P_{}}} \over {\partial T}}} \right)} _E}{\rm{d}}E\quad ,$$
where P is the polarization, ρ is the mass density, T is the absolute temperature, E 1 and E 2 are the starting and final values of the electric fields, respectively, and C p is the heat capacity [Reference Scott54]. It can be seen that a large (∂P/∂T) over a broad temperature range is desirable for both pyroelectric energy recovery as well as electrocaloric applications. In this regard, the attractiveness of relaxor ferroelectrics becomes clear, as they exhibit a broad permittivity peak and relatively large slope of (∂P/∂T) over a broad temperature range.
To characterize the electrothermal properties of BCST-Nb0.04 ceramics, the polarization versus electric field (P–E) loops were recorded under ac fields of frequency 10 Hz and field amplitude of 50 kV [Fig. 5(a)]. To avoid electrothermal history, after measuring the P–E loop at each temperature, the sample was again heated to the paraelectric state (>50 °C) and then cooled down to the next desired measuring temperature. The remnant polarization (P max) and maximum polarization (P r) were extracted from the P–E loops. The results are shown in Figs. 5(b) and 5(c), respectively. Several interesting features can be noted from the temperature-dependent P max (T) and P r (T) curves. P max first increases and then decreases with increasing temperature, with the inflection point located at T s ∼ 270 K. The P r (T) continuously decreases with increasing temperature up to 320 K except for a deviation at T s ∼ 270 K. A small increase in P r appears above 320 K, which is an experimental artifact due to increase in leakage current. Above T m, decaying trends for both P max and P r are observed, which indicates deviation from long-range ordered ferroelectric state [Reference Bowen, Taylor, LeBoulbar, Zabek, Chauhan and Vaish55].
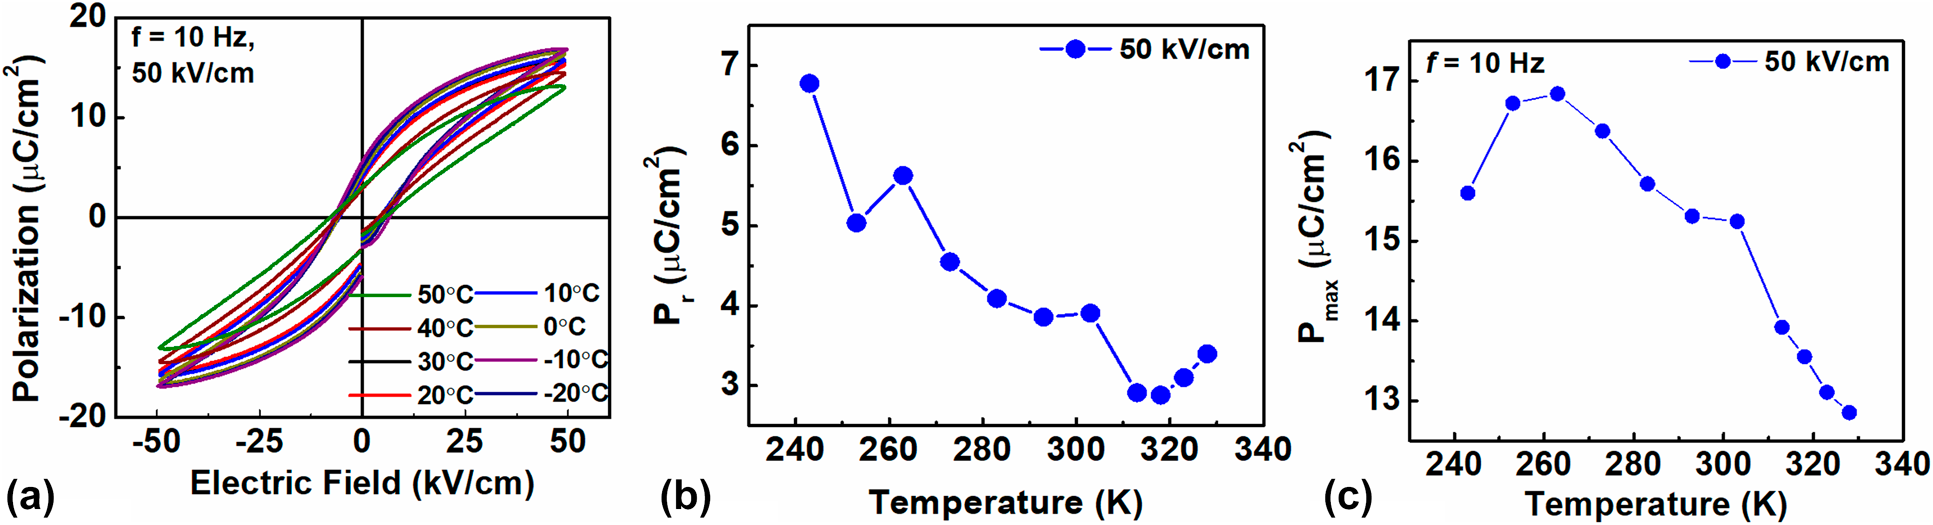
Figure 5: (a) P–E loops of BCST-Nb0.04 ceramics measured at selected temperatures for applied electric fields of frequency 10 Hz. (b, c) temperature-dependent changes in remanent polarization (P r) (b), and maximum polarization (P max) (c), which are obtained from the P–E loops.

Figure 6: (L.H.S) Pyroelectric coefficient, i.e., −(∂P/∂T) as a function of temperature. (R.H.S.) Change in tetragonality “c/a” as a function of temperature.
The pyroelectric coefficient (∂P/∂T) calculated from the P max (T) curve is shown in Fig. 6. A broad peak for pyroelectric coefficient near T s ∼ 270 K with -(∂P/∂T) ∼ 563 µC/(m2 K) essentially results from an inflection in the P max versus T curve at this temperature. We note that this also correlates with nonlinear increase in c/a ratio near T s ∼ 270 K, which is likely due to transition to longer range domains. Similar equivalence between temperature-dependent and field-dependent transitions to longer range correlations was noted earlier for the prototypical relaxor PMN [Reference Rodríguez-Carvajal45]. Therefore, we propose that the broad peak for ΔT at 270 K is likely due to enhanced susceptibility for electric field–induced growth of polar nanodomains. We observed a second peak for pyroelectric coefficient at T m ∼ 320 K with -(∂P/∂T)E ∼ 1021 µC/(m2 K). The second peak can be correlated to the excess C p observed at ∼320 K, where the system transforms from a cubic to a tetragonal structure as evident from analysis of the average crystallographic structure.
The two broad peaks for pyroelectric coefficient observed in the range of 270–325 K can be potentially useful for energy harvesting by utilizing the induced pyroelectric current from large thermal fluctuations, as indicated by Eq. (3). A useful figure of merit (FOM) for pyroelectric energy harvesting is given by [Reference Bowen, Taylor, LeBoulbar, Zabek, Chauhan and Vaish55]
 $${F_{\rm{E}}} = {{{{\left( {{{\partial P} / {\partial T}}} \right)}^2}} \over \varepsilon }\quad .$$
Using Eq. (7), we obtain F E ∼ 6.5 J/(m3 K2) for the peak at T ∼ 270 K and F E ∼ 17.5 J/(m3 K2) for the peak at T ∼ 320 K, which are comparable to the values for Pb-based ferroelectric materials [Reference Bowen, Taylor, LeBoulbar, Zabek, Chauhan and Vaish55].
The electrocaloric temperature change (ΔT) and isothermal entropy change (ΔS) for BCST-Nb0.04 ceramics are calculated using Eqs. (5) and (6) and using data shown in Fig. 6. The values for ΔT and ΔS obtained using Maxwell equations are shown in Figs. 7(a) and 7(b). A peak value of ΔT ∼ 0.6 K is predicted at 320 K from Maxwell relations, which is comparable to several Pb-based and Pb-free relaxors [Reference Sanlialp, Shvartsman, Acosta and Lupascu56, Reference Valant57, Reference Goupil, Berenov, Axelsson, Valant and Alford58, Reference Molin, Sanlialp, Shvartsman, Lupascu, Neumeister, Schönecker and Gebhardt59]. Furthermore, direct measurements of electrocaloric temperature changes were also obtained for comparison with those calculated using Eq. (5), which are shown in Fig. 7(c). The values of ΔT obtained from direct measurements are slightly smaller than those obtained from indirect measurements, which could be related to limitations in reaching equilibrium conditions as necessary for application of Maxwell relations. For temperatures above 300 K, it was not possible to reliably determine ΔT from direct measurements due to Joule heating.
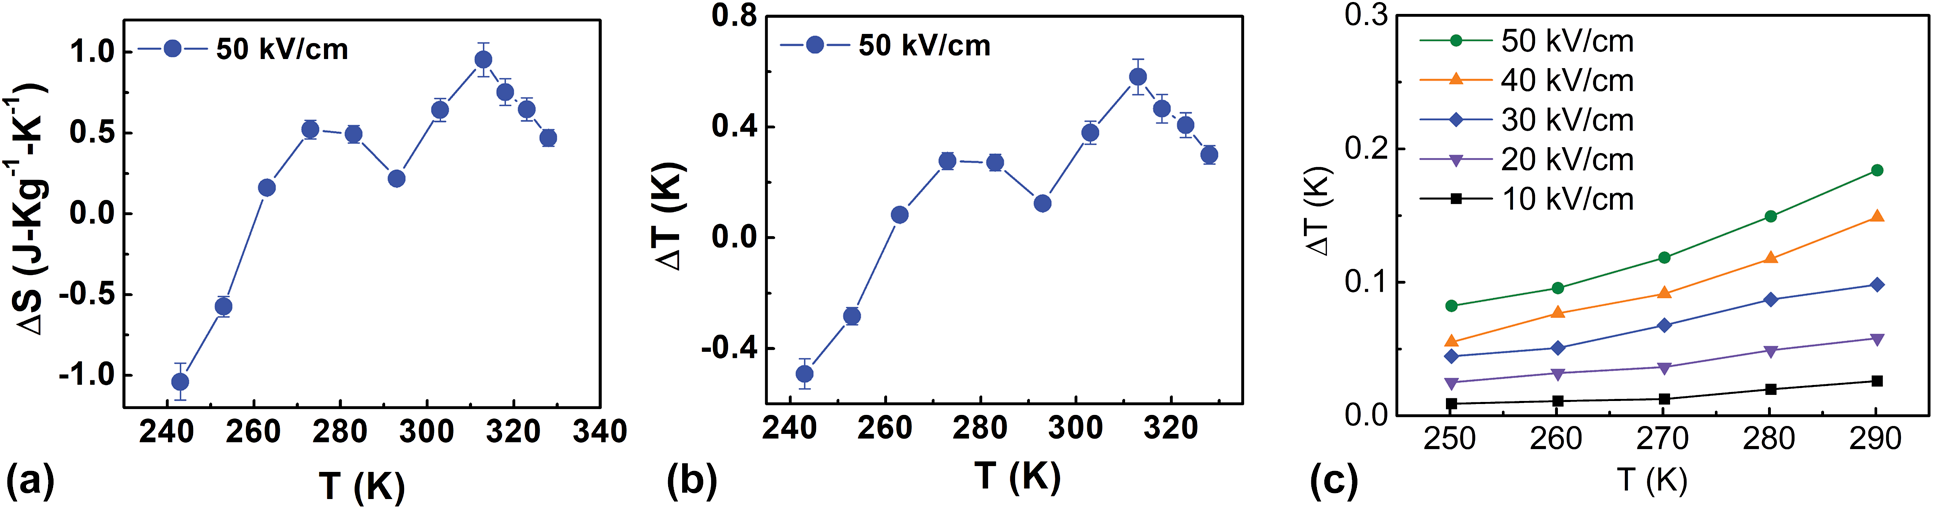
Figure 7: (a) Entropy change (ΔS) under applied electric field as a function of temperature for BCST-Nb0.04 ceramics. (b) Corresponding electrocaloric temperature changes (ΔT) as function of temperature. Results shown in (a, b) are obtained from P–E loops by application of Maxwell relations. (c) ΔT measured directly as a function of temperature.
One interesting aspect to note is that application of Maxwell relations below 270 K results in a negative ΔT. Nevertheless, no negative electrocaloric temperature change was observed in direct measurements. Similar discrepancies between direct and indirect measurements were noted earlier, such as Refs. Reference Sanlialp, Shvartsman, Acosta and Lupascu56 and Reference Goupil, Bennett, Axelsson, Valant, Berenov, Bell, Comyn and Alford60. In most cases, this discrepancy originates from peculiar polarization behavior (related to change in domain structure), which results in a different P(T) relations. In the present case, the negative ΔT below 270 K could be related to the growth of the polar nanodomain structure below this temperature, which is indicated from X-ray structural analysis as presented in section “Analysis of average and local atomic structures”.
A broader temperature range for large (∂P/∂T) is desirable for cooling applications. Classical ferroelectrics with sharp first-order transitions typically result in a higher electrocaloric temperature change due to higher contribution from latent heat, although the temperature span of high properties is typically limited only to about 10 K [Reference Novak, Kutnjak and Pirc61, Reference Weyland, Perez-Moyet, Rossetti and Novak62]. On the other hand, in relaxor ferroelectrics, the temperature span of higher electrocaloric properties is wider (30 K or more) [Reference Novak, Kutnjak and Pirc61, Reference Mischenko, Zhang, Whatmore, Scott and Mathur63, Reference Qiu, Thompson and Billinge65]. This is because of the ergodic temperature range of relaxors, where transition between relaxor and ferroelectric phase is reversible. However, the ECE temperature change in relaxor system is typically smaller than that in ferroelectrics because of smaller latent heat contribution when the ferroelectric phase is induced. Therefore, for a fair comparison of usefulness of electrocaloric materials for refrigeration applications, it is imperative to calculate the relative cooling power or refrigeration capacity (RC), which is given by the following equation:
 $${\rm{RC}} = \int_{{T_1}}^{{T_2}} {\Delta S\left( T \right)} {\rm{d}}T\quad .$$
To calculate RC, we integrated the area under the ΔS(T) peak at T ∼ 320 K [Fig. 7(a)] over full-width at half-maxima (FWHM) (T 1 = 303.8 K and T 2 = 321.6 K). A value of RC ∼ 17 J/kg is obtained for the current material using Eq. (8), which is higher than the value of RC ∼ 11.87 J/kg reported for Pb-based relaxors [Reference Molin, Sanlialp, Shvartsman, Lupascu, Neumeister, Schönecker and Gebhardt59].
Conclusion
A new Pb-free relaxor system was obtained by adopting a combined A- and B-site substitution scheme in the prototypical ferroelectric BaTiO3. The dielectric spectrum of this material shows a peak permittivity at T m ∼ 298 K (f = 1 kHz) along with a broad shoulder at T s ∼ 270 K. The frequency dispersive behavior in the ε′(T) follows the Uchino and Nomura and Vogel–Fulcher relations, which further informs about the relaxor ferroelectric behavior. Existence of an anomaly in the temperature dependence of C p, as well as Rietveld analysis of high-resolution X-ray diffraction data, indicates that below T m, the material transforms from a cubic to an average tetragonal phase. Analysis of local structure from X-Ray PDF shows that in short-range scale <9 Å, the local structure is close to orthorhombic and remains unchanged in the temperature range 100–300 K. In addition, a strong nonlinear deviation in the temperature dependence of the c/a ratio of the average tetragonal phase is observed below T s ∼ 270 K, which is likely associated with an increase in the size of polar nanodomains. The temperature-dependent structural transitions can be correlated to the electrothermal properties of the material. Based on temperature-dependent polarization measurements, we observed two peaks in the (∂P/∂T) curve in the temperature range of 250–320 K: (i) -(∂P/∂T) ∼ 563 µC/(m2 K) at T ∼ 270 K, and (ii) -(∂P/∂T) ∼ 1021 µC/(m2 K) at T ∼ 320 K. In addition, the broad peak in (∂P/∂T) near T ∼ 320 K gives rise to a large electrocaloric temperature change with relative cooling power of ∼17 J/kg. These properties make BCST-Nb0.04, a potential candidate for pyroelectric energy harvesting and electrocaloric cooling over broad temperature range.
Methods
Material synthesis
Polycrystalline Ba0.77Ca0.21Sn0.02(Ti0.94Nb0.04Sn0.02)O3(BCST-Nb0.04) ceramics were prepared using solid-state synthesis from high-purity BaCO3 (99.5%), CaCO3 (99%), SnO2(99.8%), TiO2 (99%), and Nb2O5(99.9%) as precursors. Appropriate amounts of all these raw materials were weighed and mixed thoroughly for 24 h using zirconia balls in a plastic jar. The balls to powder weight ratio was maintained at 5:1. Ethanol was used as a milling medium. The mixed powder slurry was then dried at 100 °C for 12 h in an oven. The dried powder mixture was calcined at 1350 °C for 6 h in a box furnace. After that, the calcined powder was ground, sieved, and pressed into 10-mm diameter pellets by applying a uniaxial pressure ∼140 MPa. Finally, all the pellets were sintered at ∼1450 °C for 4 h in air to obtain the desired ceramics. The relative density of the final sintered samples was found to be ∼92.8% by Archimedes method.
Electrical and electrothermal measurements
The temperature-dependent (173 K ≤ T ≤ 373 K) as well as frequency-dependent (100 Hz ≤ f ≤ 100 kHz) dielectric properties were measured using a LCR meter (Agilent-4284A) connected to a heating and cooling (∼liquid nitrogen temperature) setup. A Radiant Precision LC-II Ferroelectric Test System was used to measure the electric-field-dependent polarization (P–E loops) at various temperatures using applied fields of frequency 10 Hz.
The heat capacity measurements (C p) were performed in a computerized homemade ac-calorimeter. A detailed description of the ac operation mode can be found elsewhere [Reference Yao, Ema and Garland64]. The electrocaloric temperature change was measured in a homebuilt measurement chamber with a stable surrounding temperature of ±2 mK. The temperature change of the sample was recorded by a small bead thermistor (NTC GLS9, TE Connectivity Measurement Specialists Ltd.) attached to the sample surface.
Structural characterization
The structural characterization of all the samples were performed at various temperatures (220 K ≤ T ≤ 380 K) using Rietveld refinement of X-ray diffraction and X-ray PDF analysis. High-resolution diffraction patterns were measured at the SPring-8 using X-ray radiation of wavelength λ = 0.49988 Å. X-ray total scattering patterns were measured at the Sector 11-ID-B of the Advanced Photon Source using X-rays of energy E = 86.72 keV and wavelength λ = 0.143 Å. The sample to detector distance was kept at 251.1 mm. The maximum scattering vector (Q max) was limited to 29 Å−1. The PDF patterns were obtained from the X-ray total scattering patterns using PDFgetX2 [Reference Qiu, Thompson and Billinge65]. Quantitative elemental composition of all the samples was analyzed by means of XPS with Physical electronics (PHI 5802) system using Al-Kα source (1486.6 eV). The XPS data were collected in the range of 0–1200 eV.
Author contributions
The manuscript was written through contributions of all authors. All authors have given approval to the final version of the manuscript.
Funding sources
CityU (Project Nos. 7200514, 7004967, and 9610377). Danish National Research Foundation (DNRF93). European Union's Horizon 2020 research and innovation program under the Marie Skłodowska-Curie grant agreement No. 778072. Slovenian Research Agency under program P1-0125. U.S. Department of Energy (DOE) Office of Science User Facility operated for the DOE Office of Science by Argonne National Laboratory under Contract No. DE-AC02-06CH11357.
Supplementary material
To view supplementary material for this article, please visit https://doi.org/10.1557/jmr.2020.25.
Acknowledgments
A.P. gratefully acknowledges funding support from CityU (Project Nos. 7200514, 7004967, and 9610377). M.R.V.J. is grateful for the support by the Danish National Research Foundation (DNRF93), and the Danish Research Council for Nature and Universe (Danscatt). N.N. acknowledges the European Union's Horizon 2020 research and innovation program under the Marie Skłodowska-Curie grant agreement No 778072 and the Slovenian Research Agency under program P1-0125. This research used resources of the Advanced Photon Source, a U.S. Department of Energy (DOE) Office of Science User Facility operated for the DOE Office of Science by Argonne National Laboratory under Contract No. DE-AC02-06CH11357. A.P. gratefully acknowledges technical assistance from Mr. Daniel Yau.


 Open access