





Introduction
The prevalence of type 2 diabetes (T2D) has reached epidemic proportions and is a major global concern. According to the World Health Organization (WHO), more than 422 million people have diabetes worldwide, representing a global prevalence among adults of 8⋅5 %(1). In the UK alone, over 3⋅9 million people are diagnosed with diabetes, 90 % of which have T2D, and this figure is anticipated to rise to more than 5 million by 2025(2). T2D is a major risk factor for other health conditions including cardiovascular disease, kidney failure, neuropathy and blindness(1). It has also recently emerged as a significant risk factor for COVID-19(Reference Holman, Knighton and Kar3).
T2D used to be considered a chronic progressive disease typically managed by escalating pharmacotherapy to maintain normoglycaemia and mitigate disease complications. However, the paradigm of treatment is changing with recognition that T2D can be put into remission(Reference Nagi, Hambling and Taylor4). Remission seems to occur up to a point, beyond which the pancreatic β-cells are unable to recover(Reference Taylor, Al-Mrabeh and Zhyzhneuskaya5). Definitions for remission vary but it is generally defined as achieving glycaemia below the diabetic range in the absence of antiglycaemic medications for at least 1 year(Reference Nagi, Hambling and Taylor4). The American Diabetes Association (ADA) defines three states of remission: (1) ‘partial’ – subdiabetic hyperglycaemia [glycated haemoglobin (HbA1c) 5⋅7–6⋅4 %] for at least 1 year; (2) ‘complete’ – normoglycaemic (HbA1c level <5⋅7 %) for at least 1 year; (3) ‘prolonged’ – complete remission for at least 5 years(Reference Buse, Caprio and Cefalu6).
There are currently two proven non-surgical ways to achieve T2D remission: low-energy diets (LEDs) and low-carbohydrate diets (LCDs)(Reference Sjöström, Peltonen and Jacobson7–Reference Hallberg, McKenzie and Williams9). These two approaches focus on operating different metabolic levers: energy restriction and carbohydrate restriction. Given that both factors are interlinked (Fig. 1), it is not clear which is driving T2D remission and hence which offers the most effective interventional approach.
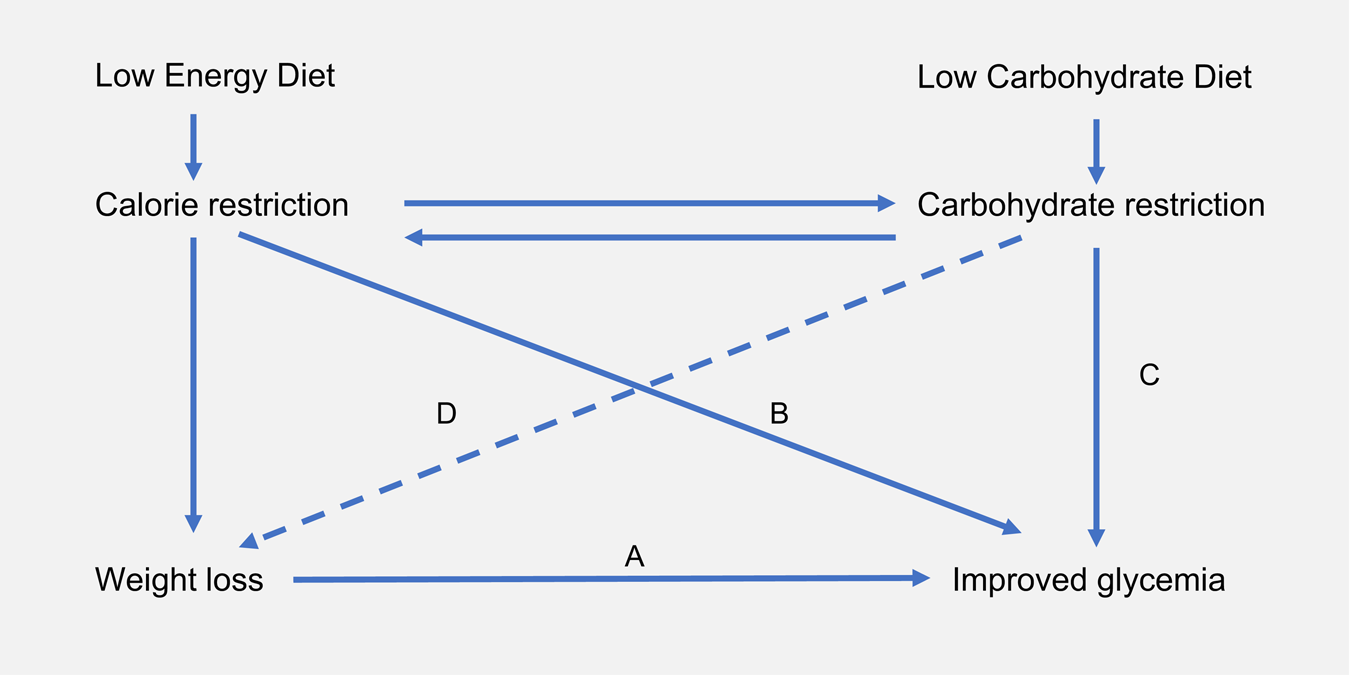
Fig. 1. Interrelationship between energy restriction, weight loss and carbohydrate restriction in improved glycaemic control: carbohydrate and energy restriction are interrelated. (A) In obese individuals with T2D, weight loss is associated with improved glycaemic control(Reference Williamson, Thompson and Thun10). This is in accordance with the twin cycle hypothesis, whose central tenet is that excess lipids within the liver and the pancreas drive T2D pathogenesis(Reference Taylor11). (B) In studies of low-energy feeding, glycaemia improves within days of energy restriction, before significant weight loss has occurred(Reference Lips, De Groot and Van Klinken12). (C) Carbohydrate restriction improves glycaemia by reducing postprandial glucose rises. While failed repression of gluconeogenesis and glycogenolysis are major causes of hyperglyacemia(Reference Rizza13), dietary carbohydrate intake is the largest driver of postprandial glucose rises. (D) Carbohydrate restriction is also associated with weight loss. This may occur as a function of spontaneous energy restriction or there may be independent effects arising from reduced insulin secretion. Whether or not carbohydrate restriction has independent effects on body weight remains a matter of contentious debate (hence depicted as dashed line)(Reference Ludwig and Ebbeling14,Reference Hall, Guyenet and Leibel15) . T2D, type 2 diabetes.
LEDs restrict energy intake to induce rapid weight loss(Reference Leslie, Taylor and Harris16). They characteristically provide between 800 and 1200 kcal/d utilising either total diet replacement (TDR) or some inclusion of conventional foods as a partial diet replacement(Reference Brown and Leeds17). LEDs have gained attention for their use in diabetes management after the 2011 Counterpoint study which demonstrated the normalisation of β-cell function, hepatic insulin sensitivity and fasting blood glucose using an 8 week 600 kcal/d diet(Reference Lim, Hollingsworth and Aribisala18). In 2018, the DiRECT trial demonstrated that an intensive weight management programme using TDR could achieve T2D remission in 46 % of participants after 1 year(Reference Lean, Leslie and Barnes8).
LCDs specifically aim to restrict carbohydrate intake, either as a percentage of total energy (TE) or as an absolute intake (g/d). Definitions of what constitutes ‘low carbohydrate’ have been inconsistent over time and between studies but the definitions proposed by Feinman et al. (Reference Feinman, Pogozelski and Astrup19) are becoming more widely accepted. Specifically, this defines low carbohydrate as <26 % of TE from carbohydrates or 130 g/d and very low-carbohydrate ketogenic diets as <10 % of TE from carbohydrates or 50 g/d.
Table 1 highlights the similarities and differences between LCDs and LEDs. Despite their differences, carbohydrate restriction is common in both: LCDs restrict carbohydrates as an explicit goal, whereas LEDs restrict carbohydrates as a consequence of achieving low-energy intake.
Table 1. Generalised similarities and differences between low carbohydrate diets and low energy diets

CHO, carbohydrate; VLCKD, very low-carbohydrate ketogenic diet.
There is currently much interest in the use of carbohydrate restriction to treat T2D(20). Over the past 5 years, ten meta-analyses, based on nearly fifty randomised controlled trials (RCTs), have aimed to address the question of whether diets low in carbohydrates produce greater improvements in weight and glycaemic control compared with higher carbohydrate control diets(Reference Fan, Di and Chen21–Reference McArdle, Greenfield and Rilstone30). The majority of these meta-analyses have found a beneficial effect from carbohydrate restriction(Reference Fan, Di and Chen21–Reference Goldenberg, Day and Brinkworth27), and none have favoured higher carbohydrate comparators, although several studies have found no difference between diets(Reference Schwingshackl, Chaimani and Hoffmann28–Reference McArdle, Greenfield and Rilstone30). Most recently, Goldenberg et al. (Reference Goldenberg, Day and Brinkworth27) performed a comprehensive meta-analysis of the effect of LCD (<130 g/d) on T2D remission. They identified higher rates of diabetes remission among LCDs compared with low-fat diets at 6 months, an effect which diminished at 12 months. The authors highlighted the potential confounding role of calorie restriction but found no evidence of credible effect modification when intervention and control diets were calorically matched compared with when they were not. However, this could have been due to measurement error since calorie intakes were determined by dietary questionnaires.
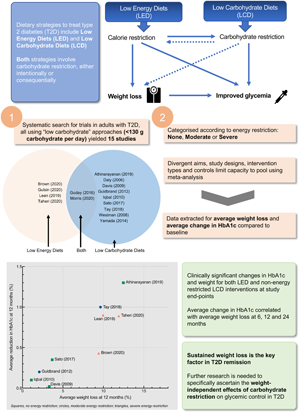
Thus, the role of energy restriction in LCDs remains unclear, and no study to date has attempted to group together both LCDs and LEDs that are also ‘low carbohydrate’ in absolute terms. This review takes an alternative approach to the existing evidence base by recognising the commonality between these two approaches ‘clamped’ by carbohydrate intake. Specifically, it aims to review, characterise and compare the clinical trials that have used low-carbohydrate (<130 g/d) approaches with different levels of energy intake.
Methods
Data sources and searches
The present systematic review was performed with reference to the Cochrane Handbook for Systematic Reviews of Interventions(Reference Higgins, Thomas and Chandler31) and reported in accordance with the Preferred Reporting Items for Systematic Reviews and Meta-Analyses (PRISMA) statement(Reference Moher, Liberati and Tetzlaff32). A protocol was registered with PROSPERO in advance (CRD42020197257)(33).
An electronic search was performed using the databases Medline, EMBASE, CINAHL, Scopus and Cochrane Central Register of Controlled Trials (CENTRAL). The search was performed on 7 July 2020, and no date limits were applied. Search terms included keywords and subject headings related to T2D, LEDs or LCDs, glycaemic outcomes and clinical trials (see Supplementary material). A manual search of reference lists of key systematic reviews and reports was also conducted to identify any additional relevant studies. Search results were independently reviewed by A.P.N. and A.S.M. and any conflicts over inclusion were resolved by discussion.
Study selection
Studies were eligible for inclusion if they were controlled trials including adults diagnosed with T2D, involving an LCD (defined as <130 g/d or <26 % of TE) and reporting a change in weight and glycaemic outcomes (including HbA1c, fructosamine, fasting plasma glucose and/or glycaemic variability). Non-randomised trials were eligible to allow the inclusion of trials in more ecologically valid settings, such as those utilising very low-energy weight-loss diets. Control diets that stipulated any other type of dietary intervention such as low fat, ‘healthy eating’ and Mediterranean, or usual diabetes care were permitted. All countries and languages were eligible. For full inclusion and exclusion criteria, see Table 2.
Table 2. Study inclusion and exclusion criteria
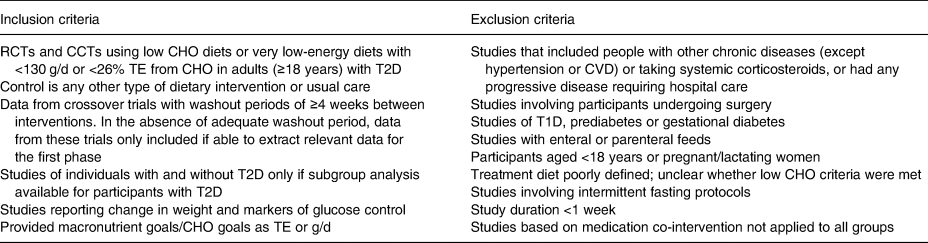
RCTs, randomised controlled trials; CCTs, controlled clinical trials; CHO, carbohydrate; TE, total energy; T2D, type 2 diabetes; CVD, cardiovascular disease; T1D, type 1 diabetes.
Data extraction and quality assessment
Data were extracted by A.P.N. Data items included: study characteristics, participant characteristics, details of the intervention (including prescribed and reported energy and macronutrient composition), dietary adherence, medication changes and outcome data for HbA1c and weight loss at 3, 6, 12 and 24 months (where available) and study endpoints. HbA1c only was collected as it is the most widely used marker of T2D remission, and quality of life outcomes were not reported due to lack of consistency across studies. These represent minor deviations from the protocol submitted to PROSPERO. The mean percentage weight loss from baseline and the mean absolute reduction in HbA1c were calculated for intervention arms. Absolute rather than relative change in HbA1c was used, since therapeutic goals are based on a threshold value and not relative reduction(34). Risk of bias was assessed using the Cochrane Risk of Bias tool(Reference Sterne, Savović and Page35).
Data synthesis and analysis
A narrative synthesis was undertaken to explore the characteristics of the included studies. HbA1c and weight loss outcome data were compared between intervention and control arms within studies at the longest duration time point.
To compare weight and HbA1c outcomes between studies, percentage weight loss and HbA1c change at study endpoint and at specific time points (3, 6, 12 and 24 months) were plotted graphically in scatter plots. Meta-analysis was not considered appropriate due to high clinical heterogeneity between studies. The association between average weight loss and HbA1c change was examined using correlation analysis and the computation of R 2 values in Prism 8 for OS X Version 8.4.3(36).
Results
Search results
Fig. 2 shows the selection of studies, in accordance with the PRISMA guidelines(Reference Moher, Liberati and Tetzlaff32). The initial database search yielded 809 studies, of which 223 were duplicates. Following title and abstract screening, ninety-one studies were retrieved for full-text screening. A total of fifteen studies met the inclusion criteria.
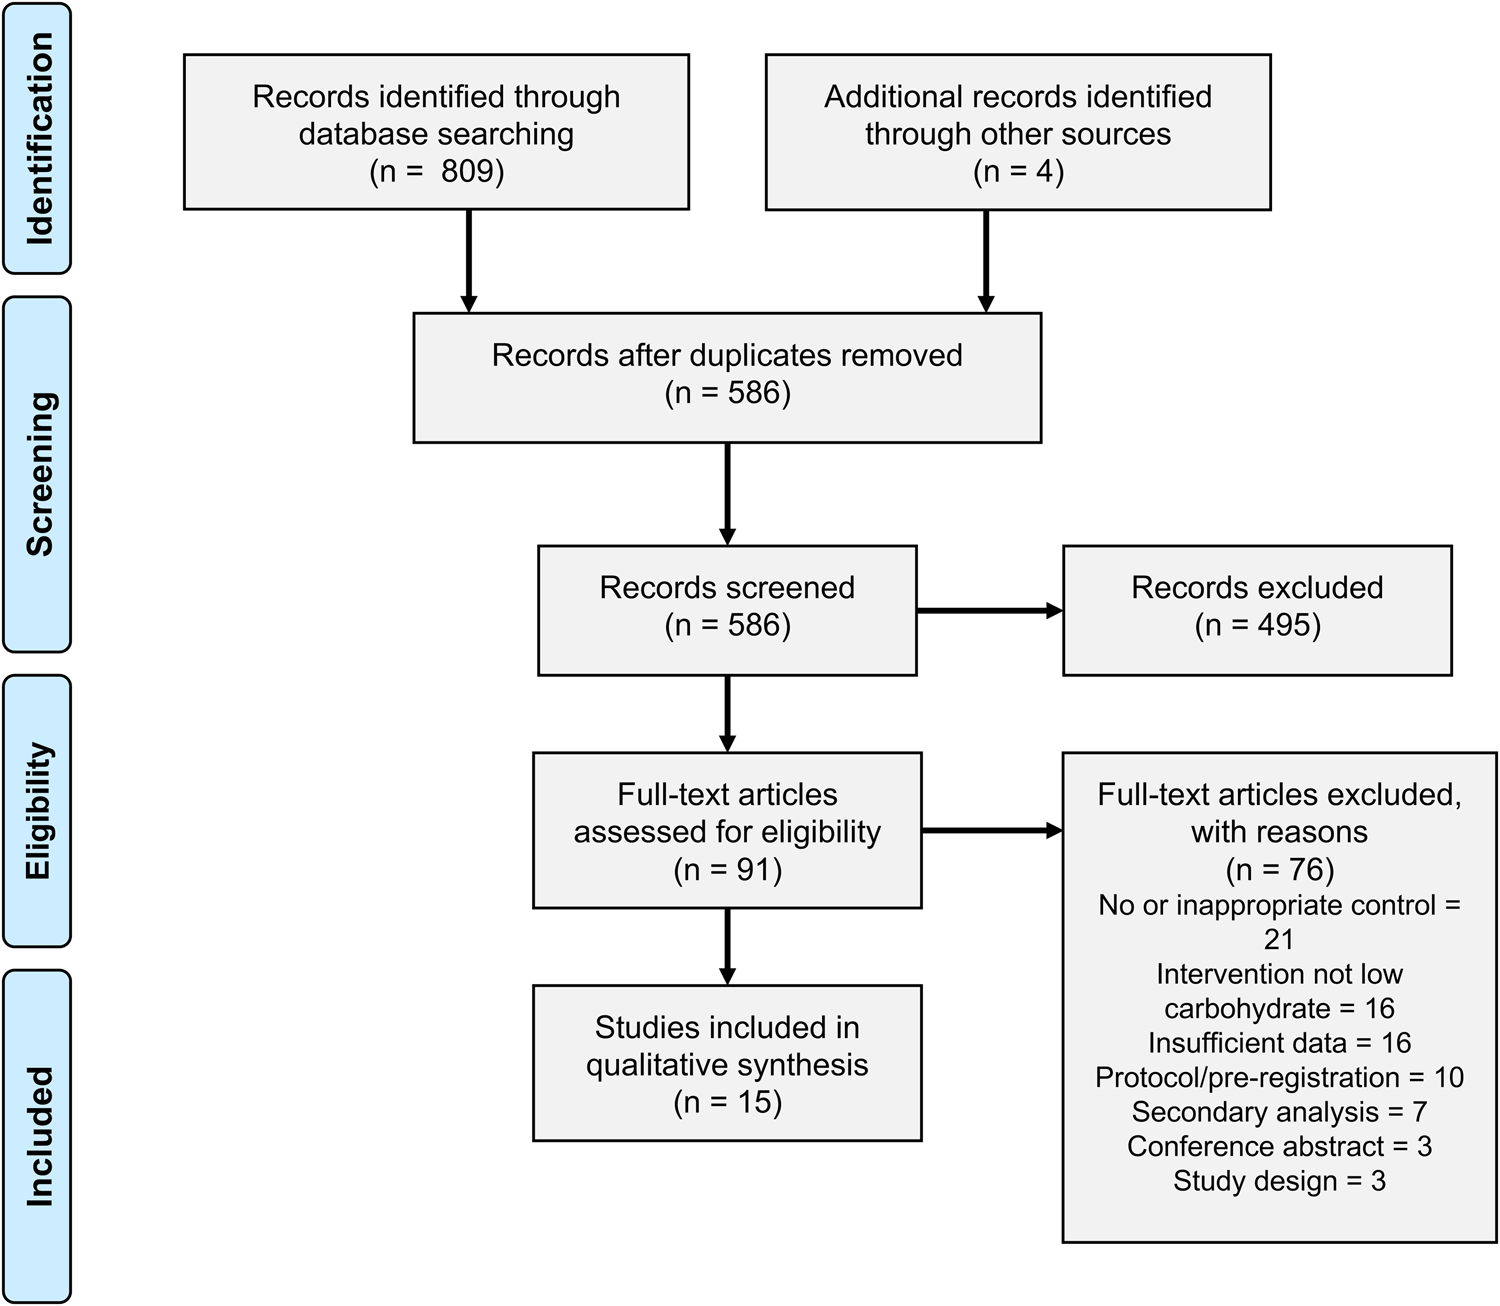
Fig. 2. Study screening and selection.
Study characteristics
This review yielded a highly heterogeneous set of studies that fulfilled criteria for ‘low carbohydrate’. The characteristics of the fifteen controlled trials are summarised in Table 3. The publication period covered from 2006 to 2020, study duration ranged from 3 to 24 months and study sample sizes ranged from 12 to 262 participants in the intervention arm. Of the included studies, thirteen were RCTs and two were non-RCT. Of the two non-RCTs, one was randomised at the level of primary care practice rather than the participant level.
Table 3. Characteristics of included studies
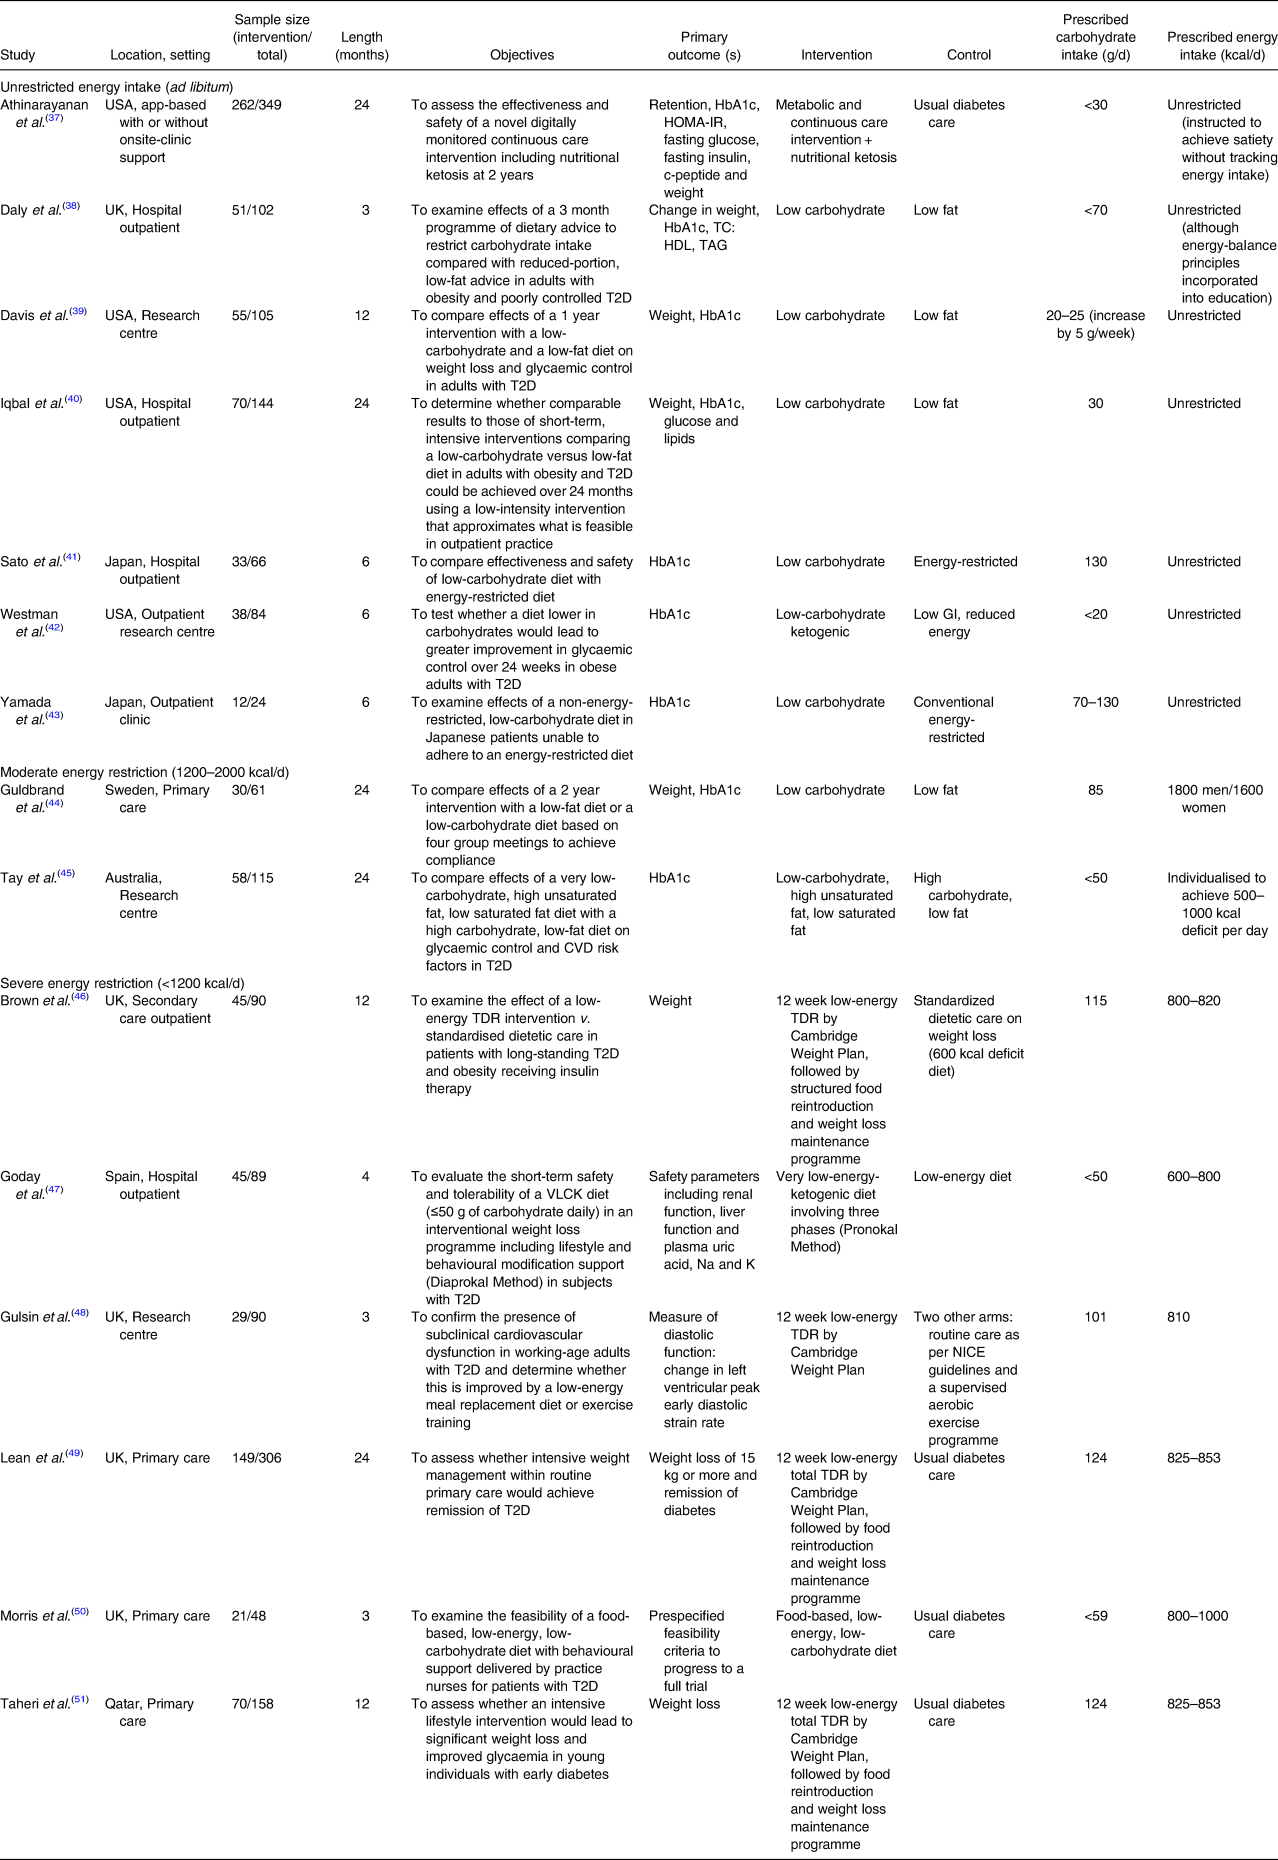
HbA1c, glycated haemoglobin; HOMA-IR, Homeostatic Model Assessment of Insulin Resistance; T2D, type 2 diabetes; TC, total cholesterol; HDL, high-density lipoprotein; TAG, blood triacylglycerol; GI, glycaemic index; CVD, cardiovascular disease; TDR, total diet replacement; VLCK, very low-calorie ketogenic; NICE, The National Institute for Health and Care Excellence.
Variable approaches to energy and carbohydrate restriction
Studies were categorised into three groups based on their prescribed energy intakes: unrestricted (ad libitum feeding), moderately restricted (1200–2000 kcal/d) or severely restricted (<1200 kcal/d) (Fig. 3).
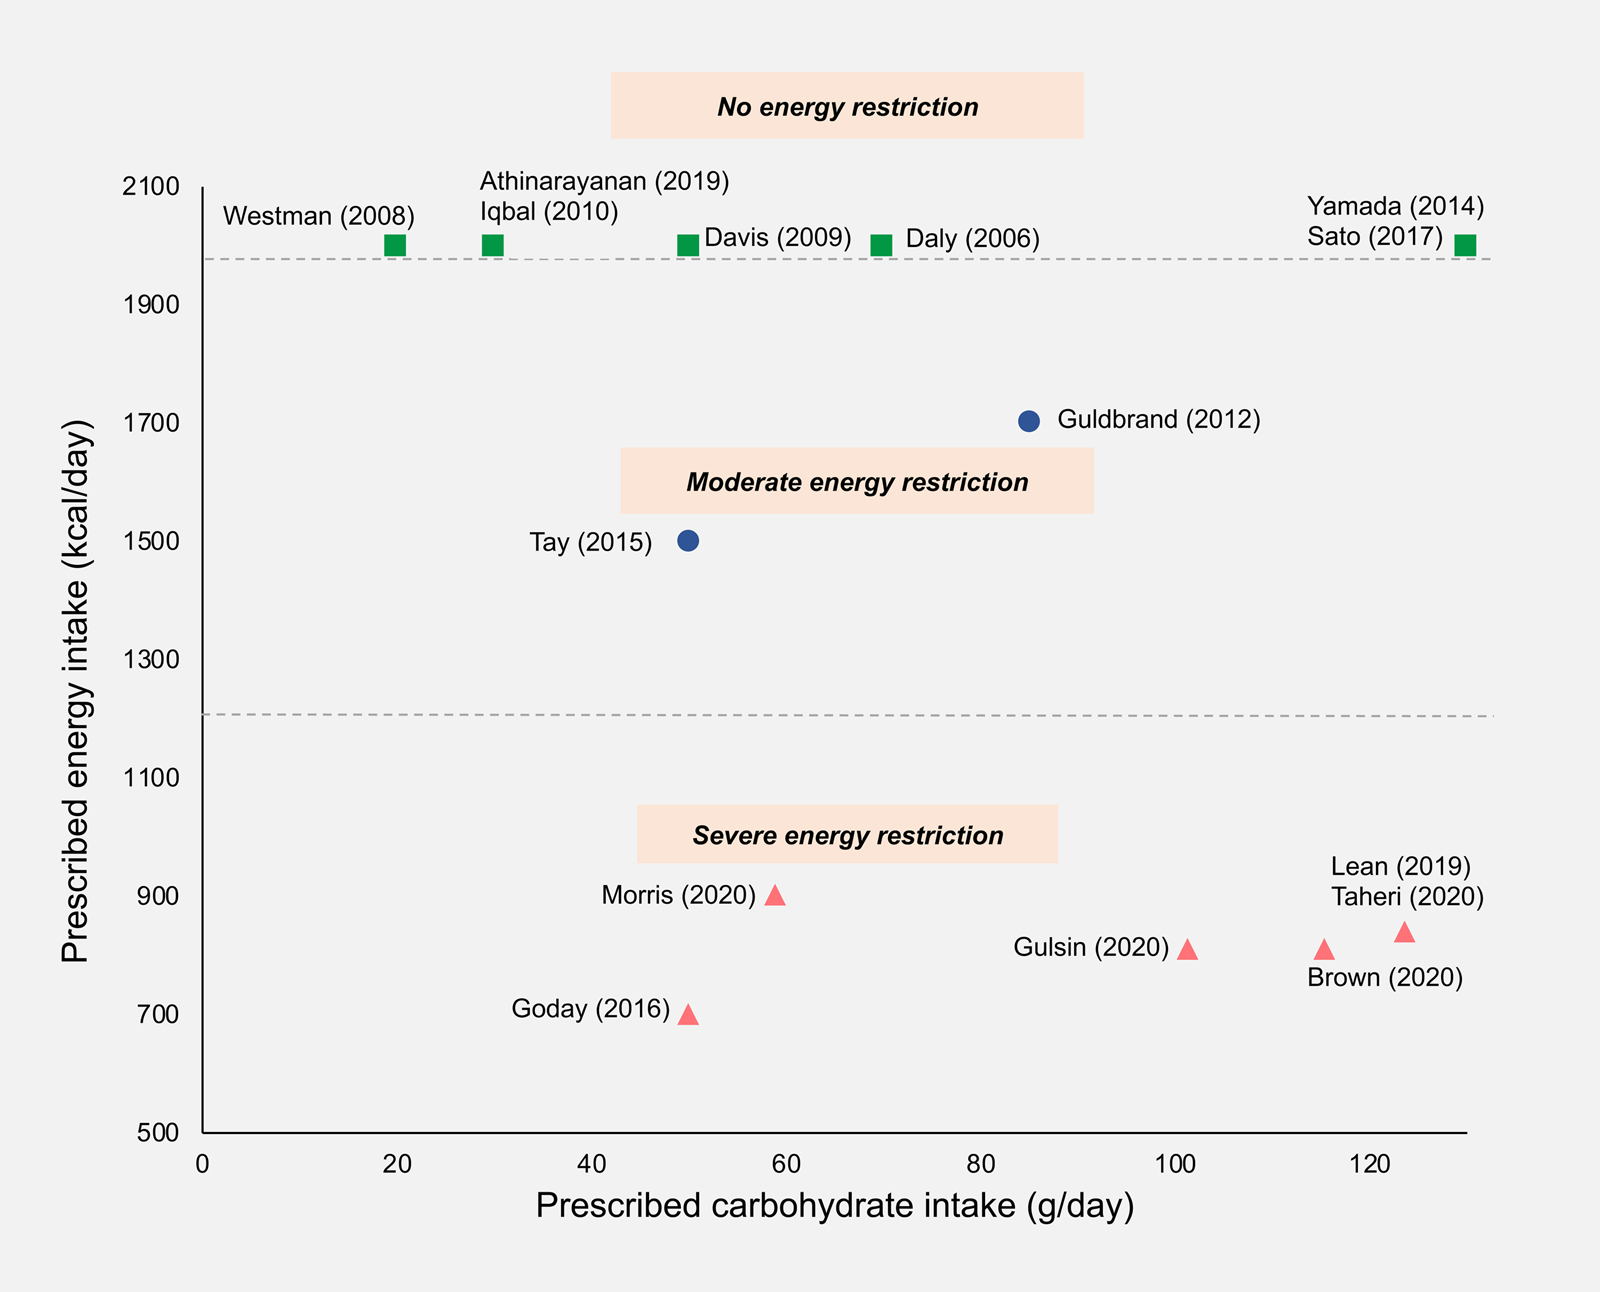
Fig. 3. Prescribed daily carbohydrate and energy intakes in included studies. Where a maximum allowance of carbohydrate or energy was prescribed, this value was used; where a range of carbohydrate or energy intakes was prescribed, the mid-point value was taken; where energy intake was unrestricted, a value of 2000 kcal/d was assigned. Squares, no energy restriction (ad libitum feeding); circles, moderate energy restriction (1200–2000 kcal/d); triangles, severe energy restriction (<1200 kcal/d).
A total of seven out of fifteen studies involved traditional low or very LCDs that were food-based and did not prescribe limits on energy intake(Reference Athinarayanan, Adams and Hallberg37–Reference Yamada, Uchida and Izumi43). Two out of fifteen studies used moderate energy reduction targets(Reference Guldbrand, Dizdar and Bunjaku44,Reference Tay, Thompson and Luscombe-Marsh45) . Almost all of the studies in these groups aimed for sustained carbohydrate restriction throughout the study period. Only two were initiated by a very restrictive early phase followed by subsequent increases in carbohydrate allowance(Reference Daly, Paisey and Paisey38,Reference Tay, Thompson and Luscombe-Marsh45) .
Six out of the fifteen trials restricted energy intake to <1000 kcal/d(Reference Brown, Dornhorst and McGowan46–Reference Taheri, Zaghloul and Chagoury51), with all except one incorporating meal replacements as part of a stepped weight loss programme. Three studies used a 3–5 month proprietary TDR weight loss phase involving energy restriction of around 800 kcal/d, followed by food reintroduction and weight loss maintenance phases(Reference Brown, Dornhorst and McGowan46,Reference Lean, Leslie and Barnes49,Reference Taheri, Zaghloul and Chagoury51) . In the TDR phase, carbohydrates accounted for 50–59 % of TE which translated to 100–125 g/d. The TDR phase was low carbohydrate in absolute terms but the macronutrient composition of subsequent phases was unclear from the published reports. These studies did not explicitly prescribe carbohydrate restriction but rather aimed to achieve weight loss via energy restriction. There were two exceptions to this: Morris et al. (Reference Morris, Aveyard and Dyson50) used a food-based diet that was explicitly low carbohydrate (<26 % of TE) as well as low energy (800–1000 kcal/d)(Reference Tay, Thompson and Luscombe-Marsh45) and Goday et al. (Reference Goday, Bellido and Sajoux47) used a very low-energy ketogenic diet. All of the LED trials were recently published, allowing only a limited period for follow-up.
Study aims
The principle aim for the majority of energy-restricted studies was to achieve and maintain weight loss, which was accomplished using mixed interventions with a number of different strategies including meal replacements to achieve <1200 kcal/d, individualised dietary advice, lifestyle changes and medication, if necessary(Reference Leslie, Ford and Sattar52). For these studies, the control group was a variant of usual care. By contrast, the principal aim of most of the LCD studies was to test the effect of manipulating carbohydrate intake on participants’ weight and glycaemic control, with a more conventional ‘low-fat’ diet as a comparator.
Outcome measures
Most studies’ primary outcome measures related to weight and/or glycaemic control with the exception of three studies assessed cardiac function, safety parameters and full-trial feasibility criteria. All studies reported HbA1c, with nine out of fifteen studies specifying HbA1c as a primary outcome. Four studies, all published in or after 2018, reported T2D ‘remission’ or ‘reversal’, although definitions varied(Reference Athinarayanan, Adams and Hallberg37,Reference Brown, Dornhorst and McGowan46,Reference Lean, Leslie and Barnes49,Reference Taheri, Zaghloul and Chagoury51) .
Twelve out of fifteen trials reported medication changes although methods of reporting were heterogeneous (Supplementary Table S5). All of the twelve studies that included medication changes reported a greater reduction in diabetic medications in the intervention compared with the control group. Six out of fifteen studies attempted to assess the quality of life using a range of questionnaires (Supplementary Table S1).
Baseline participant characteristics
Mean population ages ranged from 42 to 69 years, and there was a mix of ethnicities and gender ratios across studies. All studies except those conducted in Japan recruited participants who had a BMI of >30 kg/m2, with the majority having a mean BMI of >35 kg/m2. There was a wide range of average diabetes duration (2–14 years) and medication usage (Supplementary Table S2).
Intervention details
Interventions varied across studies in several ways including mode of delivery, dietary advice provided, intensity of support and utilisation of behavioural strategies to promote adherence (Supplementary Table S3). Some studies included very low-intensity interventions (involving only infrequent group sessions and dietary advice), whereas others involved more intensive input and employed a range of strategies to support dietary and lifestyle change including behaviour change techniques, intensive group support, biomarker feedback and health technologies, online support and remote care. More recent studies, published in or after 2017, involved higher intensity mixed interventions, typically employing a range of technological and behavioural support.
Control
Six out of fifteen studies used usual care as a control. In five of these studies, usual care provided minimal input, so the intervention and control arms differed in a number of aspects beyond dietary change. The remaining nine studies all used a version of a low-fat, energy-restricted diet. In all but one study, energy intake was not matched between intervention and control diets. The exception was Tay et al. (Reference Tay, Thompson and Luscombe-Marsh45) who used a planned isocaloric control, advising both arms to limit energy intake to achieve a 500–1000 kcal deficit per day.
Dietary assessment and adherence
The majority of studies attempted to assess dietary adherence in some way, although the methods employed varied between studies. A total of eight studies used food records (1, 3, 5 or 7-d food diaries) and two studies used self-report via questionnaires. Dietary adherence was not assessed in any of the four studies that utilised TDR (via meal replacements). Three studies used urinary or blood ketones as a marker of nutritional ketosis, one of which reported adherence based on these data(Reference Athinarayanan, Adams and Hallberg37). Of note, in those that included participant reported carbohydrate intakes, seven out of eight studies had reported values that exceeded the prescribed carbohydrate intake by more than 10 % (Supplementary Table S4).
Risk of bias
Selection bias was high for the two studies in which participants self-selected into the intervention; it was low or unclear for the thirteen trials that randomised participants between intervention arms. Six studies provided insufficient information on allocation concealment. Performance bias was judged to be high in the six studies which involved mixed interventions that differed in several aspects to the control arm, due to the nature of these trials. Performance bias was unclear for the remainder of trials due to the possible influence of participant or personnel expectations on the results. Detection bias was considered low for all studies based on the objective nature of the outcomes of interest. Attrition bias was high in three studies in which dropout rates were high or imbalanced between groups and completer analysis was used. Reporting bias of the outcomes of interest was low in all studies, since pre-specified outcomes of interest were reported. Only two studies were judged as unclear for ‘other bias’, due to potential baseline imbalances in confounders between the groups. The risk of bias assessment is summarised in Fig. 4.
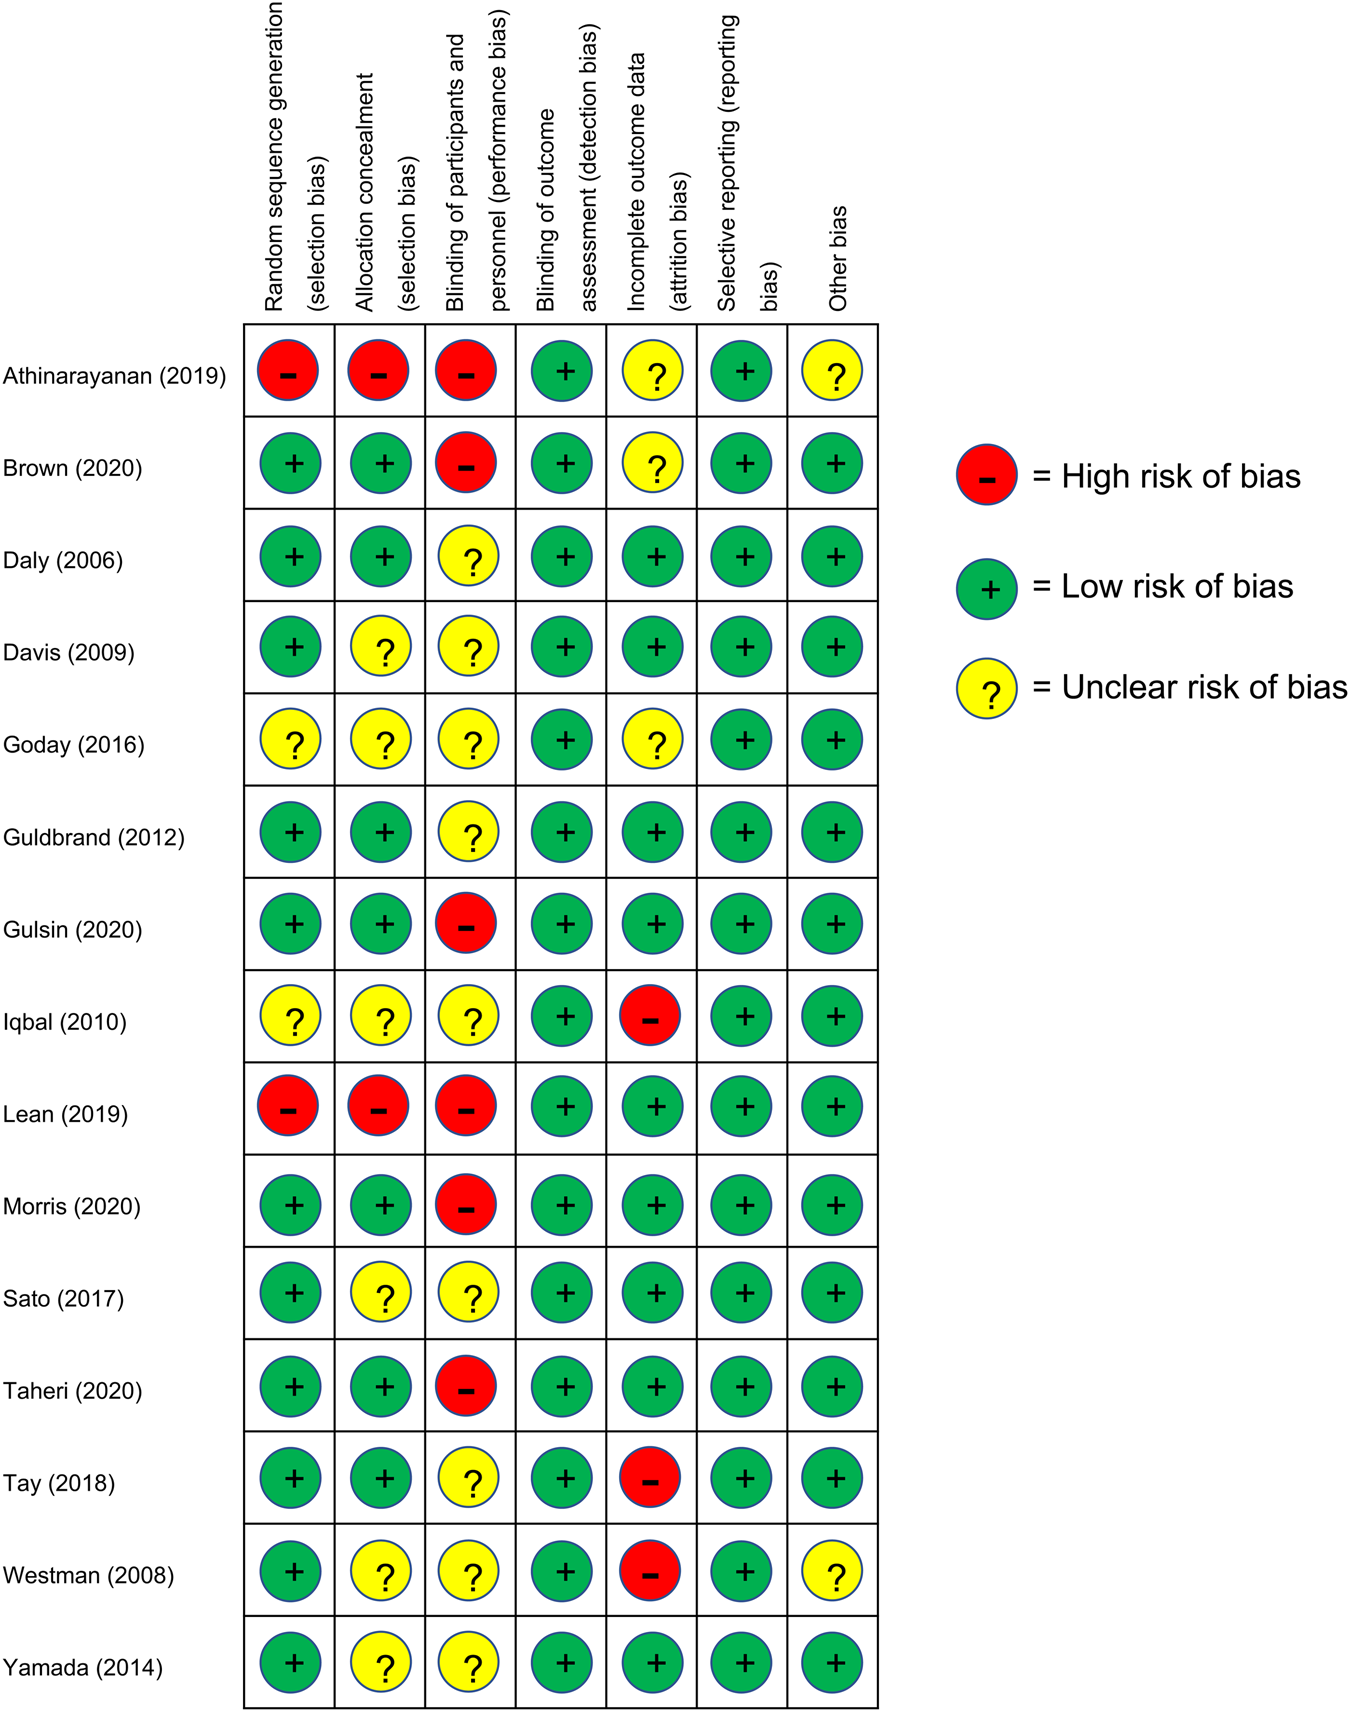
Fig. 4. Risk of bias assessment results: +, low risk of bias; ?, unclear risk of bias; –, high risk of bias.
Effectiveness of interventions
Between-group differences
All but one study resulted in a reduction in HbA1c between baseline and study endpoint (Table 4). A total of eight studies demonstrated significant improvements in HbA1c in the intervention arm compared with the comparator arm. All studies reported weight loss from baseline to endpoint, with nine studies showing greater weight loss in the intervention arm compared with the control group. All studies using usual diabetes care as a control arm reported significant between-group differences in weight and HbA1c. Only two of the five studies reporting data at 24 months found a difference between intervention and control groups by the end of the study(Reference Athinarayanan, Adams and Hallberg37,Reference Lean, Leslie and Barnes49) .
Table 4. Baseline and change values for HbA1c and weight for intervention and control arms at longest available time-point
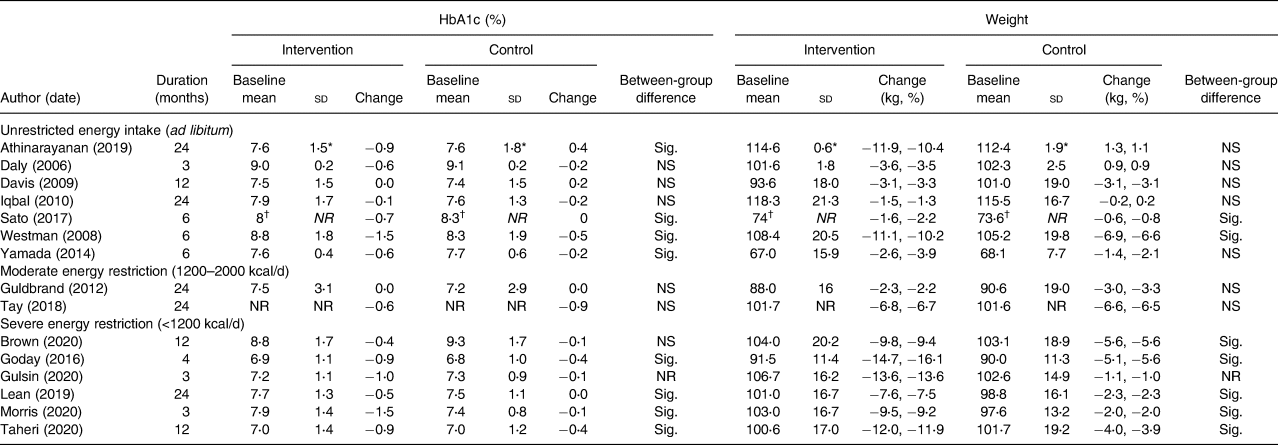
HbA1c, glycated haemoglobin; sd, standard deviation; Sig., significant; NS, non-significant; NR, not reported.
Data taken for longest available time point. All data are mean and standard deviation unless specified.
* Standard error of the mean, sem.
† Median and interquartile range.
Weight loss and HbA1c change in intervention arms
There was a wide range of reported improvements in the intervention arms across studies in mean HbA1c change (ranging from 0⋅0 to 1⋅5 %) and mean percentage weight loss (ranging from only 1 to over 15 % of baseline weight). Fig. 5 shows the data for all study endpoints.
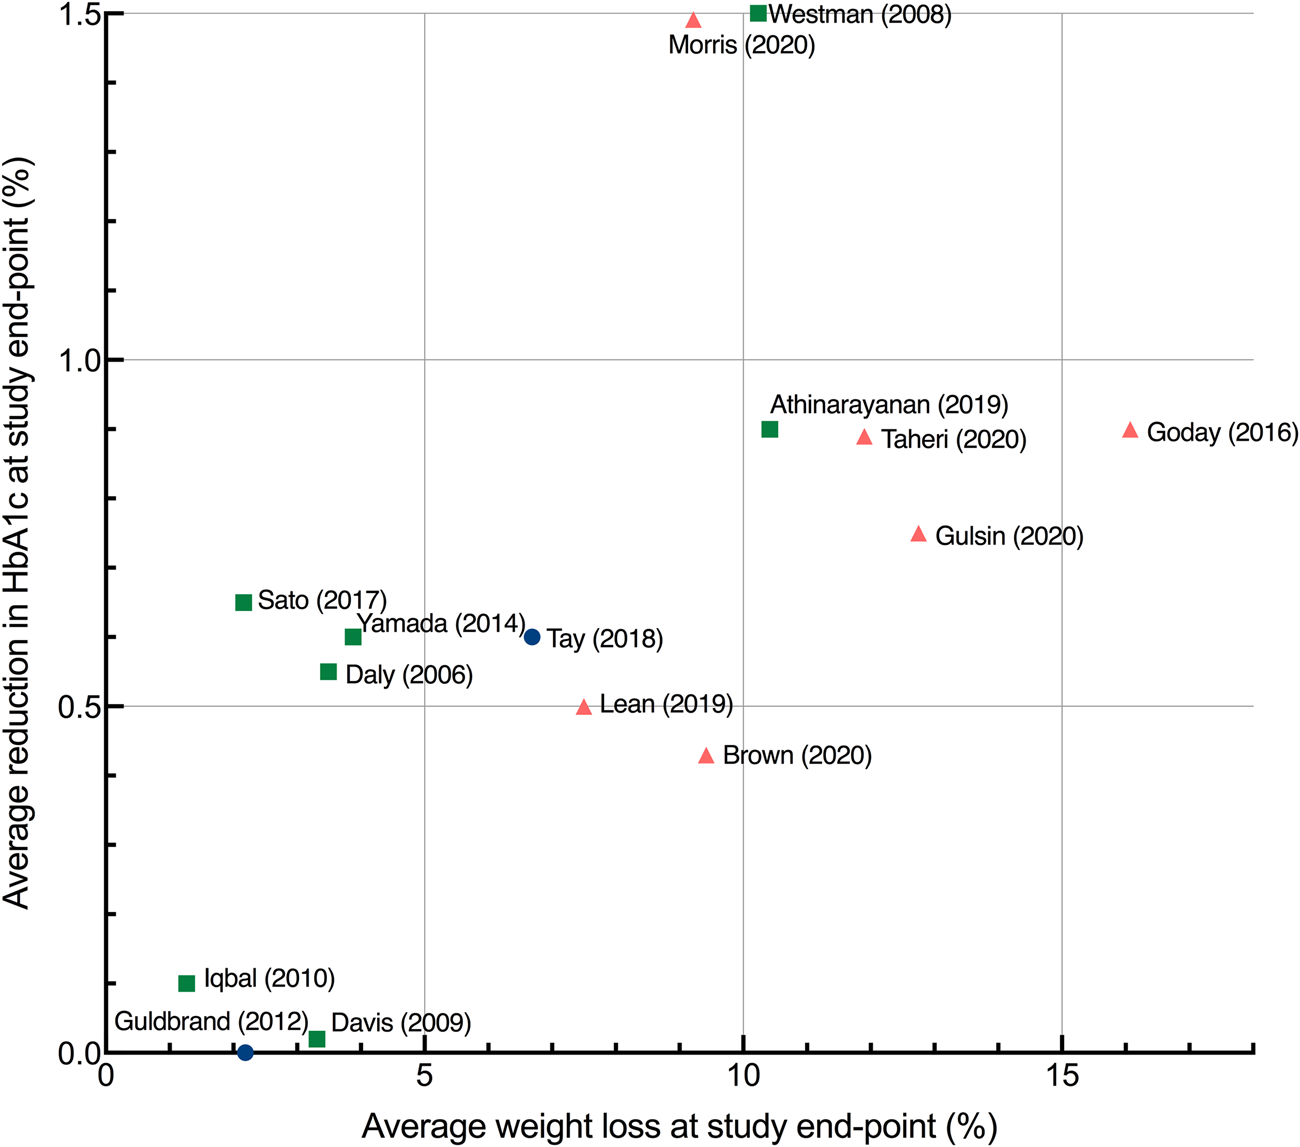
Fig. 5. Average improvement in HbA1c and average percentage weight loss at study endpoints. Each point represents the mean value for a single study with the exception of Sato et al. (Reference Sato, Kanazawa and Makita41) which represents median values. Study endpoints range from 3 to 24 months. Squares, no energy restriction (ad libitum feeding); circles, moderate energy restriction (1200–2000 kcal/d); triangles, severe energy restriction (<1200 kcal/d).
Those trials that severely restricted energy all produced clinically significant weight loss of more than 5 %, whereas energy-unrestricted trials produced a wider range of weight and HbA1c outcomes. The non-energy-restricted studies were more numerous, published over a longer time period and involved more diverse intervention types. Two of the most effective interventions explicitly combined low-carbohydrate and low-energy approaches(Reference Goday, Bellido and Sajoux47,Reference Morris, Aveyard and Dyson50) .
Fig. 6 shows the data at 12 months to facilitate comparisons between studies. The level of energy restriction did not clearly distinguish intervention efficacy. The three studies using LEDs led to a consistent and considerable mean weight loss of around 10 %(Reference Brown and Leeds17,Reference Lean, Leslie and Barnes49,Reference Taheri, Zaghloul and Chagoury51) . The two studies reporting the largest changes at both 12 and 24 months involved LCDs with unrestricted or moderate energy restriction(Reference Athinarayanan, Adams and Hallberg37,Reference Tay, Thompson and Luscombe-Marsh45) . The most effective intervention at 12 and 24 months involved an ad libitum ketogenic diet(Reference Athinarayanan, Adams and Hallberg37).
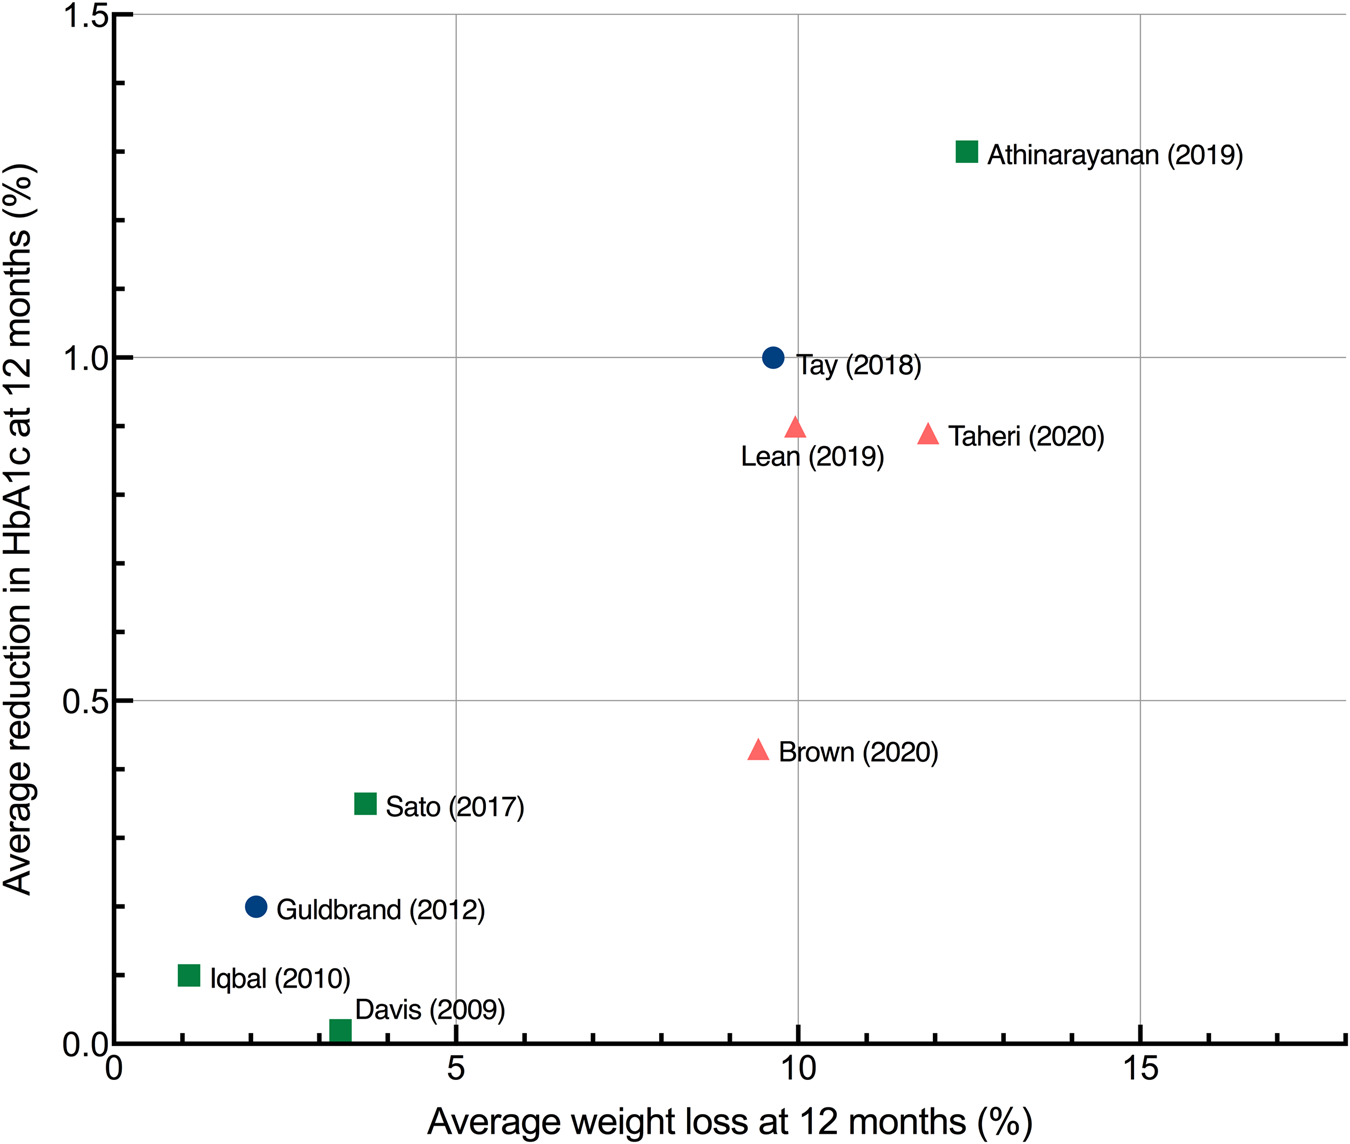
Fig. 6. Average improvement in HbA1c and average percentage weight loss at 12 months each point represents the mean changes from baseline in HbA1c and weight for a single study, with the exception of Sato et al. (Reference Sato, Kanazawa and Makita41) which represents median values. Studies were only included if they reported data at 12 months. Squares, no energy restriction (ad libitum feeding); circles, moderate energy restriction (1200–2000 kcal/d); triangles, severe energy restriction (<1200 kcal/d). HbA1c, haemoglobin A1C.
Association between weight loss and HbA1c
An association was observed between average weight loss and change in HbA1c across studies at 6, 12 and 24 months. The association was strongest at longer study lengths, as assessed by R 2: at 6 and 12 months, 84 and 82 %, respectively, of the variation in average HbA1c change between studies could be accounted for by the variation in average weight loss; at 24 months, this increased to 91 %. A scatterplot summarises the results at 12 months (Fig. 6). Reductions in HbA1c were associated with the increased percentage of weight loss.
Discussion
This systematic review took a novel approach to the clinical trial evidence regarding dietary approaches to treat T2D by recognising that carbohydrate restriction is a common feature of LCDs and LEDs. Previous systematic reviews with meta-analyses have assessed the impact of higher v. lower carbohydrate diets(Reference Fan, Di and Chen21–Reference McArdle, Greenfield and Rilstone30). These have shown either no effect(Reference Schwingshackl, Chaimani and Hoffmann28–Reference McArdle, Greenfield and Rilstone30) or a positive effect of carbohydrate restriction on weight loss and HbA1c(Reference Fan, Di and Chen21–Reference Goldenberg, Day and Brinkworth27) and have noted the role of spontaneous energy restriction in LCDs as a potential confounder.
A key strength of this review is that it only included low-carbohydrate studies that adhered to the definitions outlined by Feinman et al. (Reference Feinman, Pogozelski and Astrup19). Previous systematic reviews have often included studies with higher thresholds of carbohydrate intake which limits understanding of the effects of ‘true’ low-carbohydrates diets.
Risk of bias
The heterogeneity of the study designs gave rise to different risks of bias when studies were evaluated with the Cochrane Risk of Bias tool. Studies that aimed to assess the efficacy of mixed interventions (involving dietary, physical, and behavioural changes) were judged as high risk of performance bias, as they may document larger effects than those only assessing dietary changes. Additionally, two studies involved patients self-selecting the treatments they underwent which, although a valid approach for assessing efficacy, may also bias them towards reporting larger effects(Reference Athinarayanan, Adams and Hallberg37,Reference Lean, Leslie and Barnes49) . The heterogeneity of the (mostly design-inherent) sources of bias precludes head-to-head comparisons.
Intervention efficacy
This review found a range of intervention effectiveness that was not clearly distinguished by the level of energy restriction: both energy-restricted and energy-unrestricted diets were effective at 12 months, and the most effective intervention at 12 and 24 months involved an ad libitum energy-unrestricted diet(Reference Athinarayanan, Adams and Hallberg37). This reinforces others’ observations of spontaneous energy restriction in LCDs(Reference Johnstone, Horgan and Murison53) and highlights the potential efficacy of both low-carbohydrate and low-energy intervention types in the treatment of T2D.
The strength of the association between average weight loss and HbA1c change at 6, 12 and 24 months was notable. This finding is consistent with the ‘Twin Cycle Hypothesis’ of T2D which proposes that T2D can be put into remission following weight loss, which reverses the accumulation of fat in the pancreatic β-cells, thereby restoring their function(Reference Taylor11). The potential causal relationship between weight loss and diabetes remission remains a matter of investigation(Reference Taylor and Holman54,Reference Al-Mrabeh55) .
Regardless of causality, the strength of the association between weight loss and glycaemic markers underscores the importance of interventions that can maintain weight loss in the longer term. Weight maintenance is the most challenging area of weight management. Low-energy meal replacement-based diets are capable of producing dramatic weight loss(Reference Rehackova, Arnott and Araujo-Soares56) but they are necessarily short term and weight regain is common upon cessation, especially in the absence of continued support(Reference Brown, Dornhorst and McGowan57). DiRECT(Reference Lean, Leslie and Barnes49) was the only LED trial to report data beyond 12 months and it will be of interest to see if the results achieved can be sustained over the full 5-year trial period. This review identified a greater number of clinical trials testing LCDs or very LCDs, and a correspondingly wider range of outcomes. As with DiRECT, it will be of interest to see if the results using an ad libitum ketogenic diet in the study by Athinarayanan et al. (Reference Athinarayanan, Adams and Hallberg37) can be maintained over the full 5-year trial period.
In line with this focus on weight loss maintenance, this review identified a trend towards interventions with greater levels of participant support through co-interventions (involving exercise, pharmacotherapy, sleep and stress-reduction), new technologies and behaviour change techniques. Previous research shows that, regardless of the modality of weight loss, participant support is important(Reference Hall, Kahan and Diseases58), and this represents a promising trend in research.
Independent role of carbohydrate restriction
It is not clear from this review if carbohydrate restriction directly affects T2D status independent of weight loss. None of the included studies robustly measured energy intake or used an isoenergetic control, meaning the influence of spontaneous energy restriction was not controlled or accounted for. Tay et al. (Reference Tay, Thompson and Luscombe-Marsh45) included a planned energy-matched high-carbohydrate control but the diet was undertaken in a free-living environment and participants in the low-carbohydrate arm reported lower energy intakes than those in the low-fat arm. Several short-term studies do indicate a weight-independent effect of carbohydrate restriction on glycaemic control(Reference Gumbiner, Wendel and McDermott59–Reference Hyde, Sapper and Crabtree61) and there are other plausible underlying mechanisms that remain under investigation(Reference Soto-Mota62,Reference Soto-Mota63) .
The field would greatly benefit from further research to explore the potential for an independent effect of carbohydrate restriction on glycaemic control. This could be tested using a parallel-arm clinical trial comparing low-energy meal replacements with varying proportions of carbohydrates across a large enough range. Trials similar to this have been conducted using low-energy formula diets with 100 g (40 %) v. 162⋅5 g (65 %) carbohydrates per day and 1000 kcal for 4 weeks(Reference Miyashita, Koide and Ohtsuka60) and <40 g v. 65–156 g/d for 3 weeks each (in a crossover trial)(Reference Gumbiner, Wendel and McDermott59). These trials have found that manipulating carbohydrates leads to differences in various markers of metabolic health. Trials using a broader range of carbohydrate intakes at fixed energy levels are needed to further explore these findings.
Implications for clinical practice
The data in this review indicate that a major factor in T2D remission is weight loss maintenance. In clinical practice, patients would benefit from receiving information about the available options to enable them to make a fully informed individual choice, and to select for the diet and lifestyle changes that they can adhere to over the longer term, which may or may not incorporate carbohydrate restriction.
Limitations
There are several limitations in the current literature and in this review. First, presenting average weight and HbA1c outcomes of studies did not account for the underlying individual variability in weight and HbA1c outcomes.
Secondly, intervention efficacy was based solely on weight and HbA1c change. Some studies reported outcomes including sleep quality, anxiety and quality of life, as well as other glycaemic outcomes such as fasting blood glucose and glycaemic variability. There is also growing use and application of continuous glucose monitoring which provides measures of short-term glycaemic control such as time in target range(Reference Chehregosha, Khamseh and Malek64,Reference Krhač and Lovrenčić65) . Future reviews could consider the inclusion of these and other outcomes to provide a more holistic review of the effectiveness of LEDs and LCDs in the treatment of T2D.
Thirdly, inconsistent reporting of medication adjustment across studies meant that changes in HbA1c were not considered in the context of medication changes. This may have masked differences in effect size between interventions and led to an underestimation of the positive impact of carbohydrate restriction on glycaemic control(Reference Snorgaard, Poulsen and Andersen22,Reference Sainsbury, Kizirian and Partridge24,Reference Huntriss, Campbell and Bedwell25,Reference Goldenberg, Day and Brinkworth27,Reference Korsmo-Haugen, Brurberg and Mann29) . Future clinical trials would benefit from a more standardised approach to reporting medication changes to facilitate comparisons between studies.
Fourthly, due to heterogeneity in dietary assessment methods and inaccuracies associated with self-reported intakes(Reference Thompson, Subar, Coulston, Boushey and Ferruzzi66), carbohydrate and energy quantities were based on prescribed rather than actual intakes. Diet studies often suffer from poor adherence to the prescribed diet(Reference Gibson and Sainsbury67) and this review also found that reported carbohydrate intake exceeded prescribed carbohydrate intake in the majority of studies. Conclusions are therefore limited to the dietary prescription of carbohydrate restriction, rather than carbohydrate restriction per se.
Finally, this review did not distinguish between ketogenic and non-ketogenic diets. Ketones have been shown to directly lower hyperglycaemia by suppressing hepatic glucose output(Reference Ari, Murdun and Koutnik68,Reference Stubbs, Cox and Evans69) . However, the role of ketosis in long-term weight loss is contentious due in part to poor adherence rates to ketogenic diets in some clinical trials(Reference Iqbal, Vetter and Moore40). This is reflected in a recent systematic review that found that LCDs were more effective than very low-carbohydrate ketogenic ones, an effect which diminished when adherence was accounted for(Reference Goldenberg, Day and Brinkworth27).
Conclusions
This review took a novel approach to the dietary strategies for T2D remission by recognising the commonality of carbohydrate restriction between LEDs and LCDs. It found that trials that severely restricted energy intake were not superior to those that allowed ad libitum low-carbohydrate feeding (no prescribed energy deficit) at longer study durations (12 and 24 months). However, the strong association between average weight loss and HbA1c change at 6, 12 and 24 months indicates that successful interventions for T2D are those that enable sustained weight loss in the longer term. Further studies that carefully match carbohydrate and/or energy intake between arms are needed to establish the independent roles of carbohydrate and energy restriction in T2D treatment.
Supplementary material
The supplementary material for this article can be found at https://doi.org/10.1017/jns.2021.67.
Acknowledgments
A.P.N. conceptualised the project, developed the search strategy, conducted the literature search, selected studies, extracted and interpreted the data and wrote the manuscript. A.S.M. contributed to the search strategy design, selected studies, reviewed extracted data and reviewed/edited the manuscript. H.L. and A.L.C. contributed to the project conceptualisation and search strategy design, provided final decisions on study selection and reviewed the manuscript.
There are no conflicts of interest.


 Open access

