Super-Resolution Light Microscopy: 25 Years from Conceptualization to Everyday Use
Light microscopy has been used to study biological samples for hundreds of years. A particular noteworthy advancement in the field was that of fluorescence microscopy and fluorescent labeling strategies. The ability to specifically label and visualize target proteins using fluorescent tags provided scientists with a deeper understanding of the subcellular architecture of biological specimens. Furthermore, when applied in living cells, fluorescence imaging revealed key insights into the complex spatio-temporal dynamics of biological processes.
The transgenic expression of fluorophore-labeled proteins for analysis by epifluorescence or confocal microscopy has become a standard method for live-cell imaging in the last few decades. Fluorescent proteins like GFP and RFP are popular choices in live-cell imaging applications, as samples can be imaged “as-is,” without additional labeling steps [Reference Wiedenmann1]. Many molecular processes have been successfully investigated in this way, using standard fluorescence microscopes. Still, the resolution of standard fluorescence microscopes is limited to half the wavelength of light, or ~200 nm, as defined by the Abbe equation [Reference Abber2]. As a result, many subcellular details and protein interactions remain hidden from these optical techniques.
The development of super-resolution light microscopy techniques overcame the resolution limit of conventional techniques and enabled the investigation of biological structures and processes down to the nanometer scale [Reference Bottanelli3–Reference Scorrano5]. Stimulated emission depletion (STED) microscopy was the first technique to circumvent the diffraction limit in optical microscopy, and Stefan W. Hell was awarded with the 2014 Nobel Prize in Chemistry for his invention. STED nanoscopy is based on a conventional confocal laser scanning configuration but includes, in addition to an excitation laser, a second, red-shifted STED laser. During imaging, fluorophores in the focal spot are excited with the excitation beam. Before spontaneous fluorescence emission occurs, fluorophores at the rim of the excitation spot are exposed to the STED beam. The focus of the STED beam is shaped into a donut, with zero light intensity in the center and a high intensity at its rim. In turn, fluorophores at the rim of the excitation beam are depleted to the ground state (off-mode) by the STED beam. This ensures that the fluorescence reaching the detector can only come from a sub-diffraction-sized spot in the center of the excitation beam, and the location of the fluorophores is consequently known more precisely (Figure 1). Theoretically, the spatial resolution in STED microscopy is limited only by the intensity of the STED beam. However, due to instrumentation and dye limitations, a resolution on the order of a few tens of nanometers is achieved in practice. It is also worth noting that no mathematical algorithms or image post-processing are required to generate a STED image [Reference Hell and Wichmann6], and the raw nature of STED images can prove advantageous in many applications.
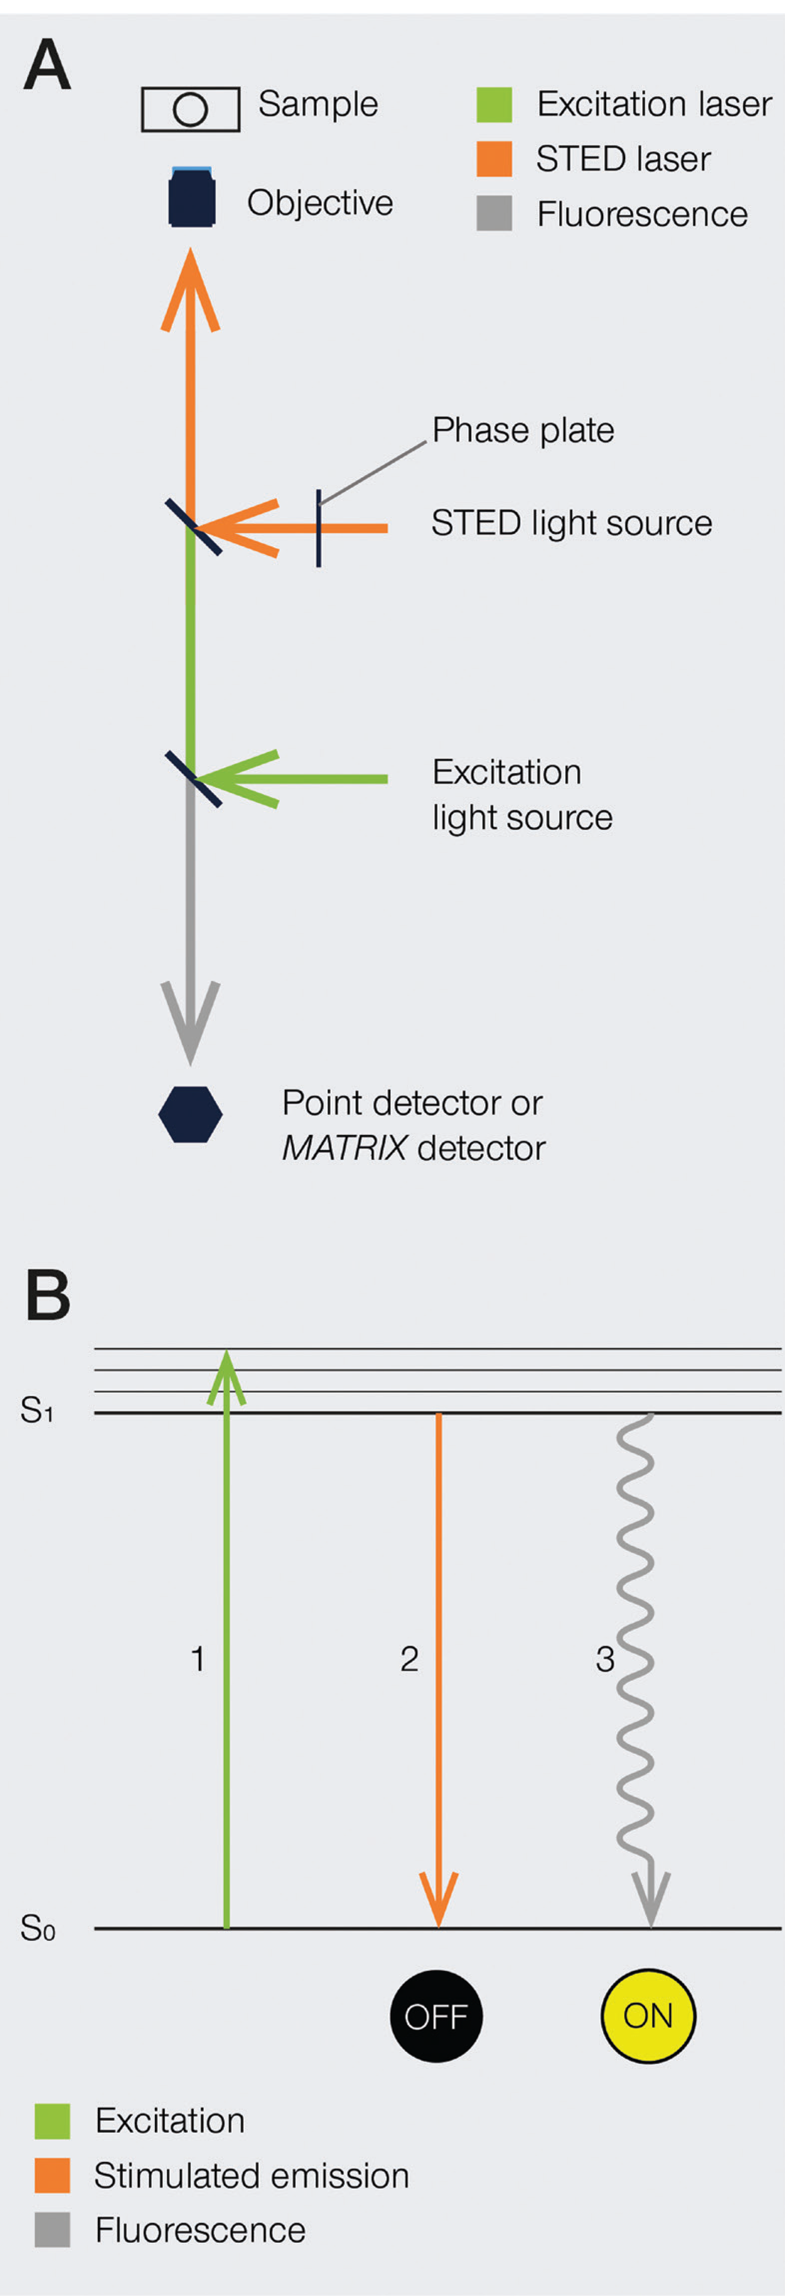
Figure 1: A) Schematic illustration of a STED microscope beam path. To implement the STED technique, the microscope design needs to incorporate a second focused light beam, that is, the STED beam, in addition to the excitation beam. Molecules in areas subject to STED light above the saturation threshold are forced into the off state. The phase plate is responsible for converting the plain STED beam into a donut shape. B) Jablonski diagram of the STED process of a fluorescent molecule. After optical excitation (1) from the ground state S0 to the first excited state S1, two pathways are available for its return to the ground state: if the molecule is exposed to the STED beam, it gets stimulated down to the ground state, and no fluorescence occurs (2). If the molecule is in the center of the donut and is not exposed to the STED beam, it returns to the ground state via the spontaneous emission of a fluorescence photon (3).
While STED microscopy provides a substantial increase in resolution, the laser light intensities used are higher compared to conventional microscopy. This generates the need for robust and photostable labels, especially for live-cell imaging applications. Conventional live-cell compatible dyes and transgenically expressed fluorophores are often prone to strong bleaching effects and are brightest in the green/yellow emission range. However, labels for STED microscopy need to be bright, photostable, and should be excitable in the red to far-red range to limit phototoxic effects in biological specimens. Many organic dyes offer all of these properties and are widely used in STED microscopy. However, most organic dyes cannot be used for the imaging of intracellular proteins in living systems. To be applicable to these types of experiments, the dyes must be able to move across the cellular membrane, label their targets with high specificity and efficiency, and should have low cytotoxic effects.
A breakthrough for live-cell STED imaging was made in 2013 by the introduction of silicon-rhodamine (SiR), a fluorogenic, cell permeable, far-red emitting organic live dye [Reference Lukinavičius7]. These characteristics made SiR an ideal label for live-cell STED nanoscopy, allowing imaging with commercial STED microscopes with a 775 nm depletion laser. Indeed, longer wavelengths (750–800 nm) are less harmful to living samples since they carry less energy than the shorter wavelengths (590–610 nm) used for the STED imaging of green and yellow fluorescent proteins [Reference Kilian8].
The success of SiR prompted a significant increase in the development and use of fluorescent organic dyes for live-cell STED microscopy. Here, we showcase recent developments of improved organic live dyes and innovative ways to minimize the light dose for STED microscopy, which together open new prospects for multicolor live-cell STED microscopy.
The Fluorophore Makes the Difference
Modern super-resolution imaging techniques like STED nanoscopy allow imaging of biological processes in living organisms below the diffraction limit. This success highly correlates with the availability of live-cell compatible fluorescent dyes linked to small reactive groups to label-specific targets within the cell. The ligand and fluorophore must be chosen carefully since they have a great impact on cell permeability and specificity of the probe.
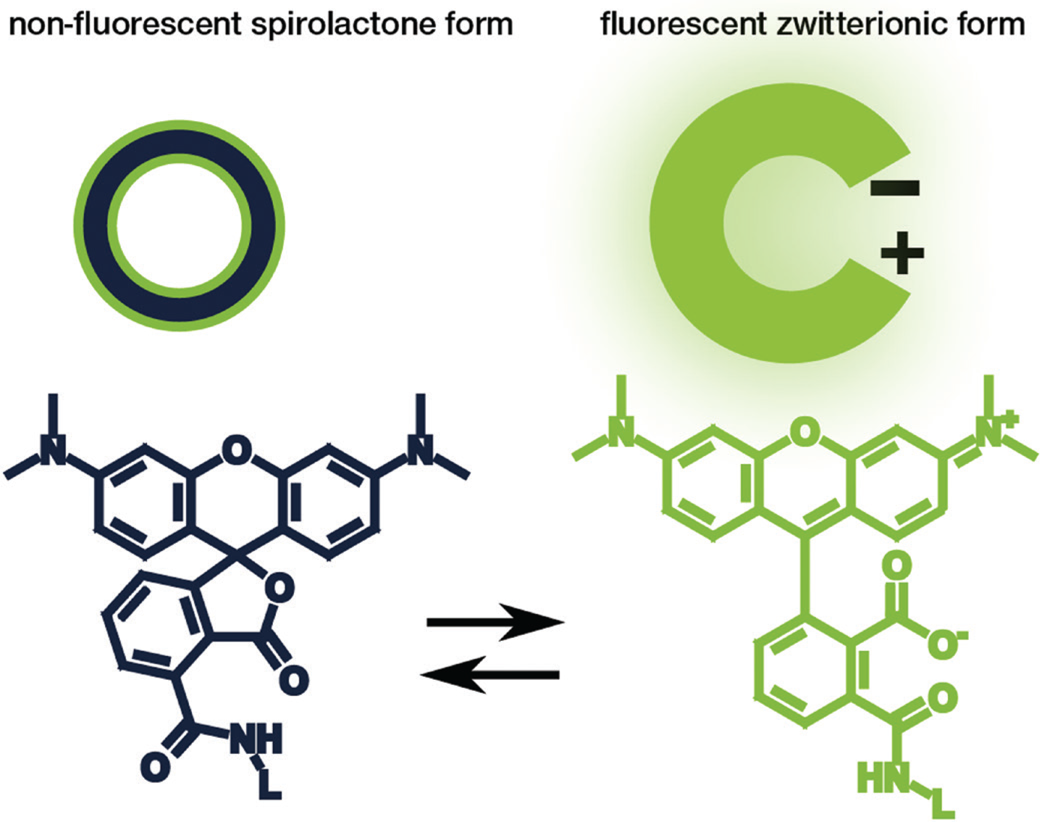
Rhodamine and carbopyronin fluorophores are among the most popular dye families used for STED microscopy due to their beneficial photophysical properties. Particularly interesting for live-cell imaging is that these dye families can exist in a non-fluorescent spirolactone form or a bright fluorescent zwitterionic form (Figure 2). The hydrophobic spirolactone state of the fluorophore increases its cell permeability, while the bright zwitterionic state occurs predominately after it binds to its target structure [Reference Lukinavičius9–Reference Lukinavičius10]. Recently, Bucevičius et al. described a strategy that can be used to adjust the equilibrium between the two states without changing the core structure of the fluorophore [Reference Bucevičius11]. For their experiments, they modified dyes that were already well characterized—the rhodamine N,N,N´,N´-Tetramethyl-Rhodamine (TMR) and the carbopyronines 580CP and 610CP [Reference Lukinavičius9,Reference Butkevich12–Reference Gerasimaitė14]. By using a so-called neighboring group effect (NGE) of two functional groups, the modified balance between the spirolactone and zwitterionic forms led to an enhanced biocompatibility. They further demonstrated that the NGE had a positive effect on the dye's cell permeability and fluorogenicity, which generated highly efficient probes for labeling tubulin, DNA, and actin at sub-nanomolar concentrations in living samples [Reference Bucevičius11].

Figure 2: Schematic illustration (top) and chemical structure (bottom) of the closed, non-fluorescent spirolactone form (left) and the open, fluorescent zwitterionic form (right) of a fluorophore.
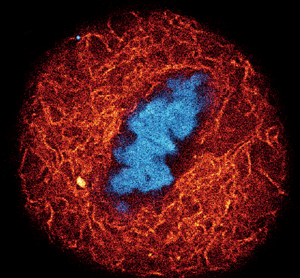
This patent-protected method of generating improved fluorescent probes for live-cell imaging by employing the NGE is now commercially available. abberior has probes designed for multicolor STED and confocal imaging of DNA, tubulin, lysosomes, and actin. They cover a large portion of the spectral range of visible light (510–610 nm), offering flexibility with labeling configuration. Furthermore, their outstanding cell permeability and increased fluorogenicity allow wash-free multicolor live-cell labeling at concentrations which are 10 times lower than that required when using conventional live probes. abberior LIVE dyes have been extensively tested in living cells (Figure 3) and tissue (Figure 4) [Reference Grimm15–Reference Belov17]. With this technique (Figure 5), high-contrast images of living systems at a resolution below 50 nm can be easily acquired.

Figure 3: A) Composite of three-color live-cell confocal image of an adherent mammalian cell stained for DNA (gray), tubulin cytoskeleton (red), and actin network (cyan). B–D) Individual channels of the same cell with corresponding probe structure: B) DNA stain using a final concentration of 0.1 μM of LIVE 560 DNA (Hoechst); C) tubulin filaments are stained with LIVE 610 tubulin (Cabazitaxel) at 0.1 μM; D) actin network highlighted with 1 μM LIVE 510 actin (Jasplakinolide). Images were acquired with an abberior STEDYCON microscope. E) Dynamic behavior of the tubulin cytoskeleton in a living human fibroblast labeled with 1 μM LIVE 510 tubulin. Images represent different time points, showing long-term live-cell imaging over 24 h. Images were acquired with an abberior FACILITY microscope equipped with a temperature-controlled live-cell chamber.
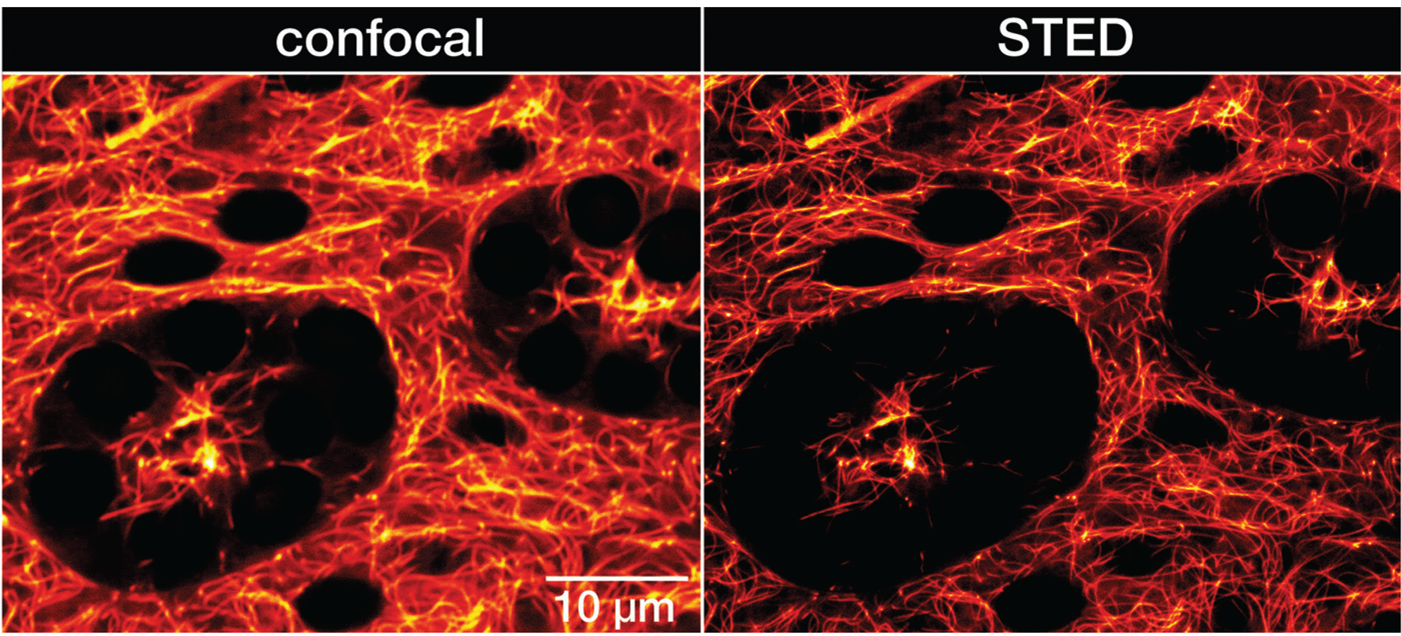
Figure 4: Confocal and STED recordings of living resected Drosophila melanogaster adult testis. Whole organs were isolated from the adult male fruit fly and incubated in PBS containing 1 μM LIVE 610 tubulin for 1 h. The organs were immediately imaged without further washing steps. Images were acquired with an abberior INFINITY microscope.
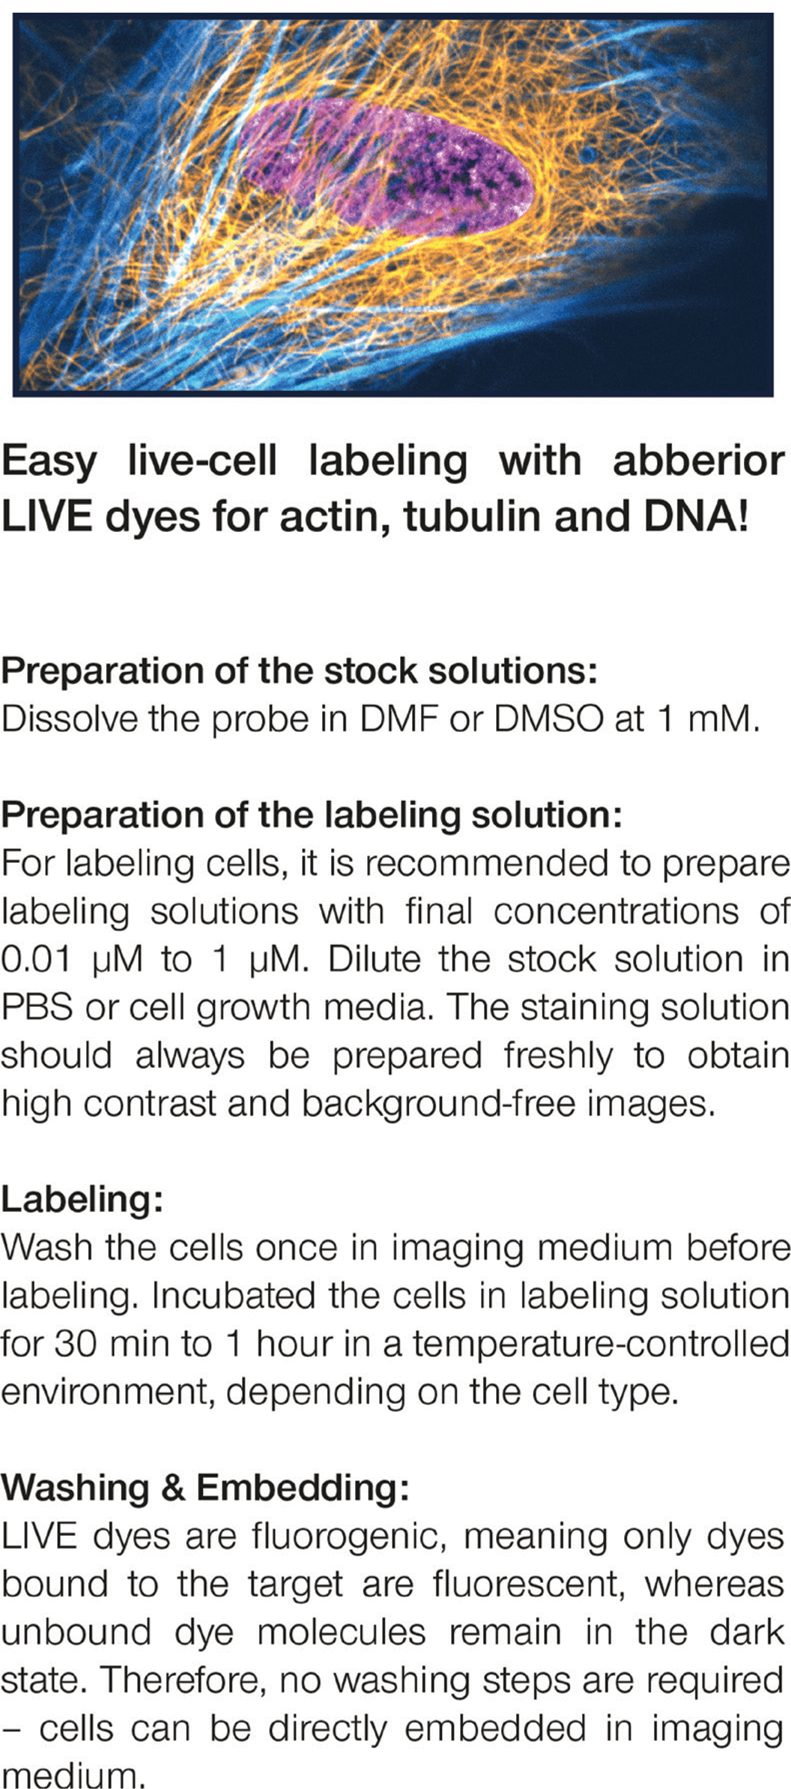
Figure 5: Example procedure for preparation of LIVE dyes and labeling of live cells.
Flexibility for Live-Cell Imaging
Commercially available live dyes only cover a limited number of molecular targets because each target requires its own specific reactive group. The recent development of genetically encoded self-labeling protein tags overcomes this limitation. The most well-known self-labeling protein tag is SNAP-tag®, which is derived from a mammalian DNA repair enzyme. Together with its ligand benzylguanine, SNAP-tag® enables specific and covalent coupling of a fluorophore to a protein of interest in living cells or organisms. SNAP-tag® labeled proteins can be either overexpressed in addition to the native protein or endogenously expressed by genome engineering, for example, using CRISPR/Cas9 technology [Reference Keppler18]. The combination of a highly versatile choice of target proteins with the ability to label them with photostable organic dye SNAP ligands paves the way for many novel applications of live-cell super-resolution STED microscopy (Figure 6).
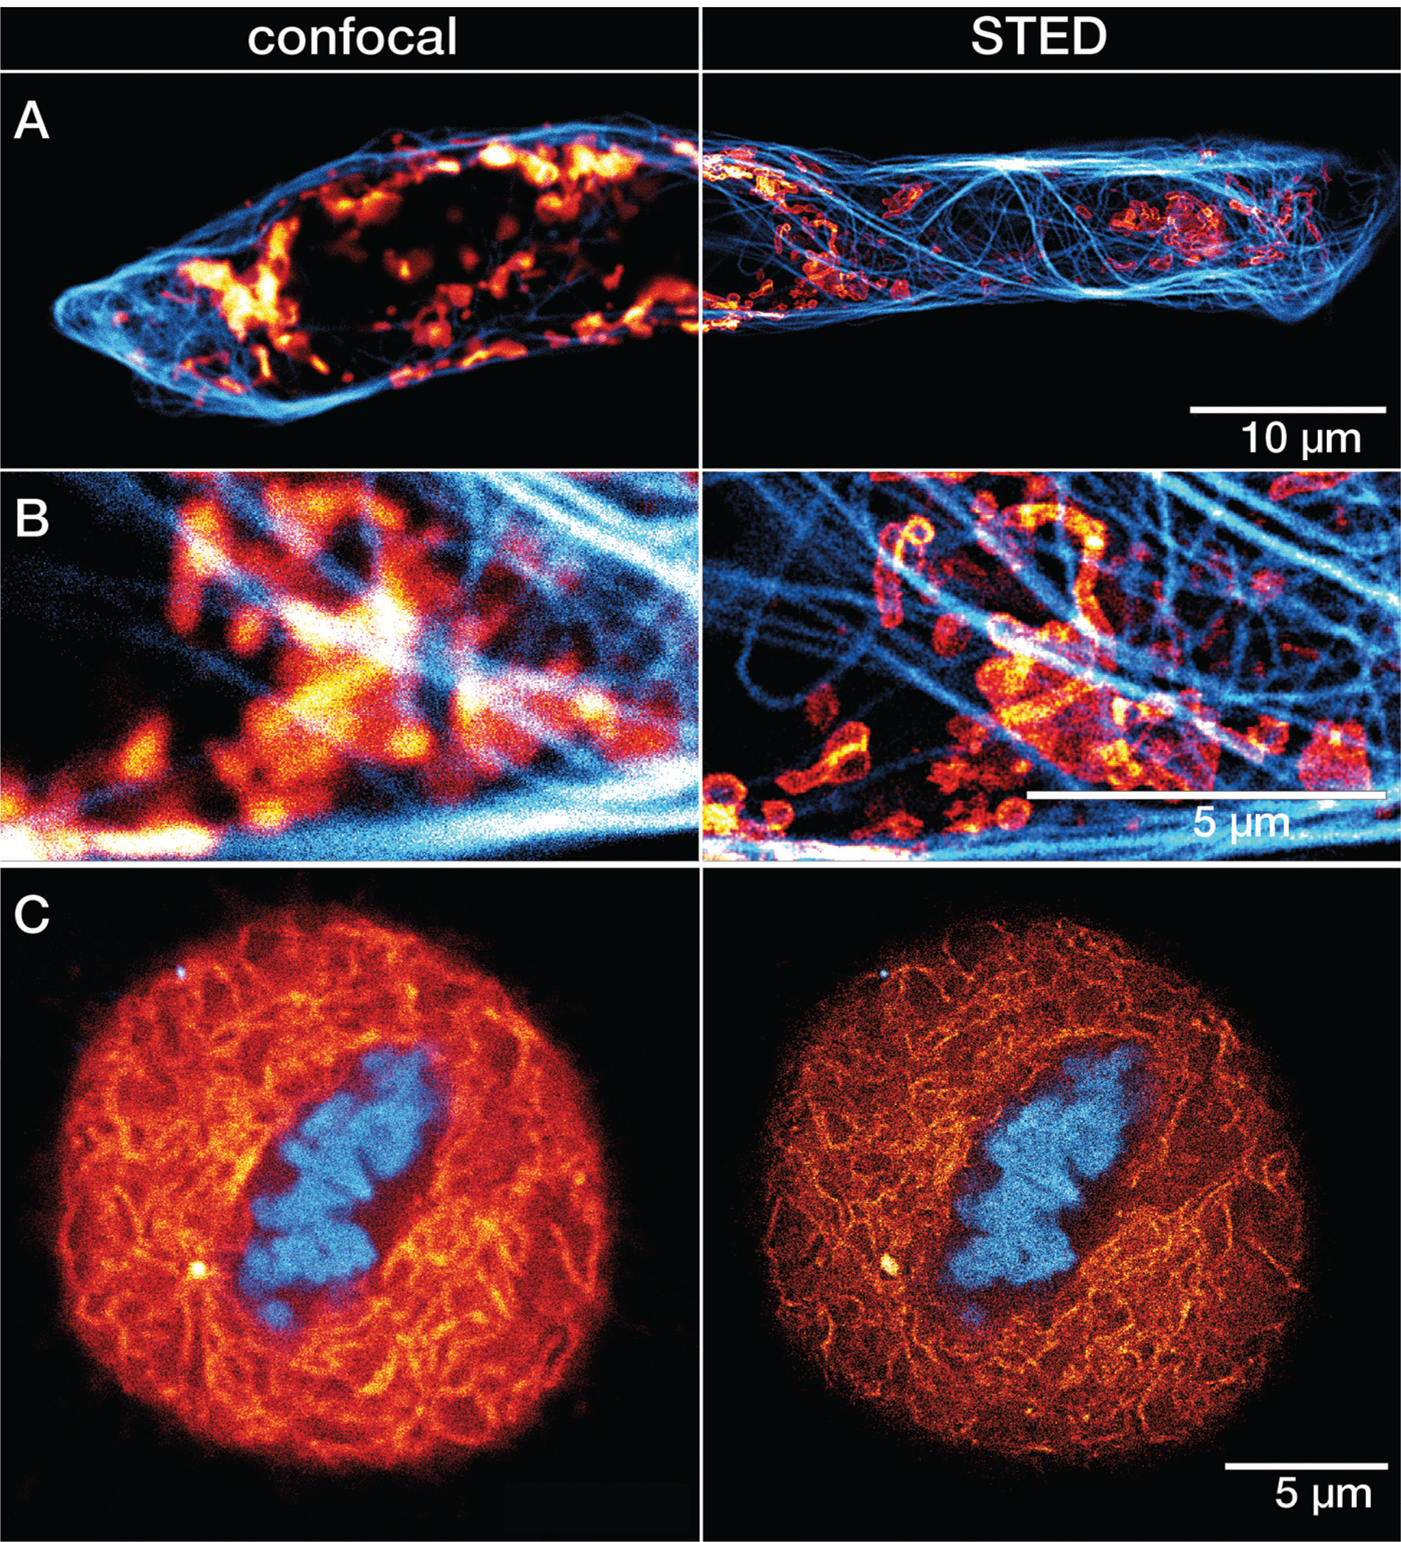
Figure 6: A) Confocal and STED recordings of a cultured mammalian cell expressing a fusion protein at the outer membrane of mitochondria (OMP25-SNAP). The OMP25 fusion protein was labeled with LIVE 610 SNAP ligand (red), and tubulin filaments were directly labeled with LIVE 550 tubulin (cyan). Cells were incubated for 30 min at 37°C (CO2 buffered environment) in a staining solution with 1 μM of LIVE 610 SNAP, followed by a 30 min incubation with 0.1 μM staining solution of LIVE 550 tubulin. B) Magnified regions of interest comparing confocal and STED. C) Confocal and STED images of a mammalian culture cell during metaphase. The cell is expressing a fusion protein in the endoplasmic reticulum lumen with SNAP and C-terminal tetrapeptide KDEL (SNAP-KDEL). The KDEL fusion protein was labeled with LIVE 610 SNAP ligand (red), and DNA was directly tagged with LIVE 560 DNA probe (cyan). Cells were incubated for 30 minutes at 37°C (CO2 buffered environment) in a staining solution with 1 μM of LIVE 610 SNAP, followed by a 30 min incubation with 0.1 μM staining solution of LIVE 560 DNA. The SNAP expression constructs were a gift from Francesca Bottanelli, FU Berlin, Germany. All images were acquired with an abberior STEDYCON microscope and deconvolved using a difference of Gaussian filter.
Live-Cell STED and Confocal Imaging with Minimized Light Dose
Live-cell STED microscopy can address a wide range of novel questions [Reference Stockhammer and Bottanelli19]. However, for live-cell STED imaging, additional challenges such as cellular viability and stress responses need to be considered. Minimizing the light dose during live imaging is important to reduce any phototoxic effects. This need led to the development of STED microcopy methods that minimize the light exposure of the sample. The implementation of pulsed excitation and STED lasers together with time-resolved detection were the first steps to lowering the applied light dose while also improving image quality [Reference Göttfert20].
The recent development of intelligent illumination methods such as RESCue (reduction of state transition cycles) and DyMIN (dynamic intensity minimum) have reduced the light dose of STED microscopy even further. With the implementation of these methods, the light dose of STED microscopy can be reduced by up to one order of magnitude, therefore minimizing the light-induced damage of the living sample and photobleaching of the fluorophore [Reference Heine21]. These smart and innovative ways to reduce the intensity and time of illumination are commercially available in the abberior FACILITY and INFINITY STED microscopes.
Both adaptive illumination schemes reduce the total light dose the sample is exposed to by employing probing steps. With RESCue, a quick confocal probing step using the excitation laser is applied to the sample, checking each pixel to determine if any signal is present. If not, it is concluded that there are no interesting structures at this pixel, and illumination is immediately shut down. Only if fluorescent signal is detected during the probing step is the STED laser turned on and the resulting fluorescence detected. Using this configuration, illumination is only affected in regions where there is no labeled structure to image. For regions where there is structure present, the STED beam is on, and imaging proceeds as normal. Therefore, the technique remains highly quantitative.
To further reduce the area of the sample that is exposed to STED illumination at maximum intensity, additional probing steps are needed. This is achieved with DyMIN imaging schemes, which probe for structures in a multi-step process using not only the excitation laser, but also very low levels of STED light. Like RESCue imaging, DyMIN initially makes use of a confocal probing step, and when no signal is detected in a given pixel, illumination is turned off completely. If sufficient fluorescent signal is present during the confocal probe step, STED light is applied at very low intensity to boost resolution in a second probe step. As a result, the precise location of the fluorescent structures can be further narrowed. If the structure is out-of-focus or lacks signal intensity, light is immediately shut off for the rest of the pixel time. However, if enough signal is detected in this low-power STED probe step, STED illumination is switched to full power for image acquisition with high resolution. This multi-step probing at increasing resolutions reduces bleaching of the fluorophores and phototoxic effects in living systems by orders of magnitude and therefore allows high-resolution live-cell imaging over long periods of time (Figure 7A–7B) or enables volumetric imaging at high resolution in all three dimensions.
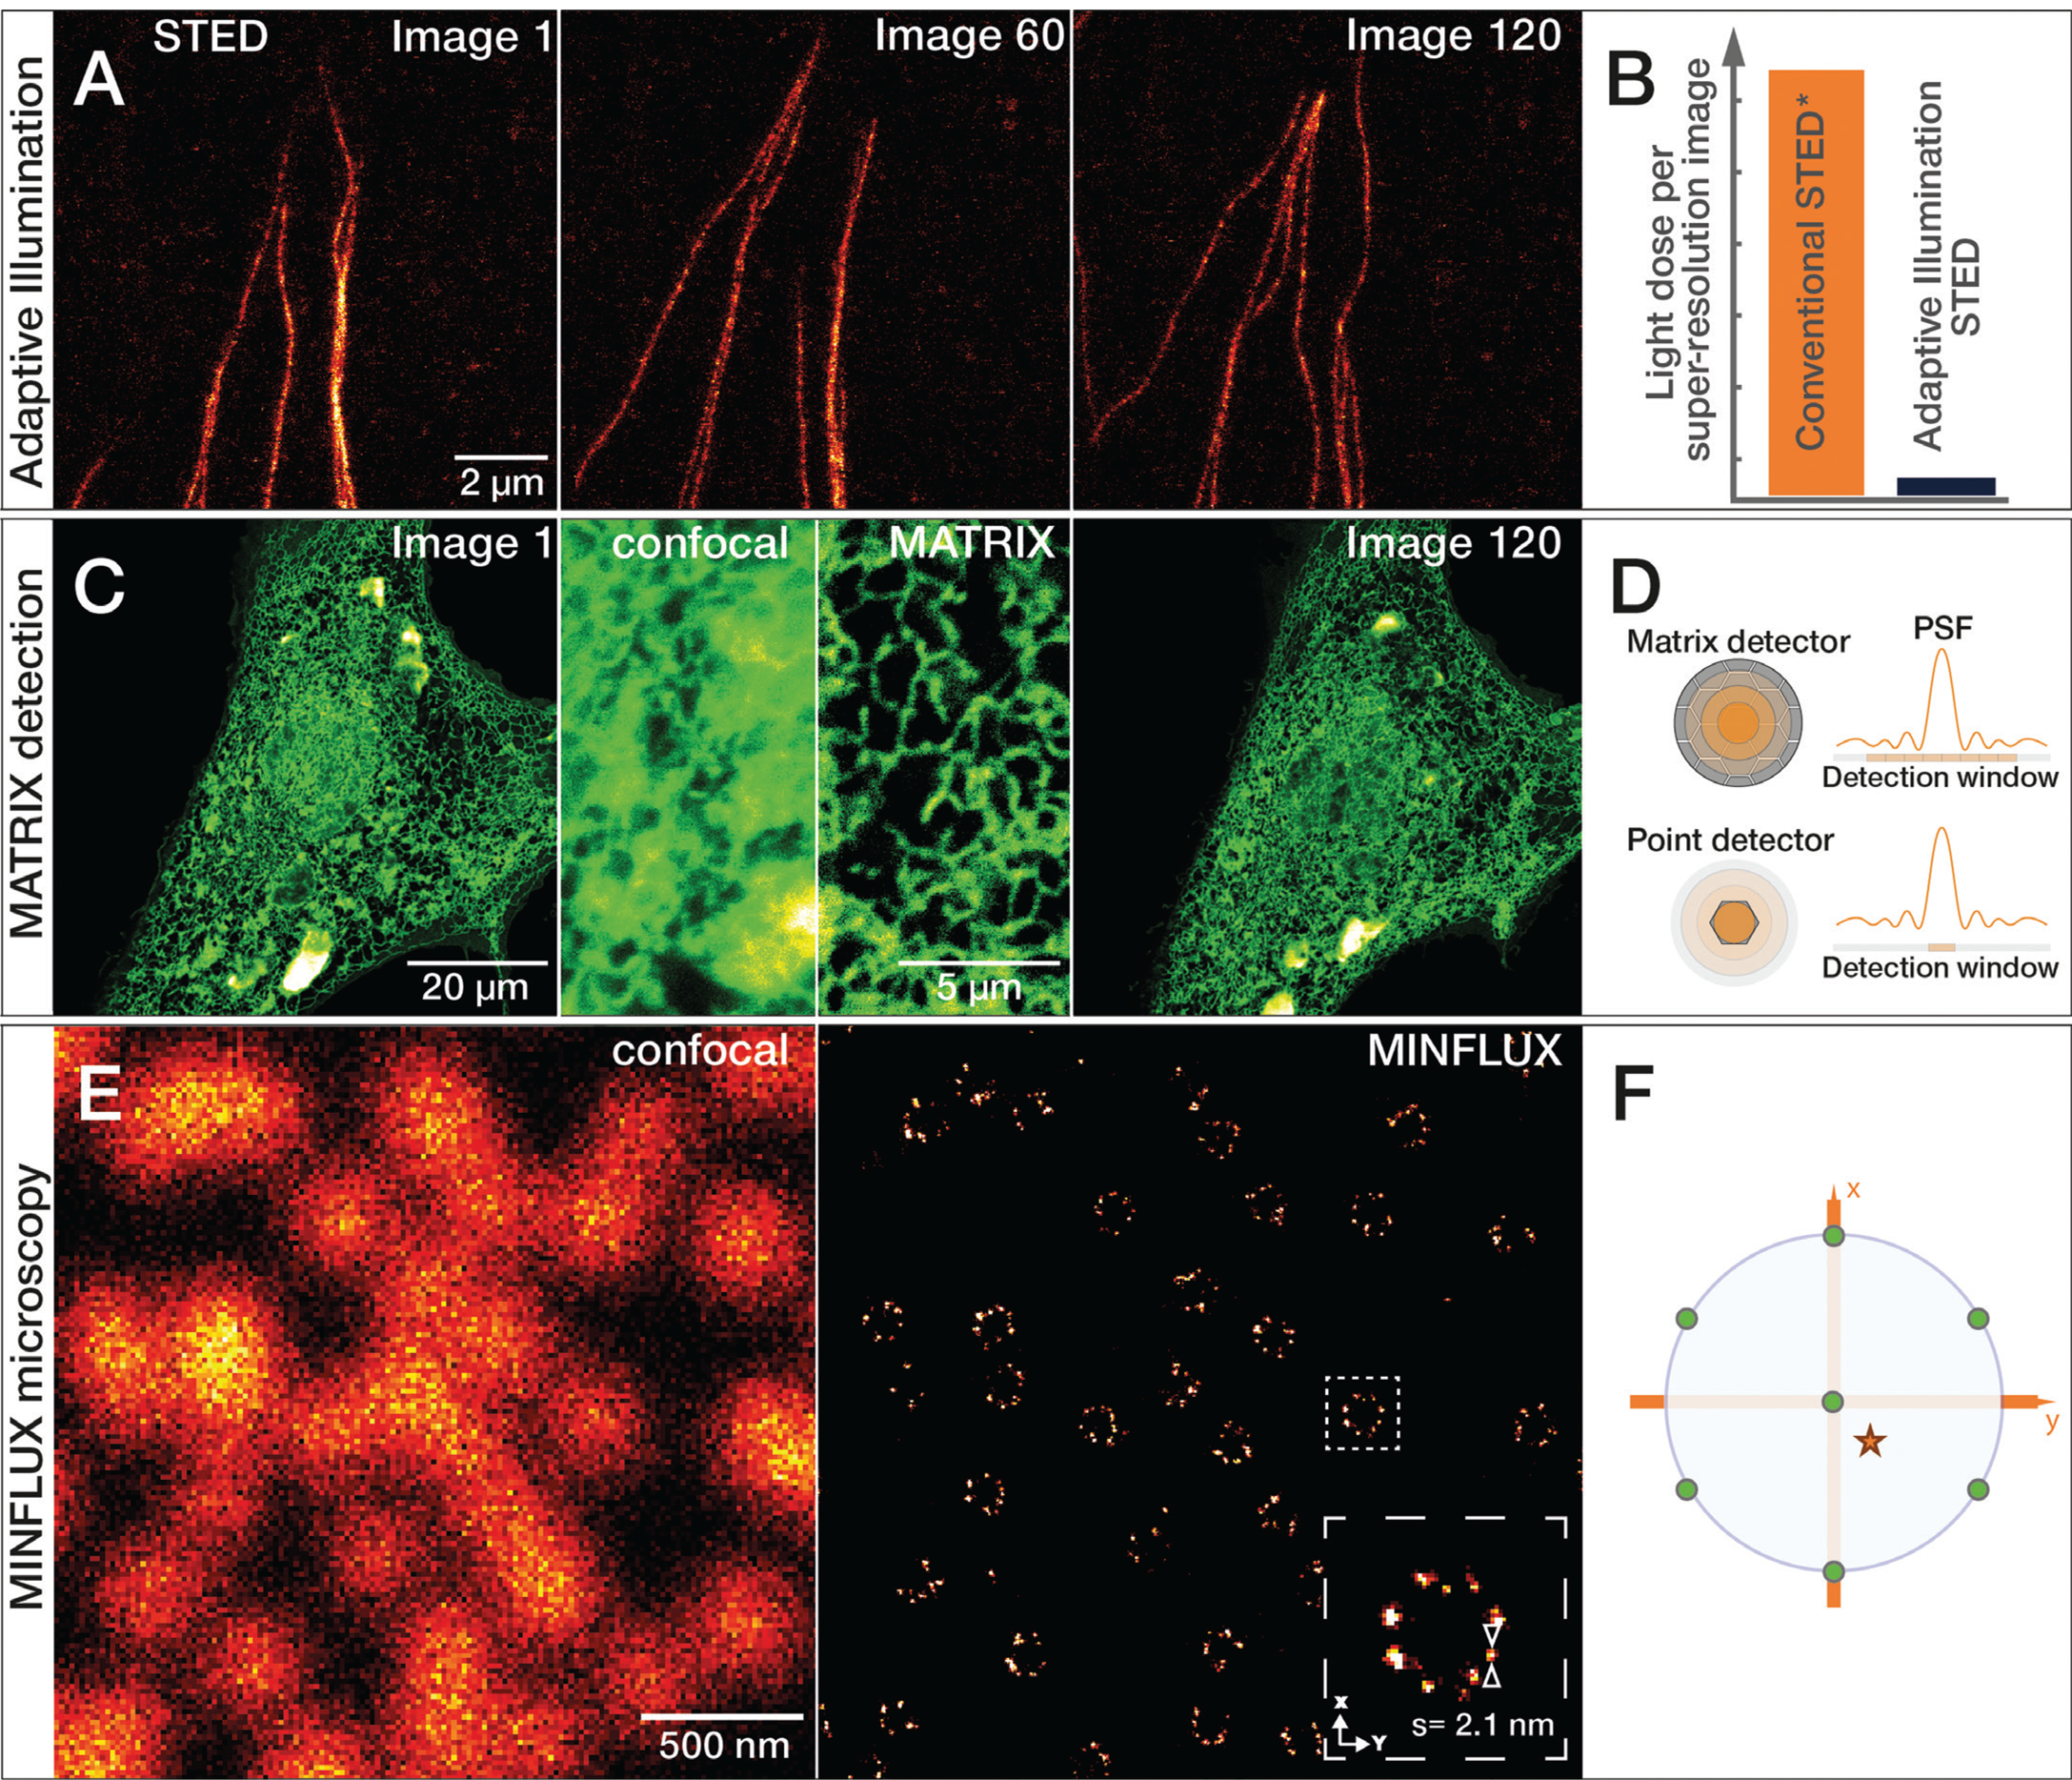
Figure 7: A) Growing tubulin fibers of human fibroblasts. The much lower light reduces photobleaching effects of adaptive illumination and allows long-term time-lapse imaging of living cells. Here, 120 images of the same sample area were recorded at 50 nm resolution without significant bleaching. B) Bar diagram of light dose reduction, comparing adaptive illumination STED imaging schemes and continuous wave (CW) STED* laser. C) Living cells expressing GFPSpark-tagged TGF-beta type III receptors imaged with the MATRIX detector. Comparison of confocal and MATRIX shows the improved signal clarity. Sample by Leonard Drees, MPIbpc Göttingen, Germany. D) The MATRIX detector consists of more than 20 individual elements that allow detection of signal within the focal plane together with signal from planes above and below the structure of interest. The MATRIX detector elements create a large detector array that records the center of the point spread function (PSF) as well as lateral parts. Compared to a single-point detector, much more information is recorded with MATRIX elements. E) Comparison of 2D confocal and MINFLUX image of the nuclear pore complex subunit NUP96. F) For 2D MINFLUX, a hexagonal pattern with a central point is used for probing positions with a donut-shaped excitation beam, shown on the probing position (green dots) relative to a fluorescent molecule (red star). Adaptive Illumination STED, MATRIX detection, and MINFLUX microscopy are patent-protected.
MATRIX Detection – Reducing Background Haze
Laser scanning confocal microscopy is based on the application of a pinhole in the detection path of the microscope, which improves optical sectioning and consequentially the signal-to-background ratio of the image.
In 2020, a new type of detector was developed for STED microscopes that improves the signal-to-background ratio even further. The abberior MATRIX detector consists of an array of over 20 small avalanche photodiodes, which combine the resolution power of a small pinhole with the light collection efficiency of a large detector area. In addition, viewing the focus point from different angles with multiple detector elements allows background signal to be distinguished from foreground signal and subsequently subtracted. Even strong, varying background can be effectively subtracted, and optical sectioning increased significantly. MATRIX detection is especially advantageous in imaging regions where proteins and organelles are densely packed (Figure 7C–7D).
The Next Innovation Wave Has Already Started – MINFLUX Microscopy with Molecular Resolution
Super-resolution microscopy continues to evolve in accelerating innovation cycles. MINFLUX (minimal emission fluxes) nanoscopy achieves an even higher localization precision down to the molecular scale. Below 1 nm in 2D and below 2.5 nm in 3D imaging modes are achieved. MINFLUX is a single molecule localization microscopy (SMLM) technique, which uses a donut-shaped excitation focus to excite individual fluorescent molecules separated by stochastic blinking. The position of the fluorophore is then determined by triangulation using the relative intensity of the fluorescence signals at various known positions of the excitation donut (Figure 7E–7F). These localizations can be determined with an unprecedented low number of photons and consequently within a spatio-temporal regime that exceeds all currently existing techniques [Reference Gwosch22,Reference Schmidt23].
Novel imaging techniques generate new requirements for fluorophores and their ligands. To investigate dynamic processes in living systems at a sub-nanometer level with MINFLUX, switchable live-cell compatible fluorophores need to be developed. Since MINFLUX has a resolution down to the single-molecule level, the size of the labels becomes more relevant. Future developments in click chemistry and unnatural amino acids are likely to provide additional labeling strategies with minimal label size in living cells and organisms [Reference Murrey24]. Extrapolating from the rapid development of tools for super-resolution live-cell imaging in recent years, future developments will likely facilitate many fundamental biological discoveries and deepen our understanding of the nano-architecture of life.