


Introduction
Overall extinction risk for chameleons is substantially higher than the global average of c. 15% for squamate reptiles (Böhm et al., Reference Böhm, Collen, Baillie, Bowles, Chanson and Cox2013), with 34% of species categorized as threatened and 18% as Near Threatened (IUCN, 2019). Most threatened species are forest specialists, with habitat loss and degradation being the primary threat (Tolley et al., Reference Tolley, Alexander, Branch, Bowles and Maritz2016). Given that forest chameleons are intolerant of transformed habitats, as forest is lost chameleon populations decline and become locally extinct. There are five Critically Endangered forest-living chameleon species in mainland Africa, all threatened by forest loss (IUCN, 2019). They inhabit small rainforest patches on mountain inselbergs that tend to have high endemicity (Menegon et al., Reference Menegon, Doggart and Owen2008; Conradie et al., Reference Conradie, Bittencourt-Silva, Engelbrecht, Loader, Menegon and Nanvonamuquitxo2016; Gereau et al., Reference Gereau, Cumberlidge, Hemp, Hochkirch, Jones and Kariuki2016; Lyakurwa et al., Reference Lyakurwa, Howell, Munishi and Treydte2019). Thus, the loss of forest patches results in the extinction of endemic species (e.g. Betts et al., Reference Betts, Wolf, Ripple, Phalan, Millers and Duarte2017), including chameleons.
The Critically Endangered Rhampholeon chapmanorum is a small (3.5–5.5 cm body length), terrestrial chameleon endemic to the low elevation rainforest of the Malawi Hills near Nsanje in southern Malawi (Fig. 1, Plate 1). These mountains rise to c. 900 m and were once covered by dense rainforest, primarily on the eastern slopes between 700–900 m (Dowsett-Lemaire et al., Reference Dowsett-Lemaire, Dowsett, Dyer, Fishpool and Evans2001). At the time of the description of R. champanorum there were indications that substantial areas of forest were being lost (Tilbury, Reference Tilbury1992). To safeguard the species, 37 individuals (24 females and 13 males) from the type locality in the Malawi Hills were released in 1998 in a forest patch at Mikundi, Malawi, c. 95 km to the north (Dowsett-Lemaire et al., Reference Dowsett-Lemaire, Dowsett, Dyer, Fishpool and Evans2001; Tilbury, Reference Tilbury2018). Follow-up surveys at the release site in 2001 and 2012 confirmed the population was present (C.R. Tilbury, unpubl. data). However, given the apparent loss of forest in the species' natural range, it was uncertain whether the remaining forest fragments still contained viable populations (Tolley et al., Reference Tolley, Menegon and Plumptre2014).

Fig. 1 (a) Overview map of sites searched for Rhampholeon chapmanorum. Broken circle shows the locality for Mikundi (exact locality obscured) and the square shows the Malawi Hills locality, and (b) forest patches in the Malawi Hills superimposed on a topographic map with contour lines. The present extent of forest patches is shaded, with the estimated extent in 1984/1985 shown by the dotted lines. Type locality is indicated by the black dot. Forest patches are numbered as in Table 1, except patches 6 and 7, which were not surveyed.
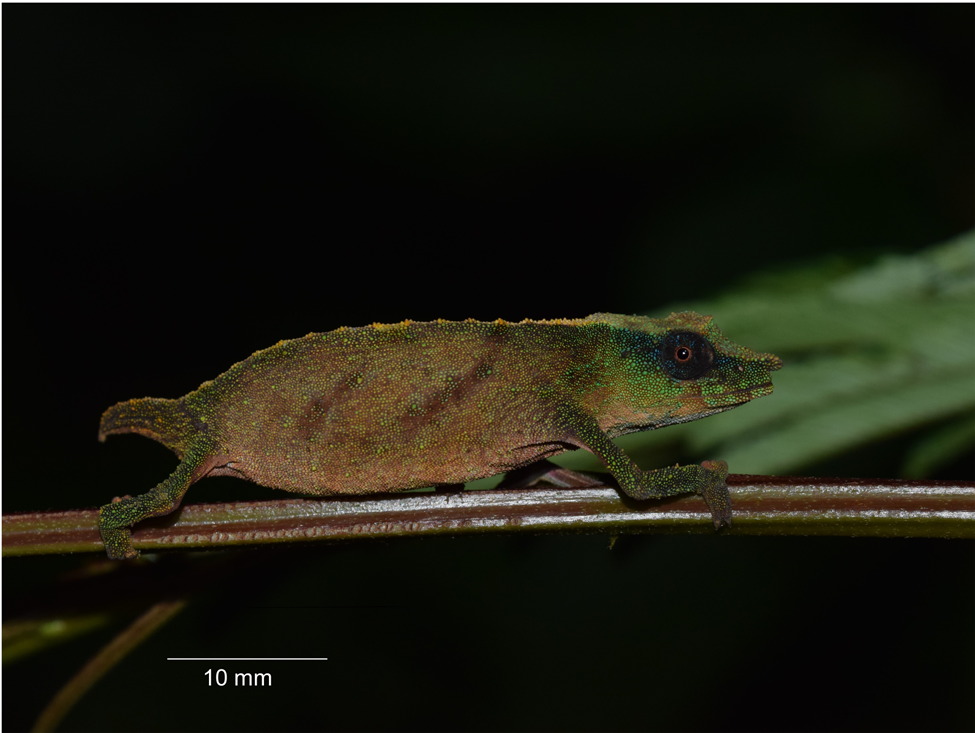
Plate 1 Male Rhampholeon chapmanorum in Mabunga forest.
Table 1 Forest patch areas in the Malawi Hills in 1984/1985 and 2019, with estimated extent lost. Patch numbers (in parentheses) correspond to the numbers in Fig. 1b.

Rhampholeon chapmanorum is unlikely to inhabit transformed areas, and therefore forest degradation, fragmentation and loss would be expected to cause an overall demographic decline (e.g. Andrén, Reference Andrén1994), leading to local extinctions. Furthermore, the loss of connectivity between populations affects ecosystem functioning, disrupts metapopulations, reduces gene flow and increases genetic population structure even over small spatial scales. Thus, the effect of habitat loss on the population is both direct (via population decline) and indirect because genetic diversity and gene flow are expected to diminish over time, reducing the adaptive potential of the population (Haddad et al., Reference Haddad, Brudvig, Clobert, Davies, Gonzalez and Holt2015; Leigh et al., Reference Leigh, Hendry, Vázquez-Domínguez and Friesen2019). The latter effects can be amplified in small populations because genetic drift is greater, leading to strong differentiation in genetic structure between populations, and inbreeding depression through fixation of deleterious alleles and elevated homozygosity, reducing resilience (Hanski, Reference Hanski2011). Information on population size, spatial genetic structure and diversity is therefore required to understand fully the extinction risk for R. chapmanorum.
To investigate these issues, we surveyed forest patches in both Malawi Hills and Mikundi, to assess whether R. chapmanorum populations are extant, quantified the extent of forest loss in the Malawi Hills using recent and historical satellite imagery as a proxy to gauge demographic decline, and examined the genetic structure and diversity of the populations. Because there are no historical baseline estimates of population size or genetic structure/diversity, we assume that demographic decline is proportional to forest loss. We predicted that fragmentation has disrupted gene flow, leading to strong differentiation of genetic structure and low genetic diversity.
Methods
We estimated the extent of forest loss using historical (1984/1985) and recent (2019) satellite imagery of Malawi Hills from Google Earth (Google, Mountain View, USA). Historical satellite images were of poor quality, and therefore images from both 1984 and 1985 were used. Polygons were created around each of the forest patches for these time periods, exported as kmz files, mapped in QGIS 2.18 (QGIS Development Team, 2016) and their areas quantified. The 700 m contour was used as a guide to assess where low elevation rainforest might have originally occurred (e.g. Dowsett-Lemaire et al., Reference Dowsett-Lemaire, Dowsett, Dyer, Fishpool and Evans2001).
Logistical constraints did not allow us to survey all the forest patches, but we were able to access two forest patches in the Malawi Hills and one at Mikundi, during 13–16 March 2016 (Fig. 1). We walked forest trails at night to record chameleons, using torchlight. Transects were defined by presence of trails and were therefore neither randomly chosen nor of a set distance or time. The location of each chameleon encountered was recorded (± 3 m) and a tissue sample was taken from a subset of adult chameleons (c. 2 mm tail clip) for genetic analysis. All individuals were returned to the same perch on which they were found.
To assess the genetic diversity within and between populations from each forest patch, an 845 bp fragment of the ND2 mitochondrial gene was sequenced for 19 individuals. Genomic DNA was extracted using salt extraction (MacManes, Reference MacManes2008). ND2 was amplified in a PCR reaction volume of 25 μl with 0.4 μl of 10 mM dNTPs, 2.5 μl of 25 mM MgCl2, 0.3 μl of 10 pmol forward (vMet2) and reverse (vTrp) primer (Cunningham & Cherry, Reference Cunningham and Cherry2004), 2.5 μl of Mg2+ free buffer solution, 0.15 μl Taq polymerase, and 1–2 μl of 25 ng/μl DNA template. Thermal cycling included initial denaturation for 4 min at 95 °C followed by 35 cycles denaturation for 45 s at 94 °C, annealing for 45 s at 52 °C, extension for 60 s at 72 °C, and final extension for 10 min at 72 °C. PCR products were run on a 1% agarose gel and visualized under a UV light to verify amplification. Amplicons were sequenced using the forward primer at Macrogen Inc. (Amsterdam, The Netherlands). Sequences were edited and aligned in Geneious R11 (Geneious, 2021) and deposited in GenBank (accession numbers: MT779023–MT779042). In addition, sequence from an individual originally sampled in 1998 from the type locality was available on GenBank (AY524919) for comparison.
Haplotype (h) and nucleotide (π) diversity for each locality was estimated (Tamura–Nei model of substitution, α = 0.01) using Arlequin 3.5 (Excoffier & Lischer, Reference Excoffier and Lischer2010). A haplotype network was constructed using Network 5.0.1.1 (Bandelt et al., Reference Bandelt, Forster and Röhl1999; Polzin & Daneschmand, Reference Polzin and Daneschmand2003) to assess shared haplotypes between localities, including the two GenBank sequences from the type locality. To examine genetic structure between forest patches, an analysis of molecular variance (AMOVA) was run, estimating pairwise ΦST in Arlequin.
Results
The satellite imagery showed that the forest extent in the Malawi Hills may have been c. 196 ha in 1984, in three patches (Table 1). As of 2019, the patches were much reduced, with two of the three patches fragmented into smaller patches totaling c. 40 ha, and the forest at the type locality completely cleared (Fig. 1). Currently, Mabunga forest is the largest intact patch (16.6 ha), having been reduced from 35 ha since 1984. Overall, we estimate c. 80% forest loss during 1984–2019. Given that the original extent (pre-1984) is not known, the magnitude of loss could have been greater as the original forest extent may have reached the lower slopes (e.g. Dowsett-Lemaire et al. Reference Dowsett-Lemaire, Dowsett, Dyer, Fishpool and Evans2001). There are also two additional low forest patches (at 550–620 m) on the western slopes of the Malawi Hills (13 and 3.9 ha; patches 6 and 7, respectively, in Fig. 1), but it is unknown if they provide suitable habitat for chameleons.
We surveyed two of the five rainforest forest patches that were furthest apart. The first patch (1.19 ha) is c. 1.8 km south-west of the type locality (Fig. 1; patch 1). Local community leaders indicated that the Chief's ancestors are buried in the forest, and it is considered sacred ground. We were therefore only permitted to survey along a footpath that skirted just inside the forest, where we recorded seven adult chameleons (six females, one male) during one evening. Although we were not permitted further inside this forest our observations of chameleons along the footpath suggest there is a population within the sacred forest, despite the small size of this patch. The second, Mabunga forest (Fig. 1; patch 5; 16.6 ha), is c. 7 km to the south-west of the first. We did not observe chameleons on the forest edge, but we recorded 10 individuals inside the forest along a footpath (seven females, three males) during one evening. Midway between the Chief's ancestors and Mabunga forests there are additional patches (Fig. 1; patches 2, 3 & 4; the latter two at Mwanambweli forest) that we were not able to access, but given their location and extent, we assume there are chameleon populations present. Finally, we surveyed the forest patch at Mikundi (Fig. 1) where chameleons had been released in 1998. We recorded 21 adult chameleons, plus 11 juveniles and hatchlings (body size 1.5–2.0 cm) during one evening, but we did not observe chameleons on the forest edge or outside the forest.
Estimates of genetic diversity for all populations were within the range considered normal compared to other chameleon and small-bodied reptile species (Table 2; cf. Hague & Routman, Reference Hague and Routman2016; Main et al., Reference Main, van Vuuren and Tolley2018; Rutherford et al., Reference Rutherford, Ontano, Kantor and Routman2019). There were no shared haplotypes between forest patches, including those previously sequenced from the original at the type locality (Fig. 2). Similarly, the AMOVA showed a significant difference between each of the forest patches (ΦST = 0.23, P < 0.001) suggesting strong differentiation of genetic structure between populations and reduced gene flow across the relatively small distances between the patches surveyed in the natural range (Table 3).

Fig. 2 Haplotype network for R. chapmanorum with haplotypes shaded according to locality where chameleons were sampled. Branch lengths are proportional to the number of mutations and circle size is proportional to the number of individuals with that haplotype.
Table 2 Genetic diversity estimates (± SD) for Rhampholeon chapmanorum from three forest patches, showing haplotype diversity h, nucleotide diversity π and number of haplotypes H. Patch numbers (in parentheses) correspond to the numbers in Fig. 1b.

Table 3 Pairwise analysis of molecular variance for R. chapmanorum from three forest patches, with Φ ST values (bottom matrix) and P values (top matrix). Patch numbers (in parentheses) correspond to the numbers in Fig. 1b.

Discussion
Although populations of R. chapmanorum persist in the Malawi Hills, the forest extent has been significantly reduced to a total of c. 40 ha. We can confirm there are extant populations in at least two of the five forest patches at higher elevations, and we assume the other higher elevation patches also hold populations. There are two patches at lower elevation that we did not survey, and we cannot assume that R. chapmanorum populations are present there, given these are below 700 m and low elevation rainforest was not considered to have occurred there (Dowsett-Lemaire et al., Reference Dowsett-Lemaire, Dowsett, Dyer, Fishpool and Evans2001). Chameleons were not observed outside forest although observations at the sacred forest were made at slightly degraded forest edge. Rhampholeon species are forest specialists (Branch et al., Reference Branch, Bayliss and Tolley2014) and cannot tolerate transformed habitats, so where forest has been destroyed, the populations will have gone locally extinct (as in the type locality). Conversely, chameleons appear to be abundant at the Mikundi release site, with chameleons of all age classes observed.
From aerial photography, the extent of the Malawi Hills forest was previously estimated to be c. 400 ha (Dowsett-Lemaire & Dowsett, Reference Dowsett-Lemaire and Dowsett1988). This is approximately double our estimate of 196 ha for 1984, but the date of the aerial photographs used was not indicated. If the low elevation rainforest covered the mountain down to 700 m (Dowsett-Lemaire et al., Reference Dowsett-Lemaire, Dowsett, Dyer, Fishpool and Evans2001) the forest extent could have been 1,050 ha historically. Although speculative, this could mean that 96% of the original forest has been lost. Our estimate of a minimum of 80% forest loss since the mid 1980s is likely to have resulted in a similar decline of R. chapmanorum, or at least a dramatic population decline over at least 35–40 years. Despite this, genetic diversity is not low, but this can be explained by the lack of a linear relationship between genetic diversity and population declines that result from habitat loss (Pflüger et al., Reference Pflüger, Signer and Balkenhol2019). Erosion of genetic diversity at detectable levels has a long time lag that is influenced by the effective population size, the number of generations and the degree of habitat loss and fragmentation (e.g. Tilman et al., Reference Tilman, May, Lehman and Nowak1994; Krauss et al., Reference Krauss, Bommarco, Guardiola, Heikkinen, Helm and Kuussaari2010; Hoban et al., Reference Hoban, Arntzen, Bruford, Godoy, Hoelzel and Segelbacher2014; Wu et al., Reference Wu, Chen, Chang, Chen and Shen2020). Conversely, genetic structure responds more rapidly to habitat fragmentation (Keyghobadi et al., Reference Keyghobadi, Roland, Matter and Strobeck2005; Pflüger et al., Reference Pflüger, Signer and Balkenhol2019) because gene flow is impeded by isolation of local patches (Balkenhol et al., Reference Balkenhol, Pardini, Cornelius, Fernandes and Sommer2013). Populations of R. chapmanorum do not have reduced genetic diversity but they do have strong differentiation of genetic structure, with no shared haplotypes despite the short distance between them. This indicates that gene flow has been disrupted over a scale of just a few kilometres and that the metapopulation is not intact, increasing extinction risk.
Individuals from the released population at Mikundi are in the same haplotype group as those from the type locality and the Chief's ancestors sacred forest, although the haplotypes occur at different frequencies. Given that the original released population was small, the observed difference is probably the result of a founder effect in which the released individuals were not a random sample of the range of haplotypes in the original population. This can result in haplotype frequency differences between the new and source populations, and the effect can be magnified over time as genetic drift changes the proportions of haplotypes. In this case, assuming the generation time of Rhampholeon is 1–1.5 years, there would have been 15–20 generations since the release, which is sufficient time for genetic drift to have differentiated the populations given the small founding population.
Overall, our findings indicate there has been a severe demographic decline with disruption of gene flow as a result of extreme forest loss. The effects of this decline have yet to be fully manifested in the genetic composition, as genetic diversity and differentiation can continue to be negatively affected for many generations after habitat loss is halted, even with subsequent population size increases (Pflüger et al., Reference Pflüger, Signer and Balkenhol2019). The genetic differentiation shows that gene flow has already been disrupted, and the forest loss requires immediate attention to prevent further loss of genetic diversity. Urgent conservation action is needed, including halting of forest destruction and recovery of habitat to promote connectivity. Although part of the Malawi Hills falls within a Key Biodiversity Area (Matandwe Forest Reserve) most of the forest falls outside the reserve boundary (c.f. BirdLife International, Reference BirdLife International2020), and the effectiveness of the forest reserve is questionable, given that most of the destruction has been within its boundaries. Although extending the reserve to encompass all the forest patches would be a first step, measures are needed to avert the destruction of the remaining patches. In addition to R. chapmanorum, other endemic species could occur there, which would add weight to the need to conserve the remaining patches. Unfortunately, few surveys have been carried out in the area, with only widespread species of plants, birds and butterflies recorded (Dowsett-Lemaire et al., Reference Dowsett-Lemaire, Dowsett, Dyer, Fishpool and Evans2001).
A species action plan that defines conservation activities is urgently needed for R. chapmanorum. However, both the planning and the recommended actions require strong leadership, personnel, stakeholder engagement, including with government departments, and sufficient funding to ensure success. Many international organizations support the production and execution of species action plans (e.g. IUCN Species Survival Commission, WWF) and the involvement of these or analogous organizations will be essential to prevent the extinction of this species in the wild.
Acknowledgements
We thank the Museums of Malawi for assisting with logistics and facilitating permits for this work; the South African National Biodiversity Institute for support; and for funding, the Scion Natural Science Association and the numerous contributors to crowd-source funding at Rockethub.
Author contributions
Project conceptualization, sourcing of funding: KAT, CVA; field work, analysis: KAT; field work, planning: CRT, GB, YC; laboratory work, analysis: JMDS; writing: KAT, with assistance from all authors.
Conflicts of interest
None.
Ethical standards
This project abided by the ethical standards of Oryx, and the ethical guidelines of the British Herpetological Society (2017). Research was carried out under clearance from the South African National Biodiversity Institute (#0001–2015), under agreement with the Museums of Malawi, Blantyre, a permit from the Malawian Department of Forestry—Forestry Research Institute, Zomba (14 January 2016), and permission from the Malawian Department of National Parks and Wildlife, endorsed by the Malawian National Commission for Science and Technology, Lilongwe (22 December 2015).


 Open access