


Introduction
The clouded leopard Neofelis sp. is a medium-sized felid with a body weight of c. 19 kg and a head–body length of up to 1 m (Hearn et al., Reference Hearn, Ross, Pamin, Bernard, Hunter and Macdonald2013). The species is categorized as Vulnerable on the IUCN Red List (Gray et al., Reference Gray, Borah, Coudrat, Ghimirey, Giordano and Greenspan2021), indicating that it faces a high risk of extinction. Deforestation and poaching for the illegal wildlife trade are the main threats to this species (Gray et al., Reference Gray, Borah, Coudrat, Ghimirey, Giordano and Greenspan2021). The clouded leopard ranges from central Nepal and southern China to Peninsular Malaysia and the islands of Sumatra and Borneo (Austin et al., Reference Austin, Tewes, Grassman and Silvy2010). DNA and morphological analyses have categorized the clouded leopard into two species: the mainland clouded leopard Neofelis nebulosa and the Sunda clouded leopard Neofelis diardi (Kitchener et al., Reference Kitchener, Beaumont and Richardson2006).
Only a few ecological studies on the mainland clouded leopard have been published, primarily from radio-collared individuals in Thailand (Grassman et al., Reference Grassman, Tewes, Silvy and Kreetiyutanont2005; Austin et al., Reference Austin, Tewes, Grassman and Silvy2010) and Nepal (Dinerstein & Mehta, Reference Dinerstein and Mehta1989), and more recently through camera trapping (India: Borah et al., Reference Borah, Sharma, Das, Rabha, Kakati and Basumatary2014; Singh & Macdonald, Reference Singh and Macdonald2017; Malaysia: Mohamad et al., Reference Mohamad, Rayan, Christopher, Hamirul, Mohamed, Lau and Siwan2015; Ab Razak et al., Reference Ab Razak, Hambali, Amaludin, Rak and Malek2019; Bhutan: Penjor et al., Reference Penjor, Macdonald, Wangchuk, Tandin and Tan2018; Myanmar: Naing et al., Reference Naing, Ross, Burnham, Htun and MacDonald2019; Thailand: Petersen et al., Reference Petersen, Steinmetz, Sribuarod and Ngoprasert2020). Two of these seven camera-trapping studies used the Bayesian method to estimate density (Singh & Macdonald, Reference Singh and Macdonald2017; Naing et al., Reference Naing, Ross, Burnham, Htun and MacDonald2019), four used the maximum likelihood approach (Borah et al., Reference Borah, Sharma, Das, Rabha, Kakati and Basumatary2014; Mohamad et al., Reference Mohamad, Rayan, Christopher, Hamirul, Mohamed, Lau and Siwan2015, Ab Razak et al., Reference Ab Razak, Hambali, Amaludin, Rak and Malek2019; Petersen et al., Reference Petersen, Steinmetz, Sribuarod and Ngoprasert2020) and one used both methods (Penjor et al., Reference Penjor, Macdonald, Wangchuk, Tandin and Tan2018). The estimated density ranged from 0.30 individuals (large areas of southern Bhutan; Penjor et al., Reference Penjor, Macdonald, Wangchuk, Tandin and Tan2018) to 5.14 individuals (Dampa Tiger Reserve, India; Singh & MacDonald, Reference Singh and Macdonald2017) per 100 km2.
Most tropical ungulates, bears and small mammals are difficult to distinguish individually in camera-trap photographs, making it difficult to estimate their population status and density (Pollock et al., Reference Pollock, Nichols, Simons, Farnsworth, Bailey and Sauer2002). Photographic trapping rate has been used widely to estimate relative abundance under the assumption that the detection rate is influenced by actual abundance (Rovero & Marshall, Reference Rovero and Marshall2009; Jenks et al., Reference Jenks, Chanteap, Kanda, Peter, Cutter and Redford2011). Significant correlation between trapping rates and independent density estimates further support the use of the photographic trapping rate as a relative abundance index (Carbone et al., Reference Carbone, Christie, Conforti, Coulson, Franklin and Ginsberg2001; O'Brien et al., Reference O'Brien, Kinnaird and Wibisono2003). The use of relative abundance derived from camera-trap encounter rates is controversial given its biases regarding animal body mass and study design (Sollmann et al., Reference Sollmann, Mohamed, Samejima and Wilting2013): (1) differences between species may lead to bias towards the more detectable species, especially at low detection levels, (2) species with larger home ranges may be photographed more frequently, inflating relative abundance, (3) species-specific responses to different types of trap may bias relative abundance, and (4) changes in detection over time may obscure true population trends inferred from relative abundance. However, there are numerous examples of a linear relationship between the relative abundance index and abundance estimated using more precise methods (Rovero & Marshall, Reference Rovero and Marshall2009; Jenks et al., Reference Jenks, Chanteap, Kanda, Peter, Cutter and Redford2011; Palei et al., Reference Palei, Pradhan, Sahu and Nayak2015).
Niche differentiation has been recognized as a mechanism whereby sympatric species reduce interspecific competition and thus facilitate coexistence. Such resource partitioning could be facilitated by the evolutionary displacement of morphological characters (Dayan & Simberloff, Reference Dayan and Simberloff2005) as well as behavioural mechanisms, and is thought to operate primarily along three axes of niche dimension: space, food and time (Pianka, Reference Pianka1974). Spatio-temporal patterns are crucial aspects of niche partitioning amongst sympatric carnivores (Gil-Sánchez et al., Reference Gil-Sánchez, Mañá-Varela, Herrera-Sánchez and Urios2021), with subordinate predators adjusting their behaviour to avoid overlapping with dominant carnivores (Wang et al., Reference Wang, Allen and Wilmers2015). Determining spatio-temporal patterns can help us gather information regarding cryptic species and their interactions with other sympatric species (van Schaik & Griffiths, Reference van Schaik and Griffiths1996; O'Brien et al., Reference O'Brien, Kinnaird and Wibisono2003; Linkie & Ridout, Reference Linkie and Ridout2011). The forest of Manas National Park in north-east India supports a diverse carnivore community (Bhatt et al., Reference Bhatt, Singh Adhikari, Habib and Lyngdoh2021) of five large (> 15 kg) carnivores (the tiger Panthera tigris, common leopard Panthera pardus, clouded leopard Neofelis nebulosa, dhole Cuon alpinus and Asiatic black bear Ursus thibetanus). Knowledge of the interactions of clouded leopards with the other carnivores in this guild is limited (Sunarto et al., Reference Sunarto, Kelly, Parakkasi and Hutajulu2015; Bhatt et al., Reference Bhatt, Singh Adhikari, Habib and Lyngdoh2021; Kyaw et al., Reference Kyaw, Macdonald, Penjor, Htun, Naing and Burnham2021), yet understanding the mechanisms that facilitate coexistence within this guild of threatened species could inform conservation strategies.
Here we provide new information on clouded leopards in Manas National Park, an important site for the species in mainland South Asia. We assess population density, habitat use and the spatio-temporal factors affecting clouded leopard coexistence with other sympatric carnivores. We test five hypotheses: (1) As clouded leopards prefer primary forests (i.e. evergreen tropical rainforest), mixed moist deciduous forests (Austin et al., Reference Austin, Tewes, Grassman and Silvy2010; Brodie & Giordano, Reference Brodie and Giordano2012; Hearn et al., Reference Hearn, Cushman, Goossens, Macdonald, Ross and Hunter2018) and high elevations (Hutajulu et al., Reference Hutajulu, Sunarto, Supriatna, Budiman, Yahya, Hughes and Mercer2007; Ngoprasert et al., Reference Ngoprasert, Lynam, Sukmasuang, Tantipisanuh, Chutipong and Steinmetz2012; Haidir et al., Reference Haidir, Dinata, Linkie and Macdonald2013; Mohamad et al., Reference Mohamad, Rayan, Christopher, Hamirul, Mohamed, Lau and Siwan2015), we hypothesized their habitat would be associated positively with the normalized difference vegetation index (NDVI), canopy cover, distance to grassland and elevation. (2) As clouded leopard habitat in Southeast Asia is undergoing one of the fastest deforestation rates (Stibig et al., Reference Stibig, Achard, Carboni, Raši and Miettinen2014) and the species is poorly adapted to disturbance, avoiding habitats around human settlements (Gray et al., Reference Gray, Borah, Coudrat, Ghimirey, Giordano and Greenspan2021), we hypothesized a negative relationship between clouded leopard occurrence and anthropogenic variables. (3) As adult clouded leopards are expected to prey on species weighing < 10 kg (< 45% of their body mass) based on carnivore energetic constraints (Carbone et al., Reference Carbone, Mace, Roberts and Macdonald1999), we hypothesized that clouded leopard habitat utilization would be greater where small prey species are more prevalent. (4) As clouded leopards are expected to avoid apex predators in response to predation risk (Thompson & Gese, Reference Thompson and Gese2007), we hypothesized a negative relationship between clouded leopards and other large carnivores. (5) As an overlap of dietary and habitat preferences amongst sympatric species would increase aggregation risk and competition, which can be limited through temporal (Nakabayashi et al., Reference Nakabayashi, Kanamori, Matsukawa, Tangah, Tuuga and Malim2021) and spatial segregation (Fedriani et al., Reference Fedriani, Palomares and Delibes1999) following the competitive exclusion principle (Hardin, Reference Hardin1960), we hypothesized low spatio-temporal overlap between clouded leopards and other sympatric carnivores.
Study area
We conducted this study in the 500 km2 Manas National Park, a UNESCO World Heritage Site in the state of Assam, India. The Park lies on the borders of the Indo-Gangetic and Indo-Malayan biogeographical realms on a gentle alluvial slope in the foothills of the Himalayas, where wooded hills give way to grasslands and tropical forests. The climate is subtropical and is characterized by four seasons: pre-monsoon (March–May), monsoon (June–September), retreating monsoon (October–November) and winter (December–February) (Das et al., Reference Das, Khan, Rabha and Bhattacharjya2009). The temperature and elevation ranges are 5–37 °C and 40–200 m, respectively (Bhattacharjya et al., Reference Bhattacharjya, Kar, Sarma and Patowary2015). Manas National Park comprises three ranges: Bansbari (central), Panbari (western) and Bhuyanpara (eastern). Together with the Royal Manas National Park of Bhutan, the Manas National Park forms one of the largest areas of conservation significance in South Asia, representing the full range of habitats from the subtropical plains to the alpine zone (Wang, Reference Wang2001).
Methods
Field survey
We recorded clouded leopards and other mammal species using camera traps set in forested habitats of Manas National Park. Camera-trap locations were unbaited and selected based on accessibility, terrain features, animal trails and nallahs (seasonal drainages) with carnivore signs (Marinho et al., Reference Marinho, Bezerra, Antongiovanni, Fonseca and Venticinque2018). At each location we placed a single Cuddeback X-Change colour model camera trap (Cuddeback, Green Bay, USA) with motion sensors and set a time lag of 1 s between animal detections. We fastened the cameras to trees at 30–45 cm above ground for an average of 24 days. We used 473 camera-trap locations on a 1 km2 grid, during three periods from April 2017 to May 2019 (Table 1, Fig. 1). We maintained a mean distance of 672 ± SE 15.73 m between camera traps, to optimize capture probability. Previous studies have indicated home ranges of 23–51 km2 for clouded leopards, with exclusive core areas of 3–9 km2 (Austin, Reference Austin2002; Grassman et al., Reference Grassman, Tewes, Silvy and Kreetiyutanont2005), and therefore this inter-trap distance was suitable for the target species. The mean temperature and humidity during the surveys were 24 ± SE 0.3 °C and 79.4 ± SE 0.5%, respectively (Time and Date, 2021).

Fig. 1 Manas National Park, north-east India, showing camera-trap locations, 1 km2 grid cells, drainage and forest cover. We deployed 473 camera traps using a grid-based approach in three survey periods from April 2017 to May 2019 (Table 1). (Readers of the printed journal are referred to the online article for a colour version of this figure.)
Table 1 Details of the three camera-trapping periods and number of independent records and individuals of the clouded leopard Neofelis nebulosa in Manas National Park, north-east India (Fig. 1). The sex of the individuals could not be determined.

Clouded leopard occurrence and density
Preliminary survey
Forest field staff have in-depth knowledge of the conspicuous animal species of Manas National Park. We therefore conducted a preliminary questionnaire survey (Supplementary Material 1) containing closed and open questions of 75 forest officials, to gather baseline information on clouded leopard sightings.
Relative abundance index and density
We calculated relative abundance index values of clouded leopards, their potential prey and other sympatric carnivores as the total number of independent photographs for each species divided by total trap-nights and multiplied by 100 (Carbone et al., Reference Carbone, Christie, Conforti, Coulson, Franklin and Ginsberg2001). We considered animal detections independent if the time between consecutive photographs of the same species was > 30 min (O'Brien et al., Reference O'Brien, Kinnaird and Wibisono2003). Camera traps have been used to estimate clouded leopard densities in landscapes similar to that of Manas National Park (Singh & Macdonald, Reference Singh and Macdonald2017; Naing et al., Reference Naing, Ross, Burnham, Htun and MacDonald2019; Petersen et al., Reference Petersen, Steinmetz, Sribuarod and Ngoprasert2020). We distinguished individual clouded leopards by their distinctive cloud-like pelage pattern. As we deployed a single camera trap at each location, we used the flank with the highest number of photographs for individual identification. To ensure the population closure assumption could be retained, we extracted data for 2 and 3 months from the surveys, as in previous clouded leopard studies (Mohamad et al., Reference Mohamad, Rayan, Christopher, Hamirul, Mohamed, Lau and Siwan2015; Naing et al., Reference Naing, Ross, Burnham, Htun and MacDonald2019). We created detection histories in a standard X matrix format (Otis et al., Reference Otis, Burnham, White and Anderson1978) for each 24-h period. We treated camera stations as proximity detectors; i.e. an individual could be detected by multiple traps during any given period. To approximate the buffer width, we multiplied the root pooled spatial variance value by a factor of 4, as an individual outside such a buffer width has a negligible probability (P < 0.001) of being caught in any trap and so is unlikely to affect density estimates (Efford, Reference Efford2004). We created a grid of 580 × 580 m cells (Mohamad et al., Reference Mohamad, Rayan, Christopher, Hamirul, Mohamed, Lau and Siwan2015; Singh & Macdonald, Reference Singh and Macdonald2017) superimposed over the buffered area, and we extracted the geographical coordinates of the centroids of each cell containing suitable habitat for a habitat mask input file. We excluded non-forest habitat cells (human settlements) from the buffered area. We conducted a closure test (Otis et al., Reference Otis, Burnham, White and Anderson1978) to evaluate whether the population closure assumption was violated. We used the maximum likelihood-based spatially explicit capture–recapture method to estimate density (Efford et al., Reference Efford, Borchers, Byrom, Thomson, Cooch and Conroy2009). Because of the paucity of capture–recapture data, we used only the null model, which includes only an intercept term and no covariates.
Habitat use
Habitat and anthropogenic variables
We focused on four habitat and two anthropogenic variables for clouded leopard habitat use: canopy cover, elevation, NDVI, distance to nearest grassland, distance to nearest settlement and distance to nearest road. We quantified tree canopy cover (30 m resolution) using global tree cover data (Hansen et al., Reference Hansen, Potapov, Moore, Hancher, Turubanova and Tyukavina2013). We determined elevation at each camera-trap site using a digital elevation model based on NASA's ASTER Global Emissivity Datasets (USGS Earth Explorer, 2021), with a spatial resolution of 30 m. For NDVI we obtained Landsat images (30 m resolution) from the Landsat 8 Operational Land Imager sensor in bands 4 and 5 (USGS Earth Explorer, 2021). We then computed NDVI as (band 5 − band 4)/(band 5 + band 4). We quantified the distances to the nearest grassland, settlement and road for each camera-trap site using Euclidean distance, in ArcMap 10.2 (Esri, Redlands, USA).
Ecological variables
Adult clouded leopards would be expected to prey on species weighing < 10 kg (< 45% of their body mass) based on carnivore energetic constraints (Carbone et al., Reference Carbone, Mace, Roberts and Macdonald1999). Known clouded leopard prey species include small and medium-sized ungulates (southern red muntjac Muntiacus muntjak, hog deer Axis porcinus, mouse deer Tragulus sp.; Grassman et al., Reference Grassman, Tewes, Silvy and Kreetiyutanont2005), primates (northern pig-tailed macaque Macaca leonina, leaf monkey Trachypithecus sp., slow loris Nycticebus sp.; Davies, Reference Davies1990; Grassman et al., Reference Grassman, Tewes, Silvy and Kreetiyutanont2005), pangolins (Grassman et al., Reference Grassman, Tewes, Silvy and Kreetiyutanont2005), small carnivores (binturong Arctictis binturong; Lam et al., Reference Lam, Hedges and Clements2014) and rodents (brush-tailed porcupine Atherurus sp., Berdmore's ground squirrel Menetes berdmorei, murids; Grassman et al., Reference Grassman, Tewes, Silvy and Kreetiyutanont2005). Our camera traps detected these or related species of this size range that are likely to be prey. We grouped potential prey species into small/medium (1–10 kg) and large (> 10 kg) size classes. The small/medium prey species comprised porcupines (Himalayan crestless porcupine Hystrix brachyura, Asiatic brush-tailed porcupine Atherurus macrourus), galliformes (red junglefowl Gallus gallus, kalij pheasant Lophura leucomelanos, Indian peafowl Pavo cristatus), hares (Indian hare Lepus nigricollis, hispid hare Caprolagus hispidus), primates (Assamese macaque Macaca assamensis, rhesus macaque Macaca mulatta, capped langur Trachypithecus pileatus) and small carnivores (large Indian civet Viverra zibetha, small Indian civet Viverricula indica, Asian palm civet Paradoxurus hermaphroditus, crab-eating mongoose Herpestes urva, small Indian mongoose Herpestes auropunctatus, Indian grey mongoose Herpestes edwardsii, yellow-throated marten Martes flavigula, Chinese ferret badger Melogale moschata, smooth-coated otter Lutrogale perspicillata, Chinese pangolin Manis pentadactyla). The large prey species comprised chital Axis axis, Himalayan goral Naemorhedus goral, northern red muntjac Muntiacus vaginalis, hog deer and wild boar Sus scrofa. We then examined the presence of clouded leopards in relation to the relative abundance of small/medium and large prey. We did not expect clouded leopards to prey on species > 100 kg (i.e. Asiatic elephant Elephas maximus, one-horned rhinoceros Rhinoceros unicornis, gaur Bos gaurus, wild buffalo Bubalus arnee and sambar Rusa unicolor) or on smaller felids (i.e. leopard cat Prionailurus bengalensis and jungle cat Felis chaus) and therefore we did not include these species as potential prey. We excluded mammals weighing < 1 kg and arboreal mammals from our analysis because of their low detection probability (Tobler et al., Reference Tobler, Carrillo-Percastegui, Leite Pitman, Mares and Powell2008; Ancrenaz et al., Reference Ancrenaz, Hearn, Ross, Sollmann and Wilting2012). We examined the effects of dominant predators (tiger and leopard) on clouded leopard habitat use, to assess predation risk.
Data analysis
We investigated the habitat use of clouded leopards by creating generalized linear models, using camera-trap station-specific clouded leopard presence (1) or absence (0) data, and continuous covariates (number of trap-nights, canopy cover, elevation, NDVI, distances to the nearest grassland, settlement and road, and relative abundances of small/medium prey, small carnivores, large prey and dominant predators). To model clouded leopard habitat use, we standardized all continuous covariates using a z-transformation and reduced multicollinearity by removing highly correlated predictor variables (Spearman rank correlation |r 2| > 0.7) (Nath et al., Reference Nath, Singha, Haque and Lahkar2019). We fitted generalized linear models with a binomial link function and chose the model with the lowest Akaike information criterion (AIC) value and the highest Akaike model weights as the best-supported model (Anderson, Reference Anderson2008). We predicted the potential habitat of clouded leopards using the coefficients from the best-fit model (Hijmans et al., Reference Hijmans, van Etten, Sumner, Cheng, Baston and Bevan2013).
Factors influencing coexistence
Temporal interactions
We described the activity patterns of clouded leopard and sympatric carnivores using Kernel density estimation curves, a non-parametric method of estimating the probability density function of distribution records that assumes an animal is equally likely to be captured at any time as long as it is active (Linkie & Ridout, Reference Linkie and Ridout2011). We estimated the overlap coefficient (Δ) amongst the daily activity patterns of clouded leopard and sympatric carnivores. We defined Δ as the area under the curve that is formed by taking at least two density functions at each time point, ranging from 0 (no overlap) to 1 (complete overlap; Schmid & Schmidt, Reference Schmid and Schmidt2006). We determined the precision of this estimator using 95% confidence intervals (CIs) from 999 bootstrap samples (Linkie & Ridout, Reference Linkie and Ridout2011; Meredith & Ridout, Reference Meredith and Ridout2014). Because the coefficient of overlap is purely descriptive (i.e. it does not provide a threshold value below which two activity patterns might be significantly different), we used the Mardia Watson Wheeler test (Batschelet, Reference Batschelet1981) to compare the distribution of detections across the diel cycle for pairs of clouded leopards and sympatric carnivores (Brook et al., Reference Brook, Johnson and Ritchie2012). We rejected the null hypothesis of a common distribution if the value of W was larger than the critical value indicated by P < 0.05 (Pewsey et al., Reference Pewsey, Neuhäuser and Ruxton2013). We performed this analysis using Oriana 4.01 (Kovach, Reference Kovach2011).
Spatial interactions
We used a statistical co-occurrence test to evaluate the spatial interactions of clouded leopards with other sympatric carnivores. We created capture histories using daily capture events to determine the presence or absence of targeted species at each camera station. Using these capture histories, we investigated spatial interactions (positive, negative or random) between species pairs using probabilistic models (Veech, Reference Veech2013; Griffith et al., Reference Griffith, Veech and Marsh2016). We based these models on two probabilities: (1) the probability (Plt) that two species co-occur at a frequency lower than the observed co-occurrence frequency, and (2) the probability (Pgt) that two species co-occur at a frequency greater than the observed co-occurrence frequency (Veech, Reference Veech2013). Plt < 0.05 and Pgt < 0.05 indicate negative co-occurrence (competitive interaction) and positive co-occurrence (no antagonism), respectively. However, when Plt > 0.05 and Pgt > 0.05, co-occurrence is regarded to be genuinely random (independent distribution; Veech, Reference Veech2013; Griffith et al., Reference Griffith, Veech and Marsh2016). We also determined the standardized effect sizes (range −1 to 1) as the difference between the observed and expected co-occurrence frequencies divided by the number of sampling points (Veech, Reference Veech2013). To investigate spatial overlap (Pianka, Reference Pianka1974), we compared the relative abundances of clouded leopards and sympatric carnivores (O'Brien et al., Reference O'Brien, Kinnaird and Wibisono2003). We considered each camera-trap site as spatially independent and used the relative abundance for each camera site to calculate the spatial overlap index (range 0–1; 0 = no overlap; 1 = complete overlap). We used the Mantel test (Mantel, Reference Mantel1967) to assess correlation between spatial (Pianka index) and temporal overlap patterns. We conducted all statistical analyses in R 4.1.1 (R Core Team, 2021) using the packages secr (Efford, Reference Efford2016), MuMIn (Bartoń, Reference Bartoń2016), raster (Hijmans et al., Reference Hijmans, van Etten, Sumner, Cheng, Baston and Bevan2013), overlap (Linkie & Ridout, Reference Linkie and Ridout2011), cooccur (Griffith et al., Reference Griffith, Veech and Marsh2016) and spaa (Zhang et al., Reference Zhang, Ding and Huang2013).
Results
We recorded 37 species (17 carnivores and 20 prey) from 24,840 independent records over the entire sampling period of 11,388 trap-nights (Supplementary Table 1).
Clouded leopard occurrence and density
The questionnaire surveys revealed the presence of clouded leopards in all three ranges of Manas National Park (Supplementary Figs 1 & 2). Of 21 independent photographs we identified 12 individual clouded leopards (from their right flanks), with a maximum recapture value for a single individual of four (Table 1, Supplementary Fig. 3). The closure test value for a 2-month survey period (z = − 1.26; P = 0.104) showed stronger support for closure than for a 3-month survey period (Supplementary Table 2). We found the relative abundance and density of clouded leopards to be 0.18 ± SE 0.06 per 100 trap-nights and 1.73 (95% CI 0.48–6.27) individuals per 100 km2, respectively. The mean capture probability at the home range centre (g0) and the function of movement (σ) were 0.002 (95% CI 0.001–0.005) and 1.93 (95% CI 0.95–3.90), respectively (Supplementary Table 3).
Habitat use
We recorded 25 potential clouded leopard prey species from 8,619 independent photographs (Supplementary Table 1). Their independent records (n) and relative abundance index values ranged from Himalayan goral (n = 1, relative abundance index = 0.01) and chital (n = 1, relative abundance index = 0.01) to wild boar (n = 2,310, relative abundance index = 20.28) for large prey (> 10 kg), and from Chinese pangolin (n = 2, relative abundance index = 0.02) to red junglefowl (n = 1,162, relative abundance index = 11.24) for small/medium prey (< 10 kg). We also recorded two dominant predators (tiger and leopard), and their independent records (n) and relative abundance index values ranged from leopard (n = 452, relative abundance index = 3.97) to tiger (n = 466, relative abundance index = 4.09).
The intensity of habitat use by clouded leopards was influenced significantly by canopy cover (β = 2.37, P = 0.0005), NDVI (β = 1.71, P = 0.0001) and small/medium prey relative abundance (β = 0.43, P = 0.007; Supplementary Table 4). With respect to the latter, clouded leopard habitat utilization was higher where galliformes (β = 0.50, P = 0.0001) were more prevalent. The model did not suggest any significant relationship between the occurrence of clouded leopards and other habitat, anthropogenic and ecological variables. Two models (i.e. canopy cover + NDVI + kalij pheasant, and canopy cover + NDVI + kalij pheasant + red junglefowl) performed best, with ΔAIC < 2 (Table 2; Figs 2 & 3).

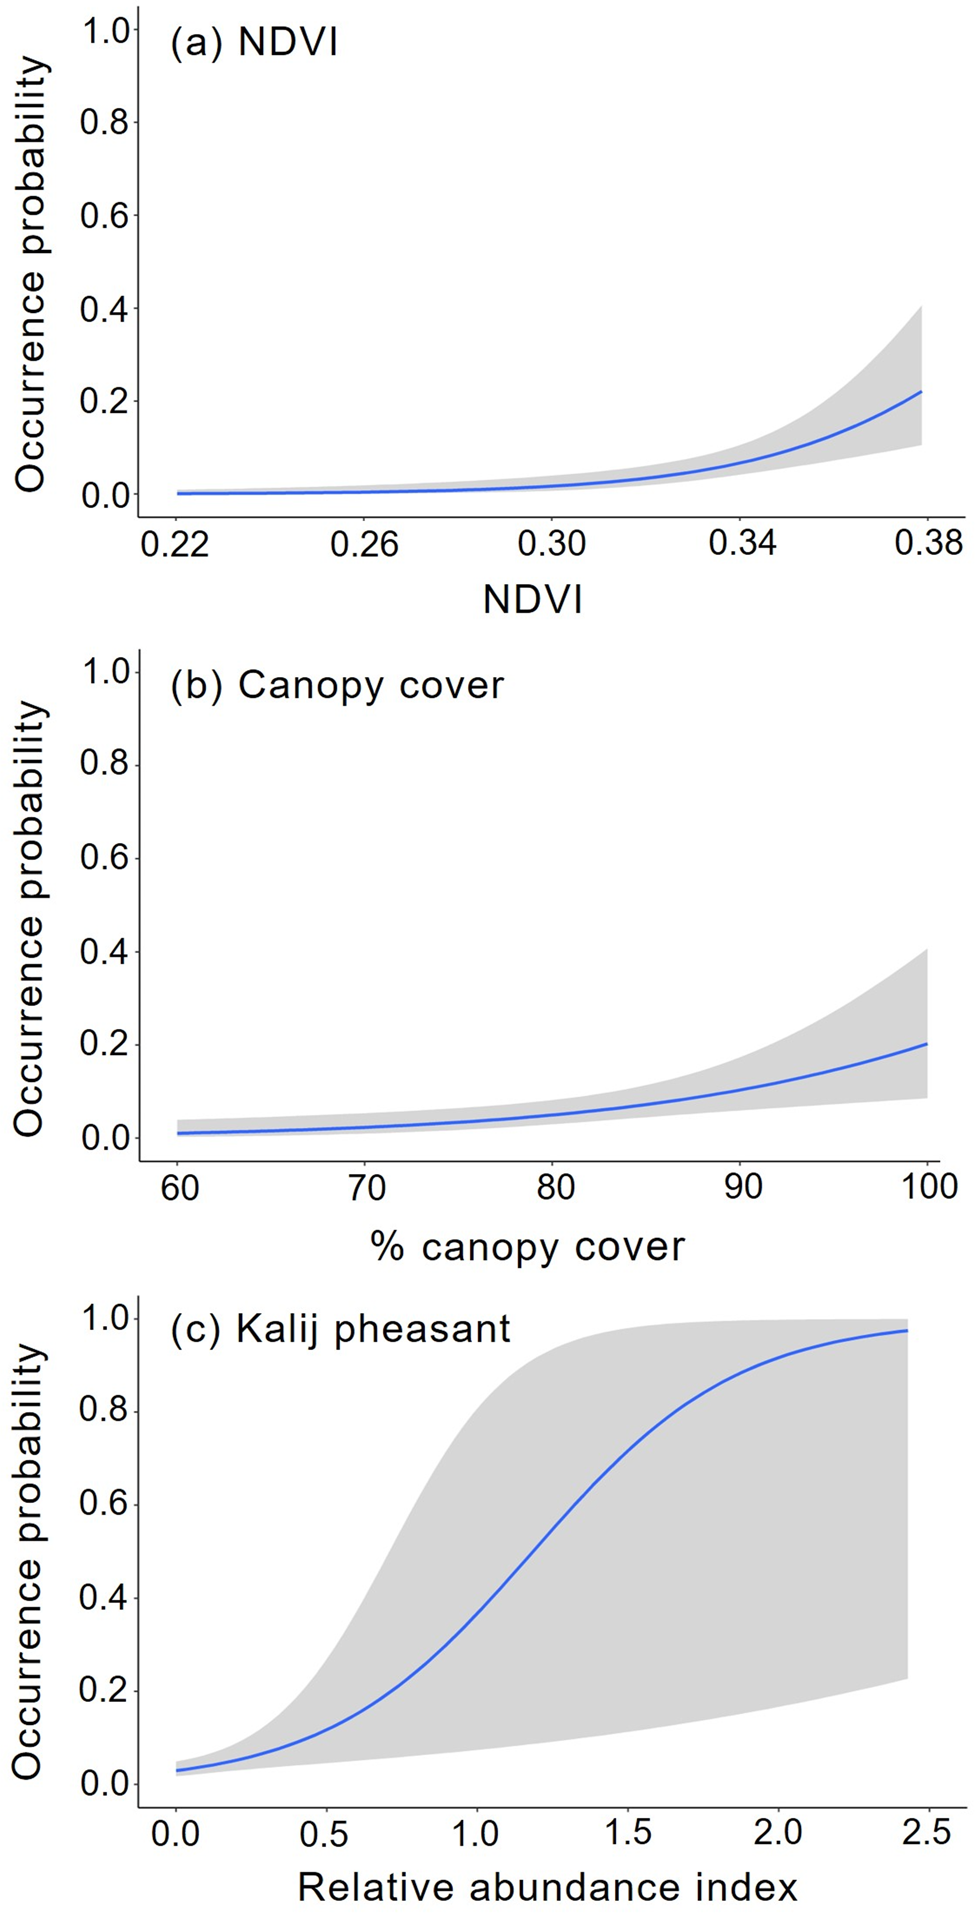
Fig. 3 Response curves of variables used for predicting clouded leopard habitat use in Manas National Park (Table 2): (a) NDVI, (b) canopy cover and (c) kalij pheasant effect plots. Envelopes (shaded area) represent 95% confidence intervals.
Table 2 Examination of clouded leopard habitat use patterns using generalized linear models in Manas National Park (Fig. 3). Generalized linear models with a binomial link function were fitted and the model with the lowest Akaike information criterion (AIC) value, ΔAIC < 2 and the highest Akaike model weights were selected as the best-supported model.

1 cc, canopy cover; kp, kalij pheasant; NDVI, normalized difference vegetation index; rjf, red junglefowl.
Factors influencing coexistence
Clouded leopard activity was nocturnal, with two activity peaks (19.00–23.00 and 2.00–4.00), suggesting a bimodal pattern (Fig. 4). They had the highest daily activity overlap with tigers (Δ1 = 0.82, 95% CI 0.63–0.89); the Mardia Watson Wheeler test also indicated similarities between the diel activity patterns of the two species (W = 1.35, P = 0.51). The clouded leopard had the lowest temporal overlap with dholes. Clouded leopards showed a random spatial distribution and we observed no co-occurrence pattern with other sympatric carnivores (Table 3). The standardized effect size and Pianka index were also low, with the highest values for spatial interactions with tigers (i.e. effect size = 0.003, Pianka index = 0.063, 95% CI 0.019–0.134). The Mantel test indicated no significant correlation between spatial (Pianka index) and temporal overlap (r = 0.002, P = 0.995).
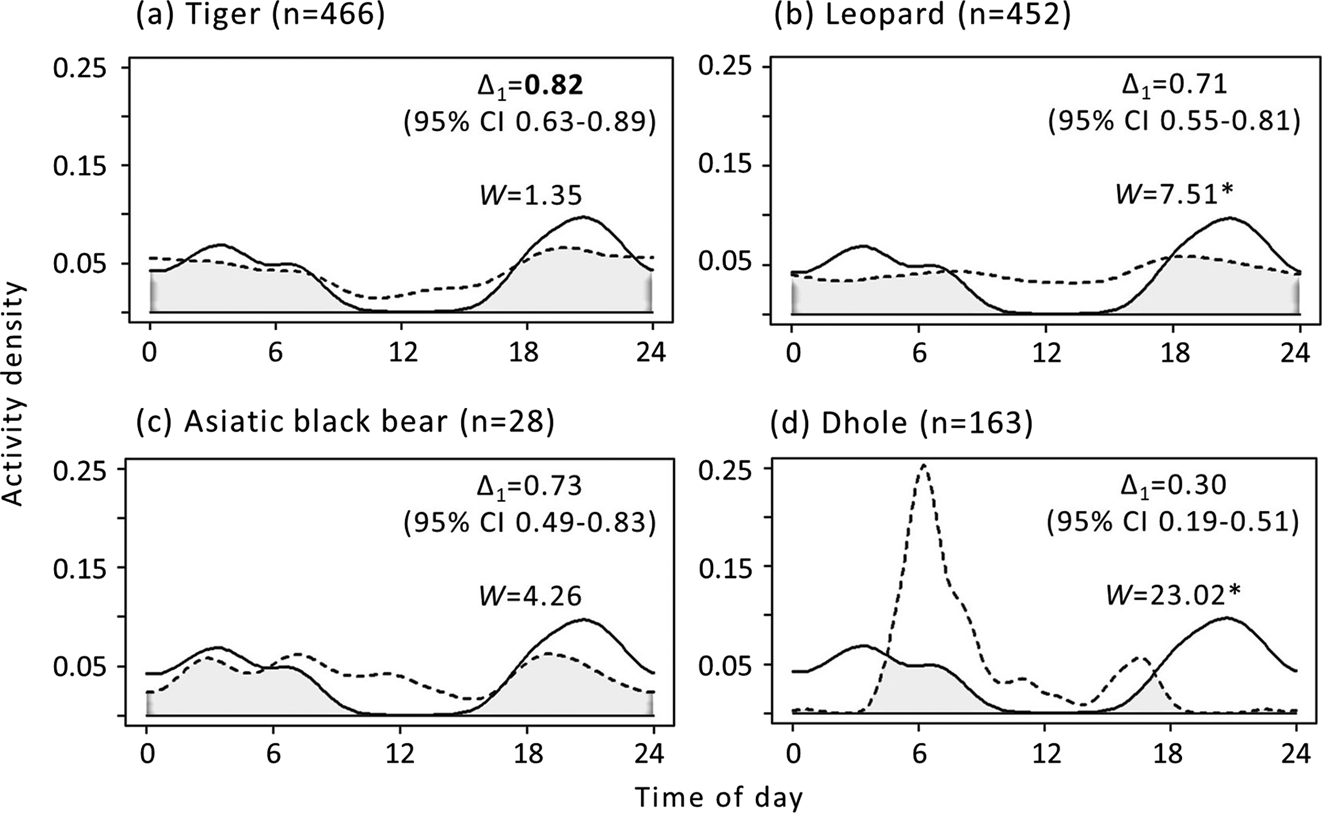
Fig. 4 Temporal overlap of clouded leopards (solid line) with the sympatric tiger Panthera tigris, leopard Panthera pardus, Asiatic black bear Ursus thibetanus and dhole Cuon alpinus (dashed lines) in Manas National Park. Overlap coefficients (Δ1) range from 0 to 1 (0, no overlap; 1, complete overlap). High temporal overlap (Δ1 > 0.75) is highlighted in bold. Δ1 is the area under the curve that is formed by taking at least two density functions at each time point, as indicated by the shaded area in each plot. The Mardia Watson Wheeler test (W) provides a threshold value below which two activity patterns are significantly different. W values with an asterisk indicate P < 0.05 (i.e. the species have different activity patterns).
Table 3 Spatial overlap of clouded leopards with sympatric carnivores in Manas National Park. Plt < 0.05 and Pgt < 0.05 indicate negative and positive co-occurrence, respectively. Standardized effect sizes range from −1 to 1 (−1 = negative co-occurrence; 1 = positive co-occurrence). Niche overlap values (i.e. Pianka index) range from 0 to 1 (0 = no overlap; 1 = complete overlap).

Discussion
Our main findings are: (1) the estimated density and relative abundance of clouded leopards were low, (2) clouded leopards were positively associated with primary forests and showed no relationships with elevation, partially supporting the first hypothesis, (3) clouded leopards showed no relationship with anthropogenic variables, rejecting the second hypothesis, (4) clouded leopards were positively associated with small/medium prey species, supporting the third hypothesis, (5) apex predators showed no influence on the habitat use of clouded leopards, rejecting the fourth hypothesis, and (6) clouded leopards showed high temporal overlap with other sympatric carnivores, and their spatial distribution was random, with no co-occurrence pattern with other sympatric carnivores, partially supporting the fifth hypothesis.
The closure test value from this study was similar to those found previously for clouded leopards and other carnivores (Karanth et al., Reference Karanth, Nichols, Kumar and Hines2006; Mondol et al., Reference Mondol, Karanth, Kumar, Gopalaswamy, Andheria and Ramakrishnan2009; Singh & Macdonald, Reference Singh and Macdonald2017). Our trapping period was shorter than most recent studies on clouded leopards (Mohamad et al., Reference Mohamad, Rayan, Christopher, Hamirul, Mohamed, Lau and Siwan2015; Singh & Macdonald, Reference Singh and Macdonald2017; Ab Razak et al., Reference Ab Razak, Hambali, Amaludin, Rak and Malek2019; Petersen et al., Reference Petersen, Steinmetz, Sribuarod and Ngoprasert2020), increasing the likelihood that the assumption of closure is valid. Our density estimate of 1.73 individuals per 100 km2 is comparable to or lower than estimates from two sites in India (4.73/100 km2, Borah et al., Reference Borah, Sharma, Das, Rabha, Kakati and Basumatary2014; 5.14/100 km2, Singh & Macdonald, Reference Singh and Macdonald2017), one site each in Thailand (edge, 3.13/100 km2; core, 5.06/100 km2; Petersen et al., Reference Petersen, Steinmetz, Sribuarod and Ngoprasert2020), Malaysia (1.15/100 km2, Ab Razak et al., Reference Ab Razak, Hambali, Amaludin, Rak and Malek2019) and Bhutan (0.40/100 km2, Penjor et al., Reference Penjor, Macdonald, Wangchuk, Tandin and Tan2018), two sites in Myanmar (0.60 and 3.05/100 km2, Naing et al., Reference Naing, Ross, Burnham, Htun and MacDonald2019) and two sites in Peninsular Malaysia (1.83 and 3.46/100 km2, Mohamad et al., Reference Mohamad, Rayan, Christopher, Hamirul, Mohamed, Lau and Siwan2015; Table 4, Supplementary Fig. 4). Our density estimate of 1.73 individuals per 100 km2, for 12 individuals, is lower than the 4.73 individuals per 100 km2, for 16 individuals, in a previous study using a similar framework (Borah et al., Reference Borah, Sharma, Das, Rabha, Kakati and Basumatary2014). Relative abundance, total number of individuals and recapture rates were lower than those from previous studies despite our high trap effort (almost two-fold greater than that of other studies) and reduced grid size (1 km2 compared to the 4 km2 of Borah et al., Reference Borah, Sharma, Das, Rabha, Kakati and Basumatary2014, and Mohamad et al., Reference Mohamad, Rayan, Christopher, Hamirul, Mohamed, Lau and Siwan2015). A potential reason for these lower values could be the high tiger and leopard populations as a result of improved protection measures, as well as competition with these predators, in Manas National Park (Supplementary Table 5; Jhala et al., Reference Jhala, Qureshi, Gopal and Sinha2011, Reference Jhala, Qureshi and Gopal2015, Reference Jhala, Qureshi and Nayak2020, Reference Jhala, Qureshi and Yadav2021; Borah et al., Reference Borah, Sharma, Das, Rabha, Kakati and Basumatary2014). We assume that clouded leopards avoid tigers and leopards by climbing trees when they encounter them (Austin, Reference Austin2002). Our low capture rate (21 photographs from 11,388 trap-nights) does not necessarily reflect low numbers of the clouded leopard, rather it could be a result of decreased probability of captures along wildlife trails and roads frequented by high numbers of tigers and leopards.
Table 4 Comparison of density estimates, 95% CI, mean distance between camera traps, number of individuals, number of independent records, analysis method used and presence of tigers and leopards, from this and other studies of the mainland clouded leopard using spatially explicit capture–recapture analysis.

1 Data not available.
Grassman et al. (Reference Grassman, Tewes, Silvy and Kreetiyutanont2005) speculated, based on radiotelemetry data, that clouded leopards hunt small prey (≤ 2.5 kg), and assumed they would move less if they killed larger prey. Our study supports this, suggesting that prey species of < 10 kg body mass, specifically galliformes (i.e. kalij pheasant, 1.1 kg; red junglefowl, 1.3 kg; Indian peafowl, 5.0 kg), have a significant influence on clouded leopard occurrence. However, a study in 13 protected areas in Thailand showed that clouded leopards are associated with the presence of wild boar and southern red muntjac (Ngoprasert et al., Reference Ngoprasert, Lynam, Sukmasuang, Tantipisanuh, Chutipong and Steinmetz2012), but the study did not test for the effect of smaller potential prey species. Primates also comprise a portion of the clouded leopard's diet (Nowell & Jackson, Reference Nowell and Jackson1996; Matsuda et al., Reference Matsuda, Tuuga and Higashi2008; Morino, Reference Morino2010; Sunderland-Groves et al., Reference Sunderland-Groves, Tandang, Patispathika, Marzec, Knox and Nurcahyo2021) but we could not calculate the primate prey abundance index using the camera-trap data, except for that of the rhesus macaque, which is predominantly terrestrial (Khatiwada et al., Reference Khatiwada, Paudel, Chalise and Ogawa2020). Our findings suggest that conserving galliformes and small mammal species such as rhesus macaques, porcupines, and hares is critical to increasing the viability of clouded leopard populations. In addition, high tiger and leopard densities increase competition for larger prey and could further increase the relative importance of smaller prey to clouded leopards. However, dietary studies are required to examine whether these species form a significant part of the clouded leopard diet. Our habitat use analysis revealed that the relative abundances of small prey species are influential for predicting clouded leopard occurrence, supporting this. Our prediction that medium-sized and small predators avoid larger apex predators behaviourally is based on the notion that the local distribution of a top predator is determined by resource availability but the distribution of a mesopredator is influenced primarily by predation risk (Thompson & Gese, Reference Thompson and Gese2007). Although we did not detect a substantial influence of large predators on the habitat use of clouded leopards, our findings suggest that clouded leopards choose habitats based on high prey abundance.
Clouded leopards have been associated positively with NDVI and canopy cover (Austin et al., Reference Austin, Tewes, Grassman and Silvy2010; Brodie & Giordano, Reference Brodie and Giordano2012; Penjor et al., Reference Penjor, Macdonald, Wangchuk, Tandin and Tan2018), and our findings support this. Previous studies have indicated that clouded leopards prefer high elevations (Ngoprasert et al., Reference Ngoprasert, Lynam, Sukmasuang, Tantipisanuh, Chutipong and Steinmetz2012; Haidir et al., Reference Haidir, Dinata, Linkie and Macdonald2013; Mohamad et al., Reference Mohamad, Rayan, Christopher, Hamirul, Mohamed, Lau and Siwan2015) but we found that the elevation of Manas National Park (i.e. 40–200 m above sea level) was not a proximal factor influencing clouded leopard habitat use. We did not include forest or vegetation type as covariates because we deployed camera traps only in moist mixed deciduous and semi-evergreen forests. A study in Sumatra showed that clouded leopards tended to avoid forest edges (Haidir et al., Reference Haidir, Dinata, Linkie and Macdonald2013), but we did not find any relationship between anthropogenic factors and clouded leopard presence, probably because the northern, western and eastern parts of our study area do not border non-forested areas.
Our study shows that clouded leopard activity was predominantly nocturnal (Grassman et al., Reference Grassman, Tewes, Silvy and Kreetiyutanont2005; Mukherjee et al., Reference Mukherjee, Singh, Silva, Ri, Kakati and Borah2019), with bimodal peaks at 19.00–23.00 and 2.00–4.00. However, previous, radiotelemetry studies reported an activity peak in the morning followed by another during the evening crepuscular hours (Grassman et al., Reference Grassman, Tewes, Silvy and Kreetiyutanont2005; Austin et al., Reference Austin, Tewes, Grassman and Silvy2010). Although we expected low temporal overlap of clouded leopards with tigers and leopards because of the predation risk for clouded leopards or dominance of these larger predators, temporal overlap (> 0.70) was relatively high. We observed no statistically significant spatial co-occurrence pattern between clouded leopards and other sympatric carnivores, and the low spatial overlap indices suggest spatial niche differentiation. Low daytime activity has been predicted for mammals in areas containing top predators (van Schaik & Griffiths, Reference van Schaik and Griffiths1996), and we obtained only two photographs of clouded leopards during the daytime. Further telemetry-based studies may be useful to provide insights into patterns of clouded leopard activity in relation to that of other large predators. To facilitate coexistence, clouded leopards utilize vertical strata more frequently when encountering large carnivores (Austin, Reference Austin2002). Our results support the notion that spatio-temporal segregation facilitates the coexistence of clouded leopards with other sympatric carnivores in a tropical region, suggesting a partial avoidance that could decrease competition as well as reduce the risk of intraguild predation (Carothers et al., Reference Carothers, Jaksić and Jaksic1984).
Conservation, both political lobbying and on-the-ground management, can only be effective with full knowledge of which species are present in an area and their distributions and abundances. Manas National Park was affected by unrest that occurred in the region from the mid 1980s until peace was restored in 2003 (Goswami & Ganesh, Reference Goswami and Ganesh2014), leaving it vulnerable to logging, hunting and poaching of fauna, and resulting in habitat degradation and significant loss of wildlife (George, Reference George1994; Sarma et al., Reference Sarma, Lahkar, Ghosh, Rabha, Das and Nath2008). Nevertheless, our study provides evidence that clouded leopards in Manas are using habitats rich in primary forests. Baseline abundance and habitat use estimates are crucial for monitoring the success of conservation efforts, and information on intraguild relationships amongst sympatric carnivores is essential for planning conservation interventions.
Acknowledgements
We thank the Director and Dean, Wildlife Institute of India; Doyil Vengayil, Syed Asrafuzzaman and Harish Kumar, Department of Science and Technology, Government of India, for financial assistance to the project on clouded leopards under grant EMR/2015/000085; Field Directors of Manas Tiger Reserve, the Forest Department, Government of Assam, and Bodoland Territorial Council for permitting us to conduct the survey; Paniram, Saurav, Chiging, Meban, Tejas, Nikunj and Krishna for their assistance in data collection; Ashish Jangid for help with R coding; and the reviewers and editor for their valuable comments.
Author contributions
Study design: SL, UB; conception of experiments: SL, UB; data collection: UB; analysis: UB, SL; writing: UB, SL; revision: SL, UB; project supervision and acquisition of funding: SL.
Conflicts of interest
None.
Ethical standards
This research involved non-invasive sampling and otherwise abided by the Oryx guidelines on ethical standards.
Data availability
All data pertaining to this study are owned by the Wildlife Institute of India and author SL. The data will be made accessible upon reasonable request to the corresponding author.


 Open access