


Introduction
Sexual selection is a key component of evolutionary biology and includes both intrasexual selection (i.e., competition between members of the same sex) and intersexual selection (i.e., preferential choice of individuals of one sex by the opposite sex) (Fitze et al. Reference Fitze, Cote, Martínez-Rica and Clobert2008). Intraspecific aggression, or agonistic behavior, often in the form of male–male intrasexual aggression, has been the subject of extensive study in the context of competition for mates and territory, population density, and intra/intergroup social dynamics (Ovaska Reference Ovaska1987; Crockett and Pope Reference Crockett and Pope1988; Santos Reference Santos1996; Keevil et al. Reference Keevil, Hewitt, Brooks and Litzgus2017). Although many behavioral interactions require direct observational study, in instances in which agonistic behavior causes bodily injury, aggression levels can be inferred by examining the relative frequency of wounds or scars. This approach has been used within a broad phylogenetic context that includes teleost fish (Santos Reference Santos1996), amphibians (Ovaska Reference Ovaska1987; Staub Reference Staub1993; Camp Reference Camp1996; Munshaw et al. Reference Munshaw, Atlas, Palen, Courcelles and Monteith2014), squamates (Schoener and Schoener Reference Schoener and Schoener1980; Shine Reference Shine1990; Jennings and Thompson Reference Jennings and Thompson1999; Baird et al. Reference Baird, Baird and Shine2012; Morrison et al. Reference Morrison, Biciloa, Harlow and Keogh2013; Baxter-Gilbert and Whiting Reference Baxter-Gilbert and Whiting2018), chelonians (Kiviat Reference Kiviat, Healy, Carey, Galli, Healy, Horitiz, McDowell, Samual and Sautiere1980; Keevil et al. Reference Keevil, Hewitt, Brooks and Litzgus2017), crocodylians (Staton and Dixon Reference Staton and Dixon1975; Gorzula Reference Gorzula1978; Webb et al. Reference Webb, Manolis and Buckworth1983), rodents (Rose Reference Rose1979; Forman and Brain Reference Forman and Brain2006), cetaceans (Gerson and Hickie Reference Gerson and Hickie1985; Scott et al. Reference Scott, Mann, Watson-Capps, Sargeant and Connor2005; Orbach et al. Reference Orbach, Packard, Piwetz and Würsig2015), cervids (Geist Reference Geist1986), carnivorans (Ramsay and Stirling Reference Ramsay and Stirling1986; Minta Reference Minta1993; Macdonald et al. Reference Macdonald, Harmsen, Johnson and Newman2004; Derocher et al. Reference Derocher, Andersen, Wiig and Aars2010), and primates (Owens Reference Owens1975; Crockett and Pope Reference Crockett and Pope1988; Drews Reference Drews1996; Sauther et al. Reference Sauther, Sussman and Cuozzo2002; Cristóbal-Azkarate et al. Reference Cristóbal-Azkarate, Dias and Veà2004; Arlet et al. Reference Arlet, Carey and Molleman2009).
The vast majority of intraspecific injuries are limited to soft tissues and generally do not affect the skeleton (although digit and tail loss can occur). As a result, these indicators of intrasexual aggression are rarely preserved in the fossil record, making it difficult to study the pattern, origin, and evolution of these behaviors in extant clades. This difficulty is particularly apparent when related clades show divergent patterns of intrasexual versus intersexual selection. Within Archosauria, extant crocodylians practice extensive intrasexual aggression, resulting in dramatic facial injuries (Cott Reference Cott1961; Gorzula Reference Gorzula1978), whereas birds rely primarily on visual/vocal intersexual display (Butcher and Rohwer Reference Butcher, Rohwer and Power1989), resulting in fewer physical injuries. However, this dichotomy is simplified, as these behaviors are not mutually exclusive; crocodylians do engage in vocal/visual displays before, or instead of, combat (Garrick and Lang Reference Garrick and Lang1977; Garrick et al. Reference Garrick, Lang and Herzog1978; Vliet Reference Vliet1989; Thorbjarnarson and Hernández Reference Thorbjarnarson and Hernández1993; Wang et al. Reference Wang, Wang, Wu, Wang and Wang2007; Dinets Reference Dinets2013), and many bird species do engage in intraspecific combat (Payne Reference Payne1984; Hansen Reference Hansen1986; Simmons and Mendelsohn Reference Simmons and Mendelsohn1993; Marcuk et al. Reference Marcuk, Purchase, de Boer, Bürkle and Scholtyssek2020) that can cause injury/death (Müller et al. Reference Müller, Altenkamp and Brunnberg2007; Hof and Hazlett Reference Hof and Hazlett2012; Hunt et al. Reference Hunt, Dunlop and Lockhart2021). Further, displays in both groups can be directed at, or by, both sexes, although the meanings may differ between males and females (i.e., the same signal may represent a threat to members of the same sex and an advertisement to members of the opposite sex), making teasing out intra- versus intersexual selection more difficult (Payne Reference Payne1984). Despite the complexity of sexually selective behaviors in extant archosaurs, the timing and evolution of the divergence between dominance of intra- versus intersexual selection is unknown and may have arisen in a non-avian dinosaur lineage leading to crown birds.
Tyrannosauridae is a clade of large-bodied, carnivorous dinosaurs that dominated the predator niche of terrestrial ecosystems during the last 20 Myr of the Cretaceous in North America and Asia (Brusatte et al. Reference Brusatte, Norell, Carr, Erickson, Hutchinson, Balanoff, Bever, Choiniere, Makovicky and Xu2010). Because they are known from a great number of specimens across ontogenetic stages, representing one of the best fossil records of any theropod group, and they occupy a phylogenetic position midway between basal dinosaurs and birds, tyrannosaurids are the ideal clade to study the presence, frequency, and nature of agonistic behavior in the theropod ancestry of birds. Further, the widespread occurrence of healed or partially healed cranial lesions (hereafter “lesion”) interpreted as intraspecific bite marks (Tanke and Currie Reference Tanke and Currie1998; Peterson et al. Reference Peterson, Henderson, Scherer and Vittore2009; Bell and Currie Reference Bell and Currie2010; Dalman and Lucas Reference Dalman and Lucas2021) in tyrannosaurs offers a unique opportunity to study direct evidence of intraspecific aggression in this clade. Whereas previous research largely concentrated on articulated/associated skulls (Tanke and Currie Reference Tanke and Currie1998) or single individuals/elements (Peterson et al. Reference Peterson, Henderson, Scherer and Vittore2009; Bell and Currie Reference Bell and Currie2010; Hone and Tanke Reference Hone and Tanke2015; Dalman and Lucas Reference Dalman and Lucas2021), we greatly expand the dataset by adding previously undescribed articulated/associated skulls and a vast number of isolated and bone bed elements from individuals of different size/age categories, drastically increasing sample size and the ontogenetic and taxonomic range under investigation.
Materials
A systematic survey of a large sample of cranial material from tyrannosaurid species, including articulated and associated skulls, disarticulated bone bed material, and disarticulated and isolated elements, was conducted, largely relying on the collections of the Canadian Museum of Nature (CMN), Royal Ontario Museum (ROM), Royal Tyrrell Museum of Palaeontology (TMP), and University of Alberta Laboratory of Vertebrate Paleontology (UALVP). The systematically sampled taxa include Albertosaurus sarcophagus (Horseshoe Canyon Formation), Daspletosaurus torosus and Daspletosaurus sp. (Oldman and Dinosaur Park Formations), and Gorgosaurus libratus (Dinosaur Park Formation). Other tyrannosaurid taxa, including Tarbosaurus bataar (Nemegt Formation), Thanatotheristes degrootorum (Foremost Formation), and Tyrannosaurus rex (Frenchman, Hell Creek, Lance, and Scollard Formations), were also examined, but opportunistically and not systematically. Data for these latter taxa are excluded from the systematic analysis, although the raw data are reported. Following Currie (Reference Currie2003b) and Voris and colleagues (Reference Voris, Zelenitsky, Therrien and Currie2019, Reference Voris, Therrien, Zelenitsky and Brown2020), taxonomic identity could be confidently determined for many articulated/associated skulls and bone bed material, but not for all isolated specimens. Isolated specimens from the Horseshoe Canyon Formation were attributed to A. sarcophagus; however, isolated specimens from formations containing two tyrannosaurid taxa (Dinosaur Park Formation: Daspletosaurus sp., G. libratus) could occasionally not be identified beyond Tyrannosauridae indet.
A total of 36 articulated/associated skulls (partial to complete), 141 isolated elements, and 25 specimens from the Albertosaurus Bonebed were studied (Supplementary Datasets 1, 2), for a total of 528 elements (Table 1). Elements systematically examined for tooth-strike lesions consist of the maxilla (n = 72), nasal (n = 72), frontal (n = 67), lacrimal (n = 48), jugal (n = 45), premaxilla (n = 38), postorbital (n = 34), dentary (n = 83), surangular (n = 46), and angular (n = 23) (Table 1). The total sample for each well-sampled taxon is A. sarcophagus: 6 skulls, 42 isolated elements; D. torosus and D. sp.: 10 skulls, 8 isolated elements; G. libratus: 18 skulls, 30 isolated elements; T. degrootorum: 1 skull, 1 isolated element; Tyrannosauridae indet.: 89 isolated elements (Table 1).
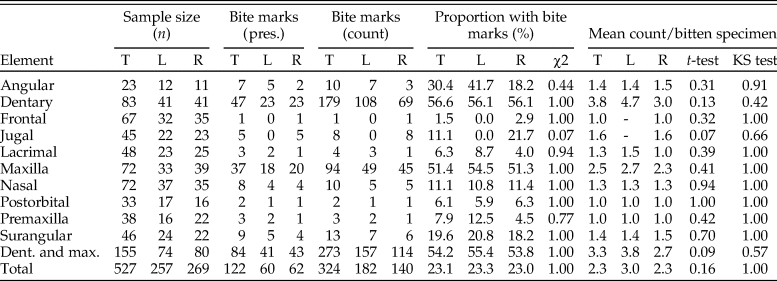
Table 1. Results of lesion survey across tyrannosaur cranial and mandibular elements. Elements are analyzed separately, both as total (T) numbers and treating left (L) and right (R) separately. The first column set is sample size (n), the second column is summed presence of lesions, the third column is summed lesion count, the fourth column is the proportion of elements with lesions, and the fifth column is the mean number of lesions per specimen with lesions. Values for combined maxilla and dentary and all elements are summed at the bottom. χ2 results report on significance of lesion frequency between left and right sides, while t-test and Kolmogorov–Smirnov (KS) test report lesion intensity between left and right sides.
Methods
Survey
Bones were examined to determine the presence or absence of healed or partially healed lesions consistent with tyrannosaurid tooth marks. Previous studies on these features have used the terms “tooth-strike lesion,” “osseous lesion,” “lesion mark,” “lesion,” “injury,” and “bite mark” (Tanke and Currie Reference Tanke and Currie1998; Peterson et al. Reference Peterson, Henderson, Scherer and Vittore2009; Bell Reference Bell2010; Hone and Tanke Reference Hone and Tanke2015; Dalman and Lucas Reference Dalman and Lucas2021). Here the terms “tooth-strike lesion” or “lesion” are used to avoid confusion with unhealed bite or tooth marks more consistent with predation or scavenging. Low-angle raking light, low magnification, and ammonium chloride dusting were used to highlight surface features on bones. Largely following the methodology of Tanke and Currie (Reference Tanke and Currie1998), localized circular/ovoid features (i.e., pits, bumps) and linear features (i.e., furrow, raised ridge) with obvious bone reactivity/healing, referred to as “Type 1” and “Type 2” features, respectively (sensu Tanke and Currie Reference Tanke and Currie1998), were documented. The presence of any embedded teeth, “Type 4” features sensu Tanke and Currie (Reference Tanke and Currie1998), was also recorded. Although specifically attempting to document the pattern of intraspecific tooth-strike lesions, these broad criteria may include some features that do not represent tooth-strike lesions but allow for the inclusion of all healed or partially healed tooth-mark injuries, not just those diagnostic for tooth-strike lesions. Lesions were also categorized into two broad classes based on their topography and texture, those that were incised with ragged edges and/or halos of porous/rough, puckered, reactive bone (Figs. 1A–C, and 2A,C,E), termed “incised and porous,” and those that were either raised or flush with the surrounding bone surfaces, and showed evidence of extensive but smooth remodeling (Figs. 1C–F, and 2B,D–H), termed “smooth/raised.”
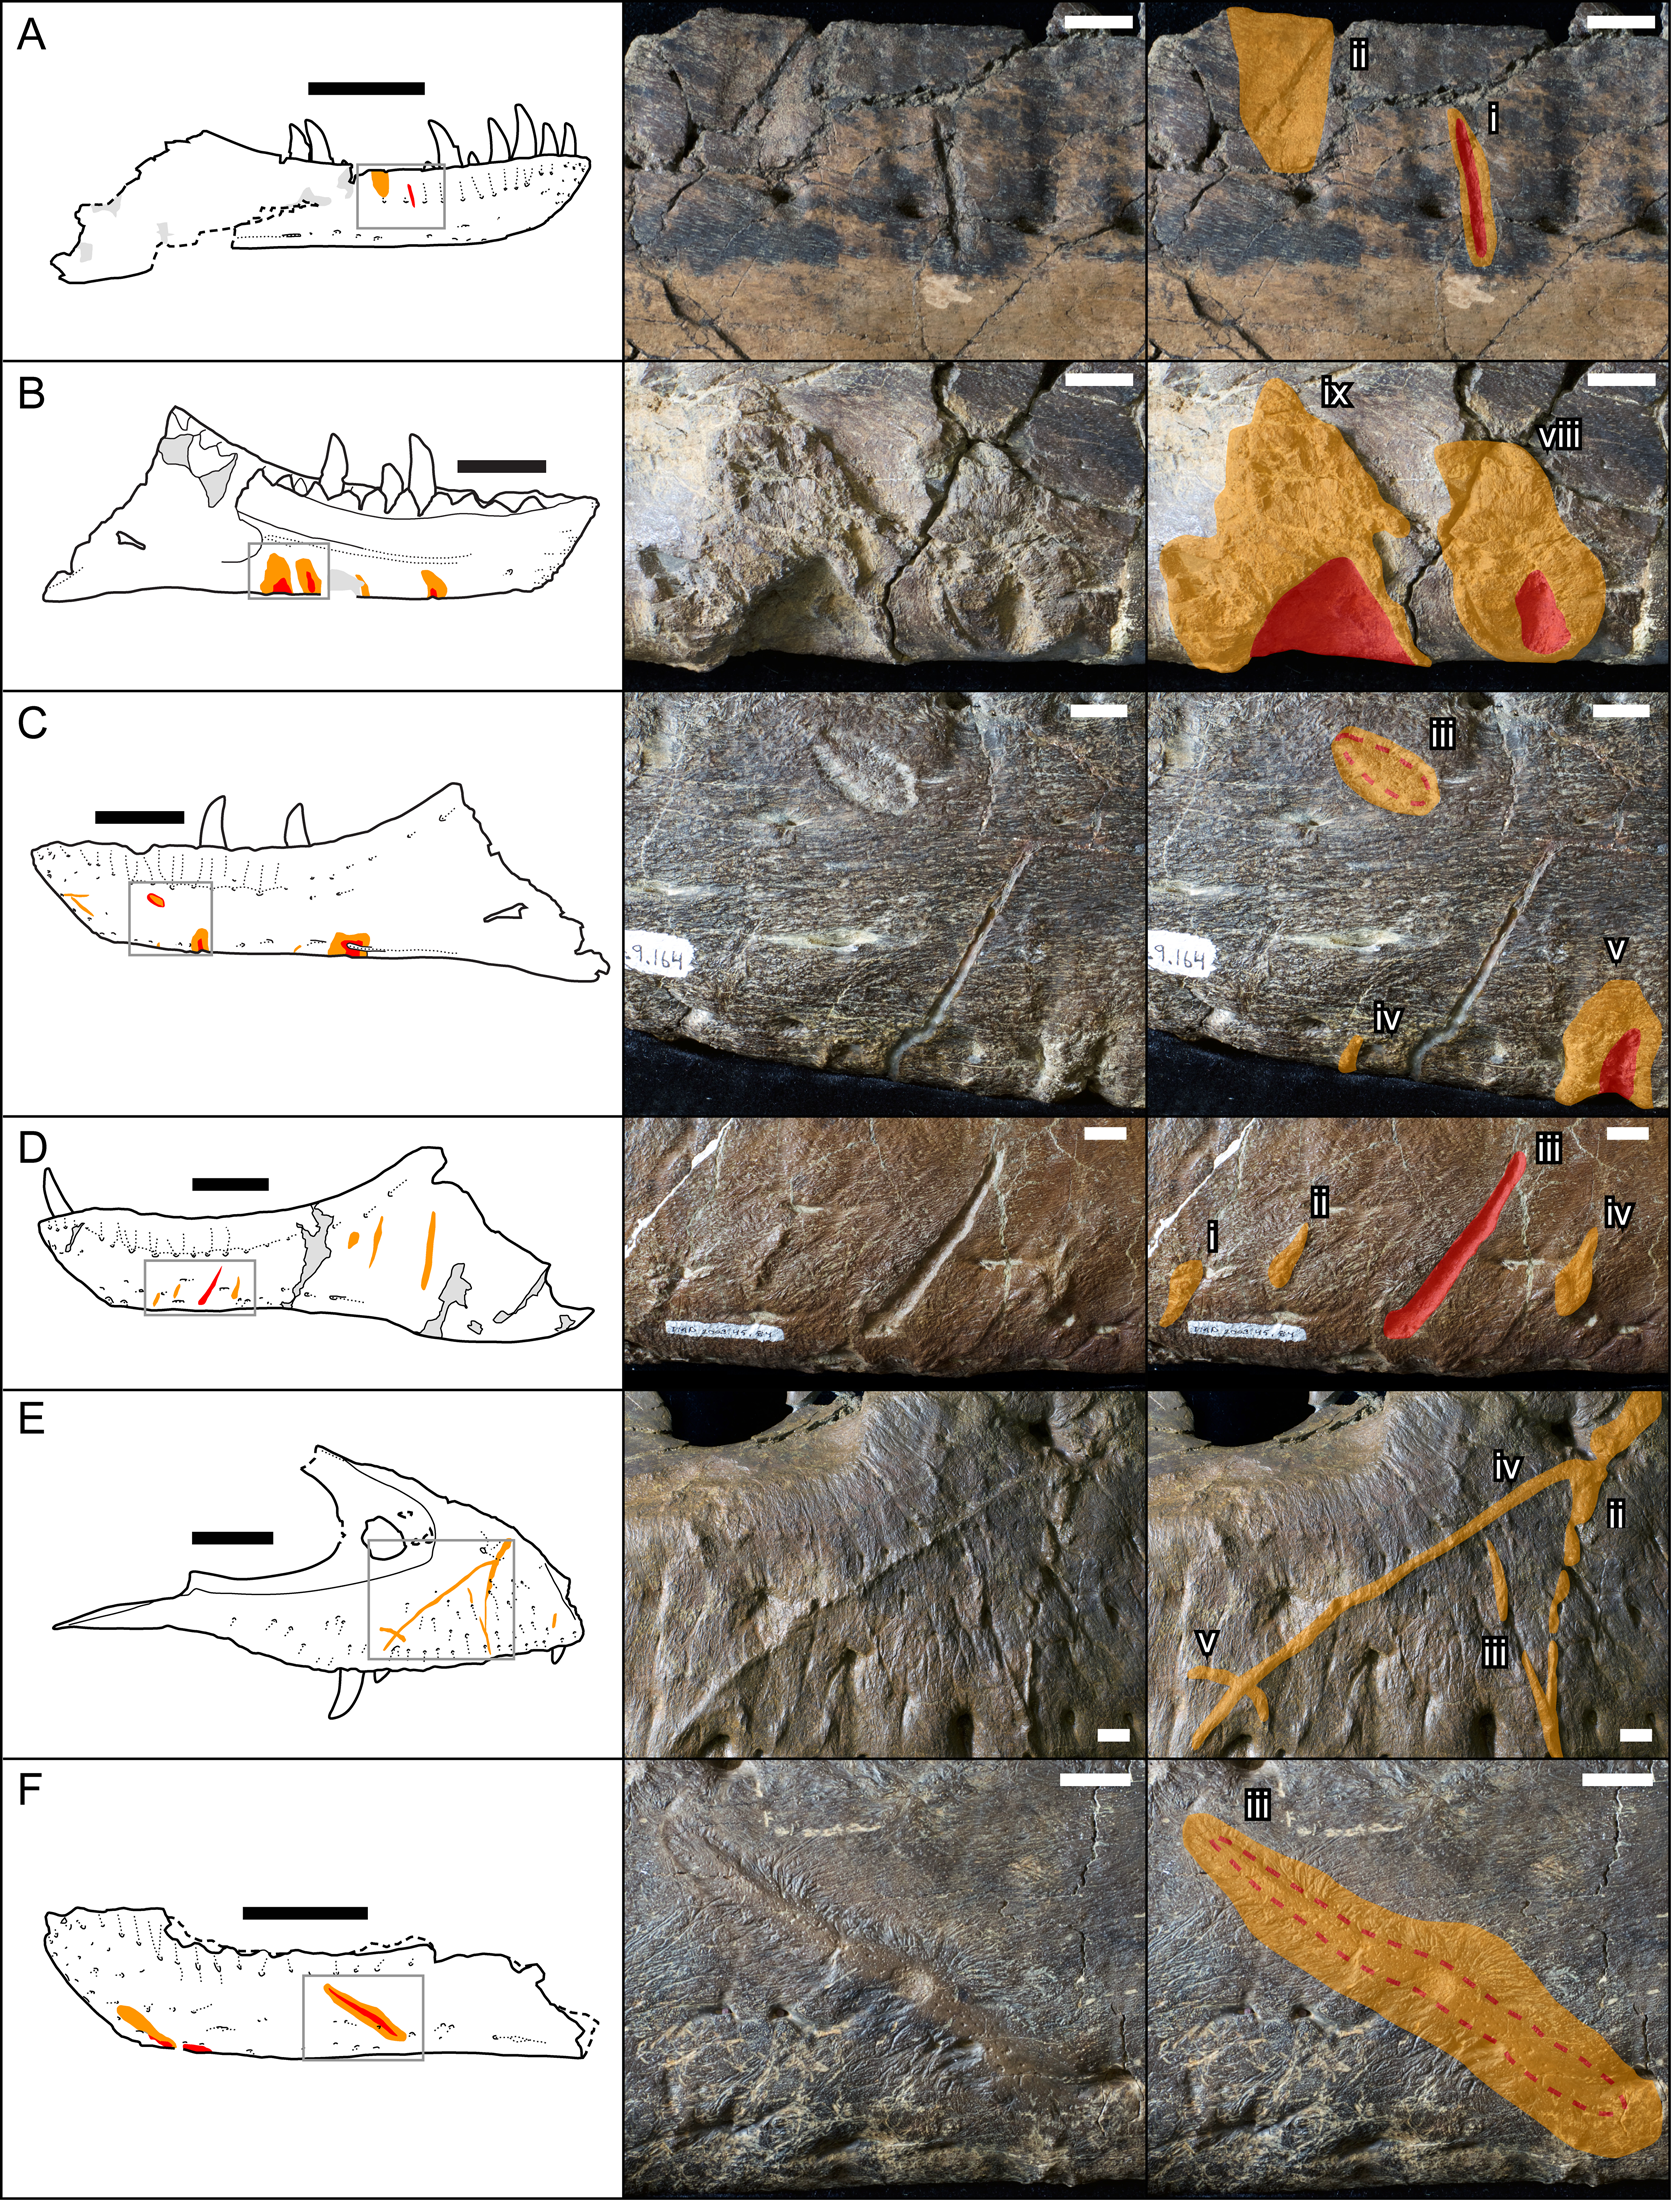
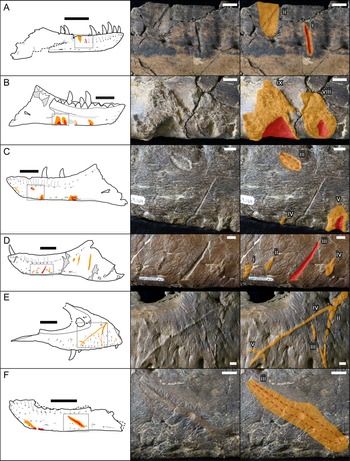
Figure 1. Line drawings (left) and photographs (central original and right augmented) of representative examples of healed and partially healed tooth-strike lesions on tyrannosaur maxillae and dentaries. Red indicates areas of the lesion that are incised into the bone surface, while orange indicates areas of reactive bone tissues that are either flush or raised. A, TMP1991.163.0001 right dentary in lateral view; B, TMP1967.009.0164 left dentary in medial view, C, TMP1967.009.0164 left dentary in lateral view; D, TMP2003.045.0084 left dentary in lateral view; E, TMP2017.012.0002 right maxilla in lateral view; F, TMP2002.012.0101, left dentary in lateral view. Scale bars in line drawings are 10 cm. Scale bars in photographs are 1 cm. Roman numerals indicate lesion number (see Supplementary Datasets S1, S2, from anterior to posterior on each element.)
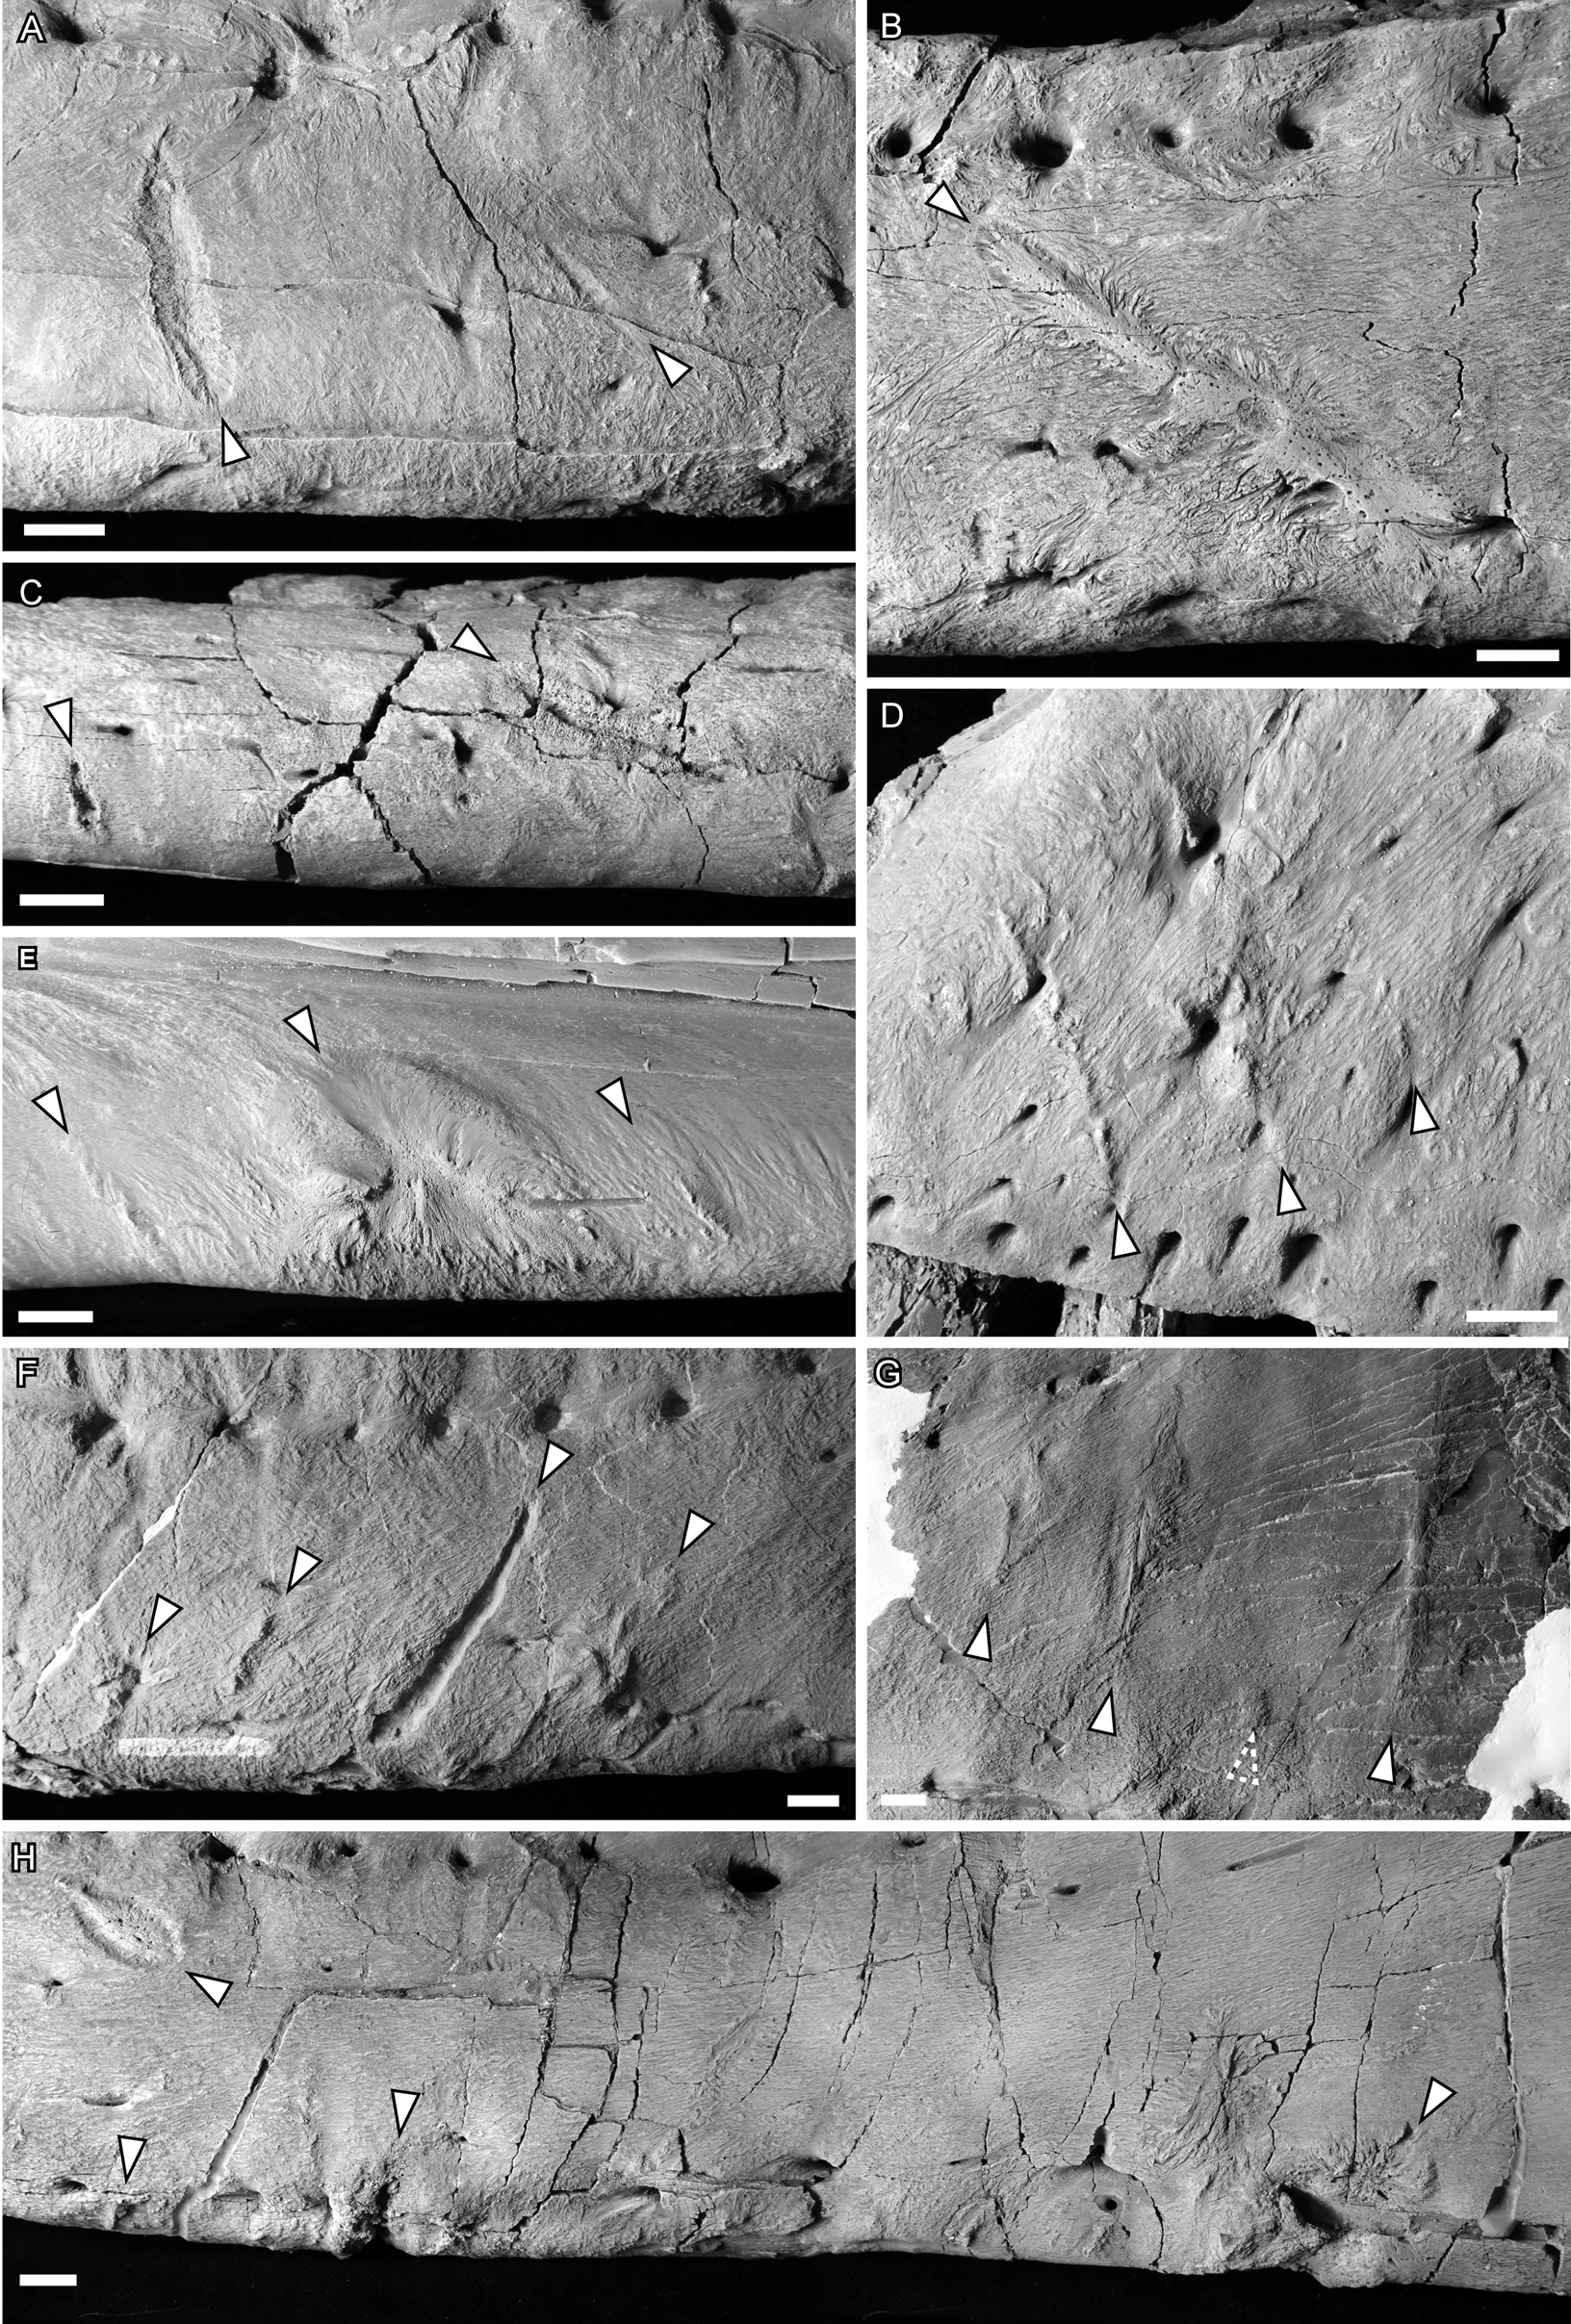
Figure 2. Photographs of ammonium chloride–dusted tyrannosaur cranial bones with healed and partially healed tooth-strike lesions indicated (arrows). A, TMP 1997.025.0053 left dentary in lateral view; B, TMP 2002.012.0101 right dentary in lateral view; C, TMP 2012.012.0029 right dentary in ventral view; D, TMP 1983.036.0100 left maxilla in lateral view; E, TMP 1994.025.0006 left dentary in medial view; F and G, TMP 2003.045.0084 left dentary in lateral view, anterior (F) and posterior (G); H, TMP 1967.009.0164 left dentary in lateral view. Scale bars, 1 cm.
Any marks that did not show evidence of reactivity/healing in the surrounding bone were disregarded. Although these may, in some cases, be intraspecific tooth marks, they could be related to predation, scavenging, or taphonomy. Similarly, the bone surface texture on the skulls of some tyrannosaurs (e.g., subcutaneous ridges of Thanatotheristes; see Voris et al. Reference Voris, Therrien, Zelenitsky and Brown2020) can be eliminated due to the lack of remodeled bone texture and their anastomosing nature. The shapes of marks that result from mechanical preparation (i.e., air scribe) have been documented (Wiest et al. Reference Wiest, Ferraro, Binetti, Forman, Esker, Mzalendo, Brugal and Zechmann2018), and these were also disregarded. Although lesion identification can be occasionally subjective, the location and morphology of all bite marks identified are documented in Supplementary Datasets S1 and S2 for the sake of data reproducibility.
Photography
When lesions were present, the element was photographed with a digital camera (Canon EOS 6D, 50 mm [1:1.4] and 24-105 mm [1:4] lenses), and the position and orientation of the lesion(s) were documented by drawing the element in lateral view (occasionally medial, ventral, and/or dorsal) and mapping the lesion using the software Adobe Illustrator (v. 15.1.0). Ammonium chloride powder coating was used in some cases, using the “dry method” sensu Parsley and colleagues (Reference Parsley, Lawson and Pojeta2018), to enhance the surface texture while homogenizing bone color for photography.
Measurements
All lesions were measured for a maximum length (digital calipers below 150 cm, fiberglass tape above 150 mm), and the orientation of the longest axis relative to the tooth row was measured in ImageJ (v. 1.44). Following D'Amore and Blumensehine (Reference D'Amore and Blumensehine2009), lesion length and orientation were taken as the maximum straight-line length between the two extremes. For orientation, anterior was set as 0°, dorsal as 90°, posterior as 180°, and ventral as 270°. Any polarity in depth and/or width of the lesion along its length was also noted. Based on interpretations from “puncture and pull” tyrannosaurid feeding traces (Erickson and Olson Reference Erickson and Olson1996; Fowler and Sullivan Reference Fowler and Sullivan2006), the wider/deeper extreme of polar tooth marks is considered the initial contact between the bone and tooth, while the tapering extreme marks the point at which the tooth loses contact with the bone surface, providing an inferred directionally of the original contact. Circular statistics were analyzed using the R statistical language (R Core Team 2009), using the circular package, and the functions rose.diag, mean.circ, kuiper.test, and polar.plot.
Serial Lesions
When multiple lesions were present on a single element, they were numbered from anterior to posterior using roman numerals. In some instances, sets of multiple lesions are thought to result from the occlusion of multiple serially positioned teeth from a single bite. For this to be considered, the lesions must be: (1) parallel (or nearly parallel) in long-axis orientation and (2) equidistant (or nearly-equidistant) in spacing (if more than two) (see Figs. 1D, and 2D–G). The equidistant spacing criterion was flexible to allow for doubling/tripling of spacing to account for a missing tooth in the series. In the cases of serial lesions, the distance or interval between serial bite marks (lesions midpoints, perpendicular to their long axis) was recorded. Hone and Chure (Reference Hone and Chure2018) note that drawing a direct correlation between the spacing of serial tooth marks and tooth spacing in potential trace makers may be problematic due to factors such as curved bone surfaces, bite angle, and missing or misaligned teeth. However, when a relatively consistent pattern of spacing between aligned tooth marks is observed and the bone surface is relatively flat, the most parsimonious first assumption is that mark spacing is comparable to the tooth spacing in the trace maker.
Size Metric
As many of the specimens used in the analysis were isolated or from bone beds, many do not preserve total length or basal skull length, and as a result, tooth row length (TRL) was used as a measure of size. While femur length is often used for scaling, Currie (Reference Currie2003a) illustrates that, in Tyrannosauridae, maxillary TRL and femur length are strongly correlated (R 2 = 0.95) and scale isometrically (slope = 1.05). Similarly, dentary TRL is strongly correlated with maxillary TRL (R 2 = 0.98) (Currie Reference Currie2003a). As a result, TRL is a good metric for size when the dataset includes isolated maxillae and dentaries. Tooth row length could be measured, or reasonably estimated, for 64% (122/193) of tooth-bearing elements (47/83 dentaries, 47/72 maxillae, and 28/38 premaxillae), with the remaining specimens estimated from alveolar regression (see following section).
Regression of Tooth Row Length and Alveolar Length
For elements lacking complete tooth rows, this metric was estimated from a regression of TRL onto mean anteroposterior alveolar length using complete elements (Supplementary Fig. S1, Supplementary Table S1). To assemble this regression, all complete tooth-bearing elements (47 dentaries, 47 maxillae, and 28 premaxillae) were measured for both straight-line TRL and individual measurements of the serial alveoli (Supplementary Dataset 6). To remove the effect of elements preserving more/fewer of the smaller anteriorly and posteriorly positioned alveoli, the anteriormost two and posteriormost five alveoli were disregarded for the maxilla and dentary. Mean alveolar length was calculated for each element. Premaxilla, maxilla, and dentary mean alveolar lengths were regressed independently against their respective TRLs. All values were log transformed (base 10) before regression. Ordinary least-squares (OLS) regressions were performed using the lm function (stats) in the R statistical language (R Core Team 2009). All three elements show strong correlations between TRL and mean alveolar length (coefficient of determinations [R 2] for dentary = 0.92, for maxilla = 0.92, and for premaxilla = 0.89), although the slopes and intercepts of these relations differ (Supplementary Table S1, Supplementary Fig. S1A). Based on these regressions, the TRLs of incomplete specimens can be estimated from mean alveolar lengths for each bone (Supplementary Dataset 6), using the following equations:
 $$\eqalignno{&\log _{10}{\rm Dentary\;TRL} \cr&= {\rm \;}\log _{10}{\rm mean\;alveolar\;}\cr&{\rm length} \times {\rm \;}0.9886 + 1.1654&(1)$$
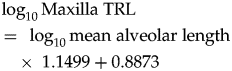 $$\eqalignno{&\log _{10}{\rm Maxilla\;TRL} \cr&= {\rm \;}\log _{10}{\rm mean\;alveolar\;length} \cr&\quad\times {\rm \;}1.1499 + 0.8873&( 2 )$$
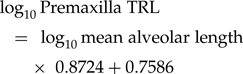 $$\log _{10}{\rm Premaxilla\;TRL} = {\rm \;}\log _{10}{\rm mean\;alveolar\;length} \times {\rm \;}0.8724 + 0.7586$$
Back checking estimated TRL with known TRL quantified the relative error magnitude at 0.16% for all elements: 0.24% for the dentary, 0.02% for the maxilla, and 0.15% for the premaxilla. The relative absolute value error magnitude is 5.67% for all elements (Supplementary Fig. S1B): 5.96% for the dentary (Supplementary Fig. S1C), 5.25% for the maxilla (Supplementary Fig. S1D), and 5.92% for the premaxilla (Supplementary Fig. S1E).
Dentary Equivalent Tooth Row Length
Within individual specimens, TRL of the maxilla, dentary, and especially the premaxilla are not equivalent. For this reason, maxillary and premaxillary TRLs were regressed against dentary TRL, and the resulting regression was used to convert maxillary and premaxillary TRLs into “dentary equivalent tooth row lengths” (DETRLs) to allow direct comparisons (Supplementary Fig. S2, Supplementary Tables S2, S3). Sixteen articulated/associated specimens preserve both maxillary and dentary TRLs, whereas 12 specimens preserve both premaxillary and dentary TRLs (Supplementary Table S2). The maxillary TRL is consistently greater than that of the associated dentary, although the two are highly correlated (R 2 = 0.94) (Supplementary Fig. S2, Supplementary Table S3). A similar but weaker correlation is seen between the premaxillary and dentary TRLs (R 2 = 0.84) (Supplementary Table S3). Measured or calculated maxillary TRLs were converted into dentary equivalent TRLs using the formula
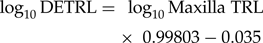 $$\log _{10}{\rm DETRL} = {\rm \;}\log _{10}{\rm Maxilla\;TRL} \times {\rm \;}0.99803-0.035$$
Measured or calculated premaxillary TRLs were converted into dentary equivalent TRLs using the formula
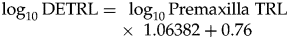 $$\log _{10}{\rm DETRL} = {\rm \;}\log _{10}{\rm Premaxilla\;TRL} \times {\rm \;}1.06382 + 0.76$$
To analyze any correlation between marks (e.g., count, proportion, or type) and the overall sizes of the elements, both the raw TRL and DETRL were binned independently. To test the sensitivity of the bin choice for the results, five different bin sizes were tested: 50, 25, 20, 15, and 10 mm, for a total of 10 binning treatments.
Extant Analogs
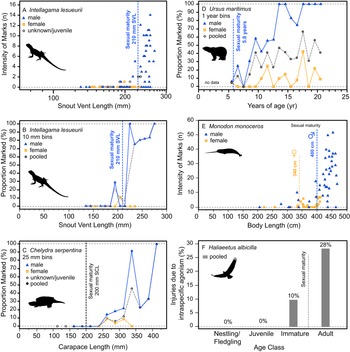
For comparison with the tyrannosaurid data, intraspecific bite lesion morphology, frequency, intensity, and occurrence were also analyzed in an osteological sample of 72 Alligator mississippiensis skulls and lower jaws (see Supplementary Data). In addition to the A. mississippiensis data, a literature review also provided sex-specific data on the intraspecific bite/tooth-mark lesion frequency for 114 extant species/datasets, sampling most major tetrapod clades (see Supplementary Data). A subset of these also provided useful size/age-specific data on frequency/intensity, including the agamid lizard Intellagama lesueurii (Baird et al. Reference Baird, Baird and Shine2012) (n = 110), the chelydrid turtle Chelydra serpentina (Keevil et al. Reference Keevil, Hewitt, Brooks and Litzgus2017) (n = 292), the polar bear Ursus maritimus (Ramsay and Stirling Reference Ramsay and Stirling1986) (n = 329), and the narwhal Monodon monoceros (Gerson and Hickie Reference Gerson and Hickie1985) (n = 71) (see Supplementary Data). Similar, but not fully comparable, data on traumatic injuries in white-tailed sea eagles Haliaeetus albicilla (Müller et al. Reference Müller, Altenkamp and Brunnberg2007) (n = 49) were also considered.
Results
Lesion Morphology
Lesions are observed as discrete patches of bone surface showing distinct rugose and porous texture, observations largely consistent with previous studies (Tanke and Currie Reference Tanke and Currie1998; Peterson et al. Reference Peterson, Henderson, Scherer and Vittore2009; Bell Reference Bell2010; Bell and Currie Reference Bell and Currie2010; Hone and Tanke Reference Hone and Tanke2015). These lesions vary in shape from circular or oval (Type 1, n = 114, 35% of cases) (Figs. 1C, iii, and 2H, left) to elongate (Type 2, n = 209, 65% of cases) (Figs. 1A,B,E,F, and 2A–G) (Tanke and Currie Reference Tanke and Currie1998). The porous/rugose bone textures of these lesions are considered to be the result of reactive bone growth, indicating the sites were actively healing at the time of death, differentiating these from tooth marks inflicted when being hunted or fed upon (i.e., peri- or postmortem), which lack reactive bone (Jacobsen and Bromley Reference Jacobsen and Bromley2009). A single case of an embedded tooth (Type 4) was found (TMP 1996.005.0013).
The bone texture of the lesions varies between two morphologies. In approximately one-third of cases (n = 103, 32%), the remodeled bone is expressed as a coarse and porous halo around a central incised area (Figs. 1A–C, and 2A,C,E), whereas the remaining two-thirds of cases (n = 219, 68%) show no central incised areas and exhibit smoother, less porous areas of reactive bone, ranging from raised/blisters to flush (Figs. 1E,F, and 2B,D–G). Within the sample of incised/porous lesions, the boundary between the central incised areas and the surrounding remodeled halo varies from sharp and jagged (e.g., Fig. 2A) to smooth (e.g., Fig. 2E). The thickness of the surrounding halo of remolding also varies from thin (e.g., Figs. 1B, and 2A) to thick (e.g., Figs. 1B, and 2E,H), often exceeding the diameter of the incised region. The halo also varies greatly in topography, with some instances being only a slightly raised margin (Figs. 1A, and 2A,C) and others being a large, swollen band (e.g., Figs. 1B, and 2E). There appears to be a positive correlation between the diameter of the halo and its elevation, with the largest halos also being the most swollen. For lesions that are not incised, the topography varies from flat (i.e., flush with the surrounding bone surface) (Figs. 1F, and 2B,G) to raised (Figs. 1E, and 2D–F).
The morphology of the central incised areas of Type 1 lesions are largely consistent with the ichnofossil Nihilichnus nihilicus (Mikuláš et al. Reference Mikuláš, Kadlecová, Fejfar and Dvořák2006) (i.e., triangular, circular to ovoid pits), while those of Type 2 are largely consistent with the ichnofossil Linichnus serratus (Jacobsen and Bromley Reference Jacobsen and Bromley2009) (i.e., linear grooves V- to U-shaped in cross section). The major differences between the lesions and these inchnotaxa are that contrasting with N. nihilicus, the shapes are circular to ovoid without triangular examples, and contrasting with L. serratus, the serrated margin is lacking. In both ichnotaxa, the bone surrounding the marks has no reactive halo. The ichnotaxon Knethichnus parallelum, which consists of millimeter-scale parallel striae often seen on tyrannosaurid feeding traces (Jacobsen and Bromley Reference Jacobsen and Bromley2009; Bell et al. Reference Bell, Currie and Lee2012), likely caused by serrations being dragged across the bone surface, are not seen on the healed or partially healed bite marks on tyrannosaurid cranial elements.
Although the lesions can vary greatly in aspect ratios (from round to oval to elongate), they never show branching or bifurcation features. Among the most elongate lesions, those on the maxilla occasionally show a slight arc, while those of the dentary are straight. In many circumstances, particularly specimens from the Belly River Group, the areas of reactive bone also have lighter colors than the surrounding bone (e.g., TMP 1985.098.0001, 1991.036.0500, 1994.012.0602; 2001.036.0001 [lacrimal], 2002.012.0101, 2010.005.0007).
A comparison with previously published descriptions of lesions on individual specimens is largely consistent but does reveal rare inconsistent results. For example, Bell and Currie (Reference Bell and Currie2010: Fig. 3B) described the presence of one large diagonal lesion on an Albertosaurus left dentary, TMP 2003.045.0084, whereas this study suggests this lesion is merely the most obvious of a set of four parallel lesions (the third) (Figs. 1D, and 2F). These discrepancies suggest that, at least in some cases, interpretation of what is considered a bite mark (or what may be overlooked) may vary between observers and is likely at least partially subjective. These discrepancies are rare, however, and are unlikely to affect the major patterns documented here.
Lesion Frequency and Intensity
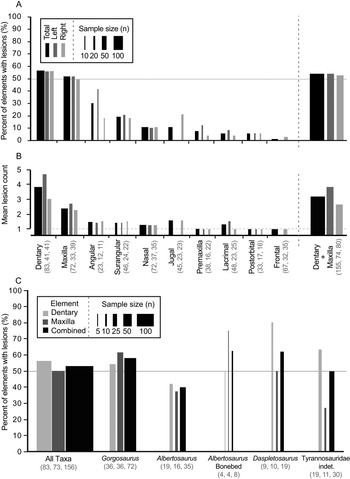
Out of 528 elements examined, 324 lesions were documented on a total of 122 tyrannosaurid cranial elements (Table 1). The dentary and maxilla are the elements that displayed the highest frequency (proportion of elements with lesions: 47/83, 57%, and 37/72, 51%, respectively) and intensity (lesion count per element: mean 3.8 and 2.5 lesions per element, respectively) of bite lesions. The remaining cranial bones had significantly lower frequencies (angular 30%, rest <20%) and intensities (<1.6) of lesions (Fig. 3A,B, Table 1, Supplementary Tables S4, S5). Due to the dominance in both frequency and intensity by the dentary and maxilla and their bearing a useful size metric (e.g., alveolar size), some subsequent analyses (especially those dealing with the proportion of specimens showing marks through a size series) rely only on these two elements.
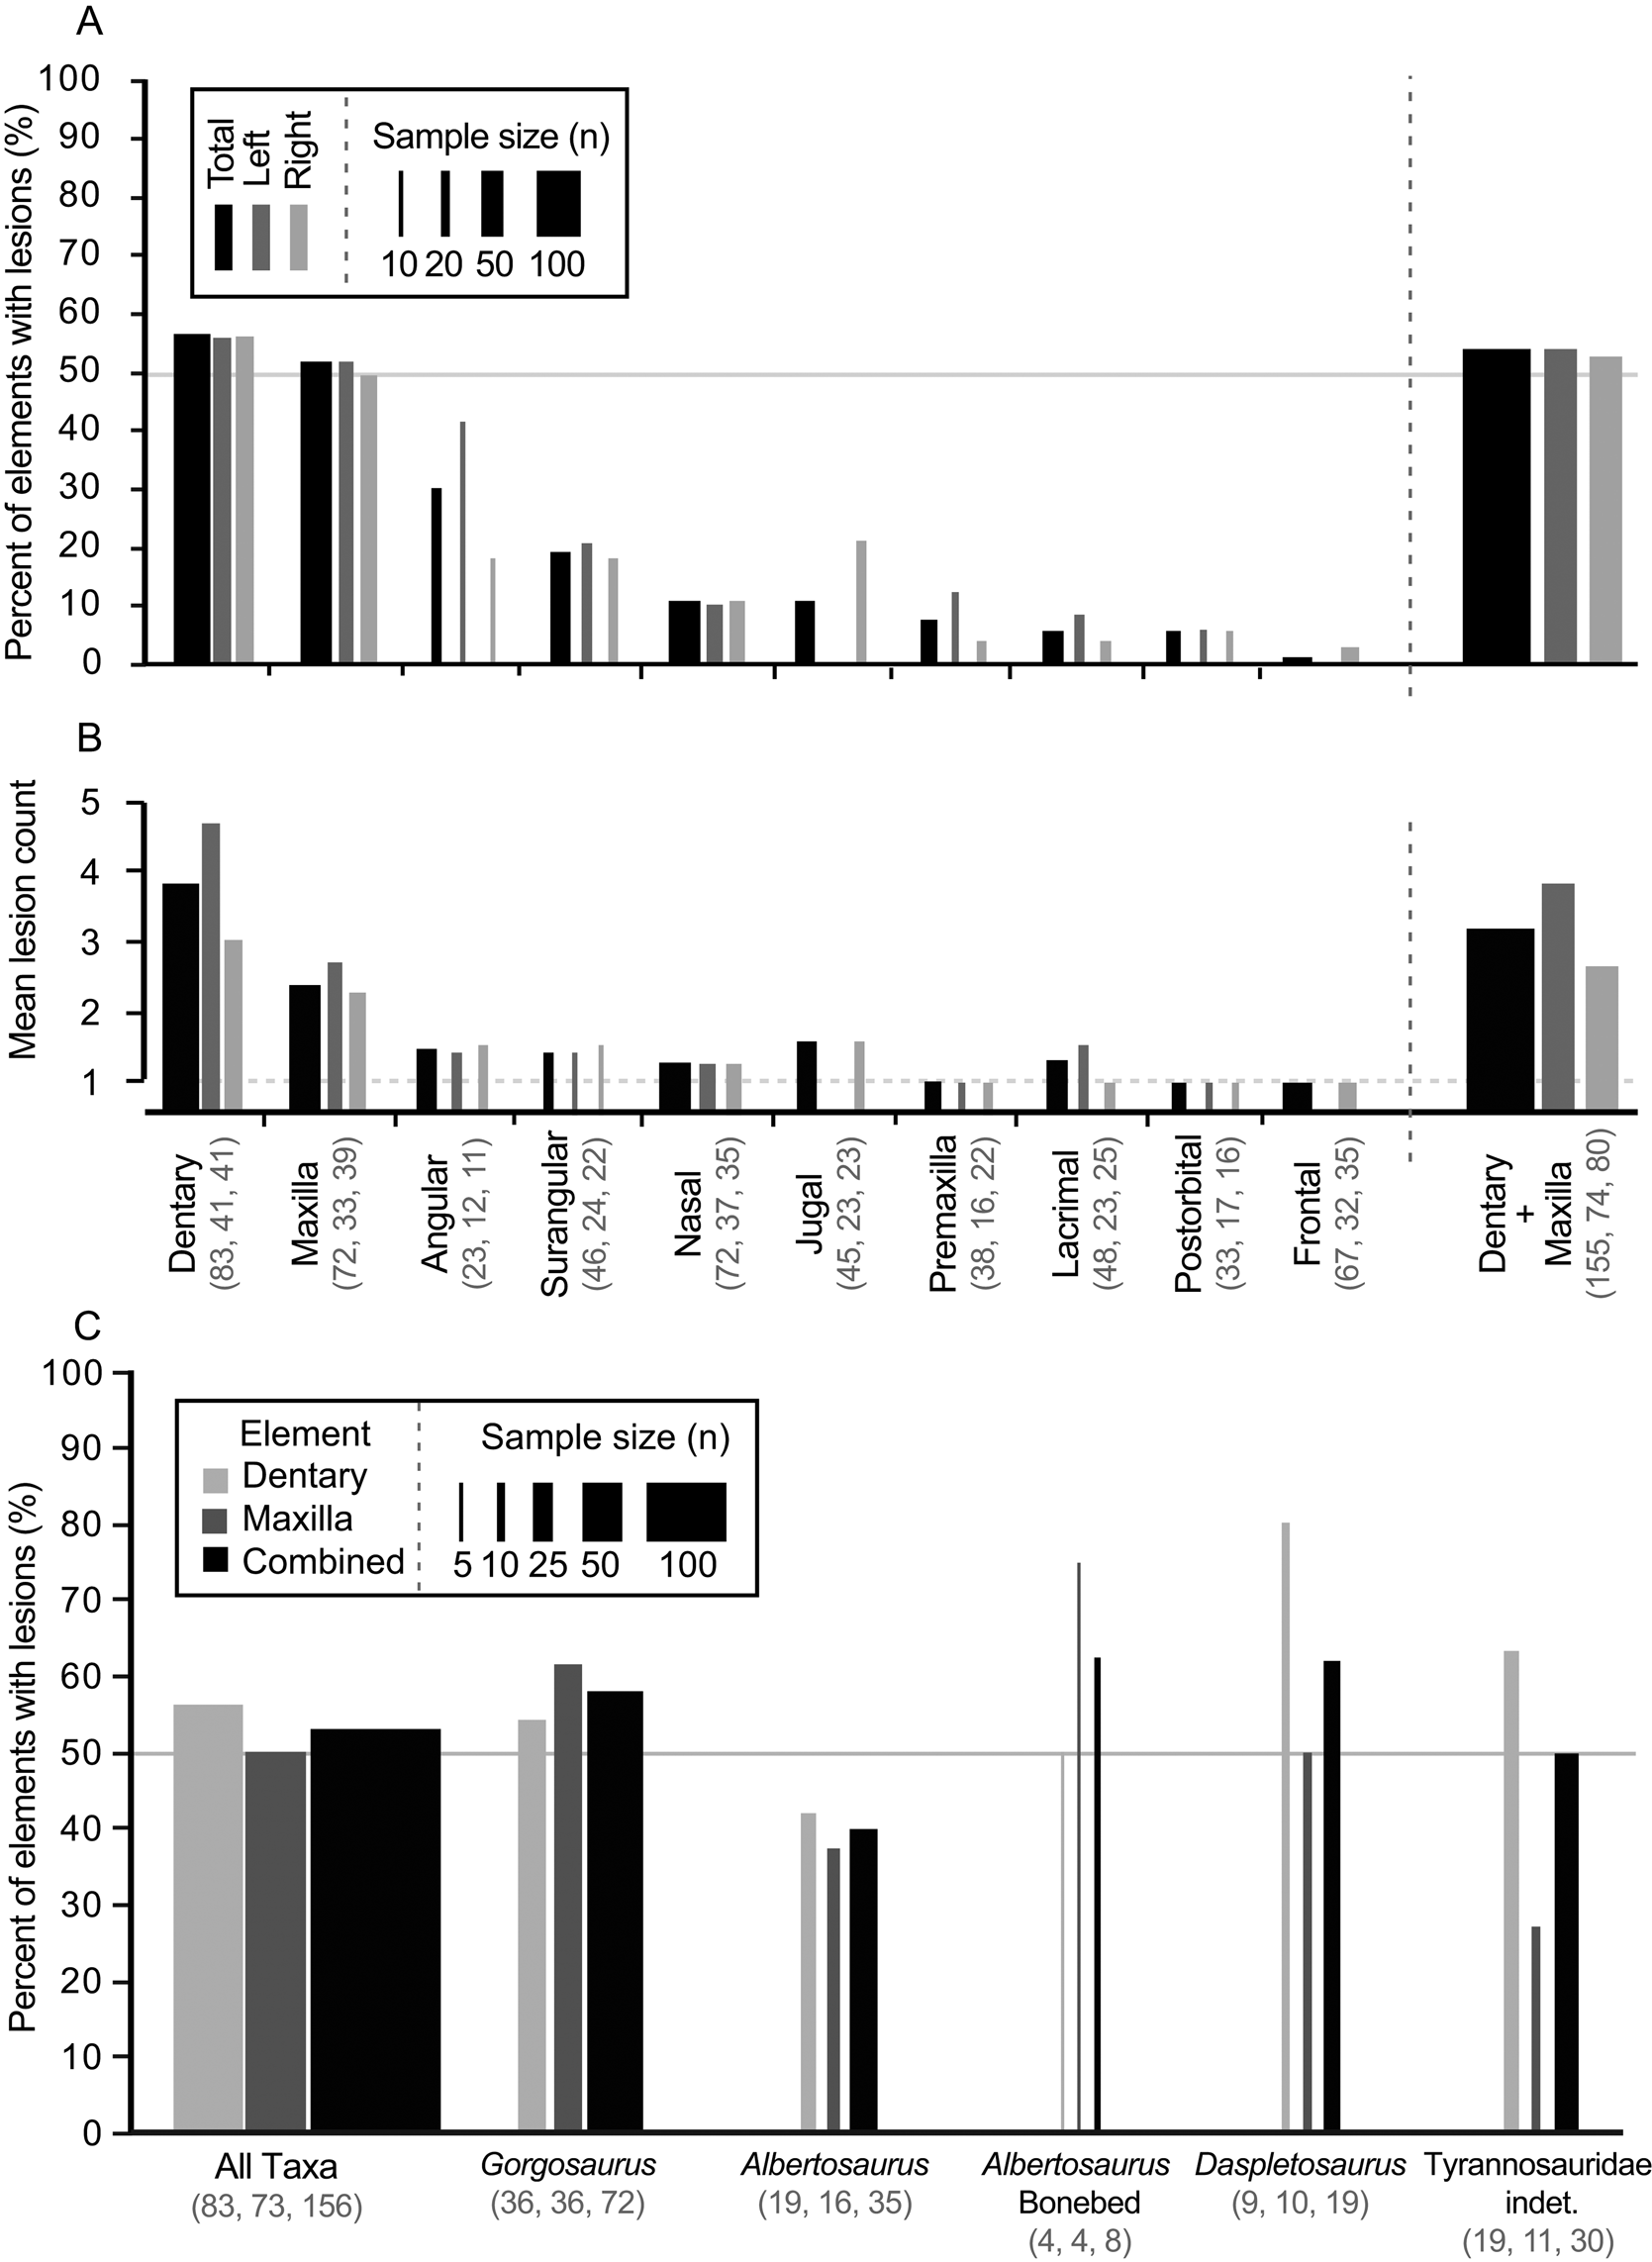
Figure 3. Frequency (A, C, percent of element/taxa with lesion) and intensity (B, mean lesion count per affected element) of tooth-strike lesions across the tyrannosaurid dataset by element (A, B) and taxon (C). A, Frequency across elements; B, intensity across elements; C, frequency across taxa. Each element (A, B) is broken down into combined (black) as well as left (dark gray) and right (light gray) samples, while each taxon (C) is broken down into maxilla (dark gray) and dentary (light gray) as well as combined (black) samples. Line width scaled to sample size. Solid horizontal line in A and C indicates 50% frequency. Dotted horizontal line in B represents the minimum (singleton marks only). Rightmost bar in A and B represents pooled maxilla and dentary datasets. Numbers in brackets represent sample size.
Laterality
A comparison between left and right sides shows that, both overall and for individual elements, lesion frequency (Fig. 3A, Table 1) and lesion intensity (Fig. 3B, Table 1) are not statistically different between sides (Table 1). Combined, these data suggest no systemic left–right biases in the frequencies or intensities of tooth-strike lesions.
Taxonomic Distribution Patterns of Lesions
Lesion frequency and intensity patterns are relatively consistent (χ2 p > 0.08 for frequency, Kolmogorov–Smirnov test p > 0.32 for intensity; Fig. 3C, Supplementary Table S6) across three tyrannosaurid taxa represented by a large number of specimens (35 Albertosaurus sarcophagus, 19 Daspletosaurus spp., 71 Gorgosaurus libratus, and 30 indeterminate Tyrannosauridae), with the combined (pooled) maxillary and dentary tooth-strike lesion frequencies averaging between 40% and 63% (Fig. 3C, Supplementary Table S6). A small sample of eight Albertosaurus specimens recovered from a bone bed, and potentially representing a gregarious grouping (Currie and Eberth Reference Currie and Eberth2010), also shows a similar lesion frequency of 62.5%. These results suggest that genus-level differences in frequency cannot be identified in the current sample, and the overall pattern represents a common trend for the tyrannosaurids studied.
Lesion Size Distribution
The lesions range in length between 3.0 mm and 166.2 mm (mean = 31.5 mm, median = 25.6 mm). The size distribution does not fit a normal distribution (Shapiro-Wilk normality test p-value < 2.2e-16) and is strongly positively skewed (skewness = 1.92); however, the skewness is removed (skewness = −0.14), and the distribution is not statistically distinguishable from normal (Shapiro-Wilk normality test p-value = 0.660), once the data are log transformed (Supplementary Fig. S3).
Position and Orientation of Lesions
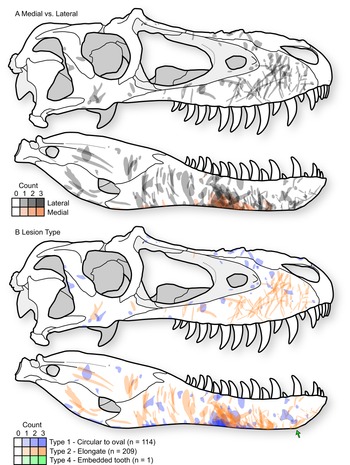
A distinct and consistent pattern is observed in the position and orientation of lesions in tyrannosaurids. These patterns are observable across the sample of individual elements (Supplementary Datasets S1, S2) but are most clear when the entire sample is projected onto a single representative tyrannosaurid skull, with individual lesions undergoing reflection (i.e., left to right side) and isometric scaling (i.e., relative to the size of the representative skull) when appropriate (Fig. 4A, Supplementary Fig. S4).
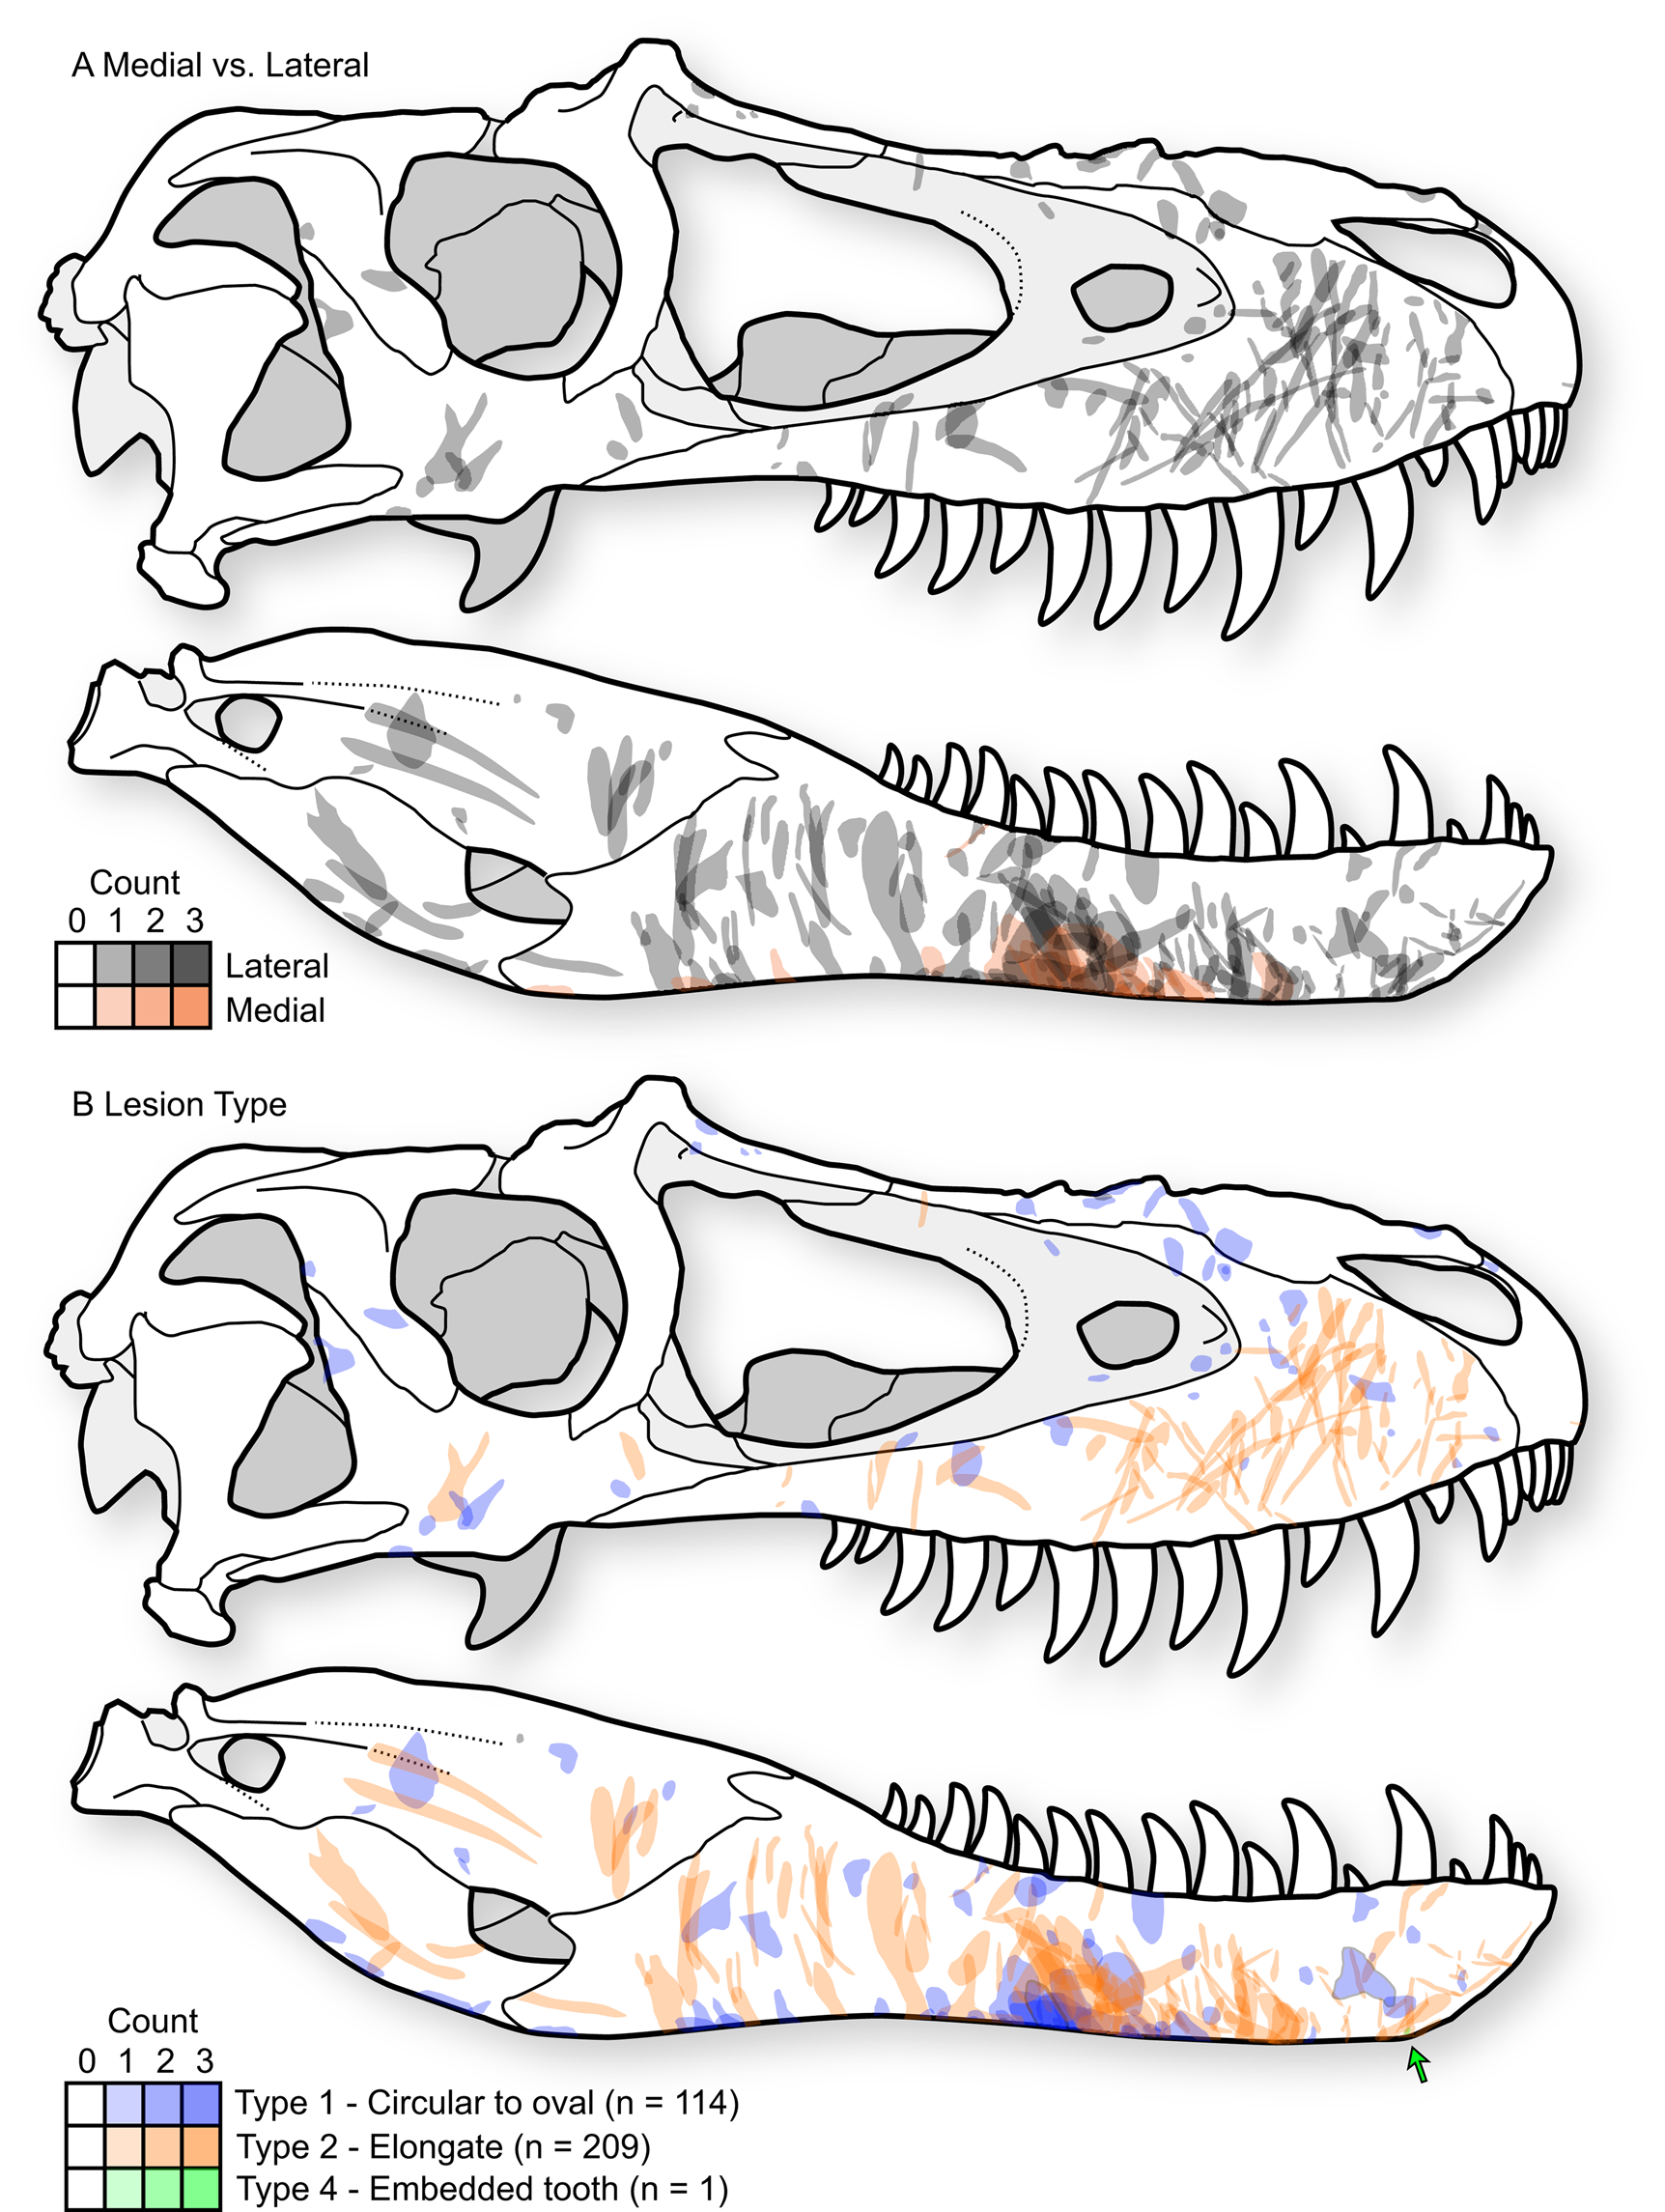
Figure 4. Cumulative tooth-strike lesion sample (72 specimens, 323 marks) projected (including scaling and reflection) into a single composite skull in right lateral view, showing the overall pattern of position, orientation, shape, and density of lesions. A, Lesions distinguished based on those occurring on the lateral surface of the bone (gray) and those on the medial surface of the bone (red). B, Lesions distinguished based on mark morphology; Type 1 = round to oval punctures (blue, n = 114), Type 2 = elongate marks (red, n = 209), Type 4 = embedded tooth (green, n = 1). Skull outline based on TMP1991.036.0500, modified from (Currie Reference Currie2003b).
Type 1 and Type 2 lesions are unevenly distributed on the tyrannosaurid skull, each having distinctive occurrences (Fig. 4B). On the snout (premaxilla, maxilla, and nasal), the circular-to-oval Type 1 punctures are restricted to areas that face dorsally: the dorsal midlines of the premaxillae and nasals, the dorsal parts of the maxillae adjacent to the nasal sutures, and the ridges ventral to the antorbital fenestrae (Fig. 4, Supplementary Fig. S4). In contrast, the elongate Type 2 lesions are concentrated on lateral surfaces: the lateral surface of the maxilla, as well as the area between and ventral to the naris and antorbital fenestra. These elongate lesions often slope diagonally (posteroventrally at about 45° toward the alveolar margin) and, when showing polarity, are deeper and wider at their dorsal extent.
This pattern is largely inverted for the lower jaw, where Type 1 punctures largely occur along the ventral margins, whereas Type 2 lesions are restricted to the lateral surfaces (Fig. 4B). Type 2 lesions on the dentary appear less consistent in orientation compared with those on the maxilla. Many lesions on the ventral margin of the dentary continue onto the medial side of the bone, suggesting trauma between the dentaries (Fig. 4A), with potential damage to oral tissue. Indeed, these lesions on the ventromedial surface of the dentary often have the highest degree of swelling of the surrounding bone tissue.
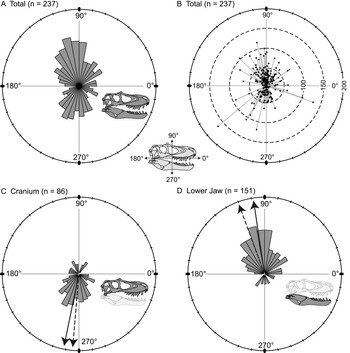
Orientations of the long axis of lesions are nonuniform (Kuiper's one-sample test of uniformity), and a high proportion of the lesions are vertical (dorsoventral) to subvertical (Fig. 5A). A polarity plot fails to show any strong pattern of lesion length and orientation (Fig. 5B). The consistent directionality of the lesions is further reinforced when the elements of the cranium and lower jaw are considered separately. Lesions are predominantly oriented ventrally or slightly posteriorly (circular mean = 258.5°, weighted mean = 265.1°) on the cranium (Fig. 5C), whereas they are predominantly oriented dorsally and slightly posteriorly (circular mean = 98.2°, weighted mean = 110.9°) on the lower jaw (Fig. 5D).
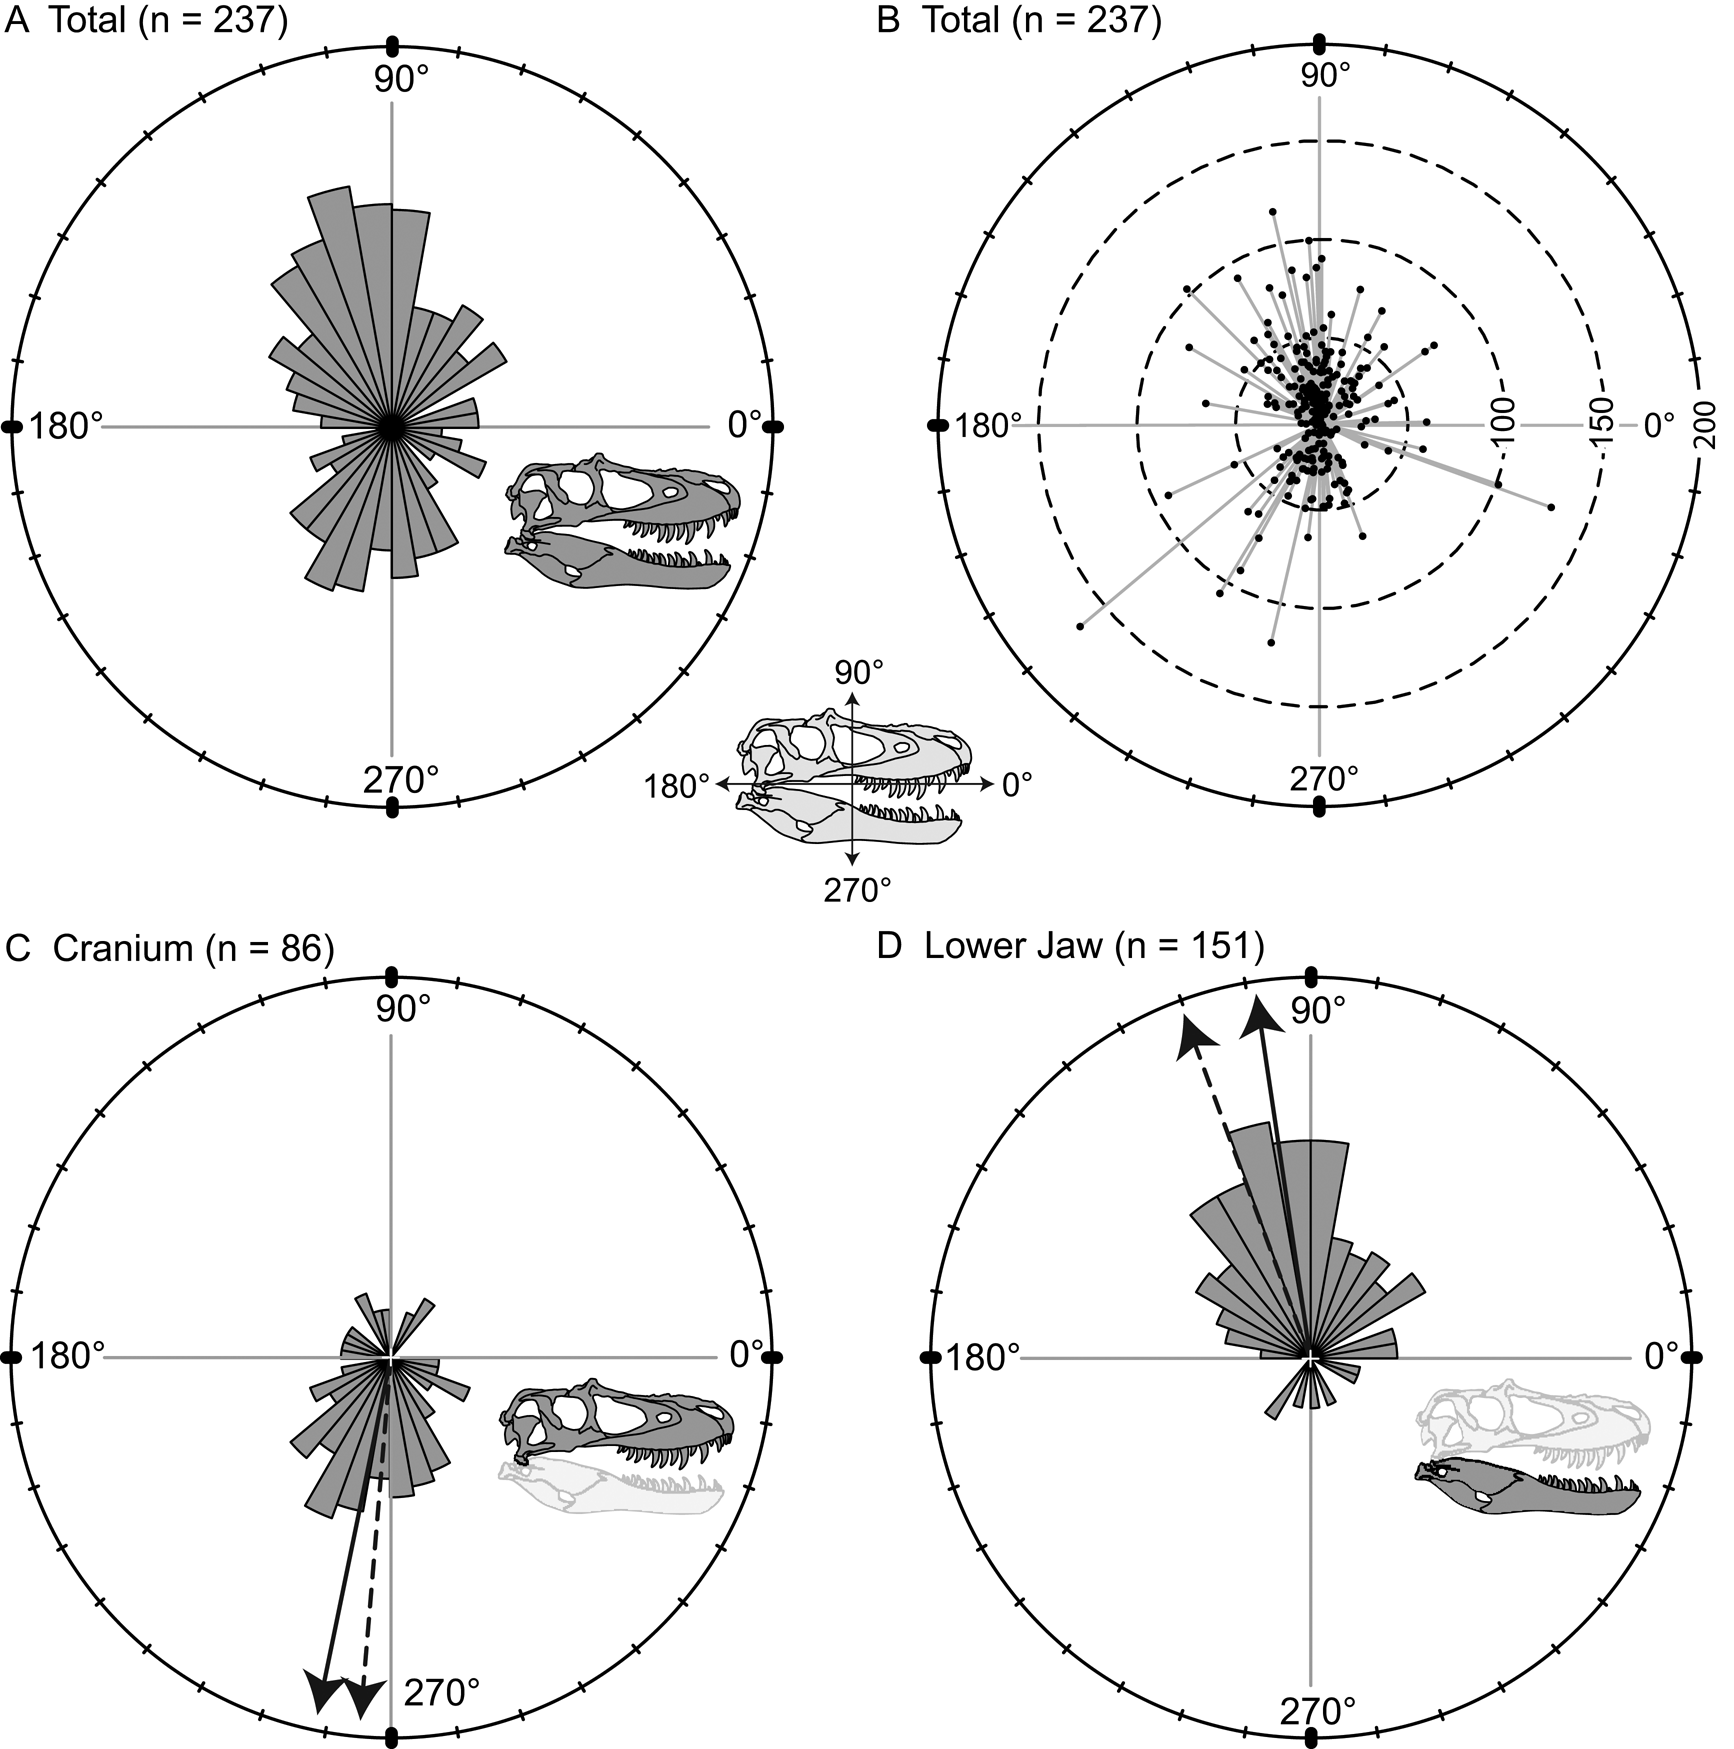
Figure 5. Rose diagrams (A, C, D) and polar plots (B) showing orientation (circular distributions) of all tooth-strike lesions with a long axis. A, Rose diagram showing circular distribution all lesions (n = 237). B, Polar plot showing circular distribution and lengths of all lesions (n = 237). C, Rose diagram showing circular distribution of all lesions on the cranium (n = 86). D, Rose diagram showing circular distribution of all lesions on the lower jaw (n = 151). Solid and dashed arrows in C and D represent the unweighted mean and weighted mean, respectively.
Ontogenetic Distribution of Lesions
Occurrence
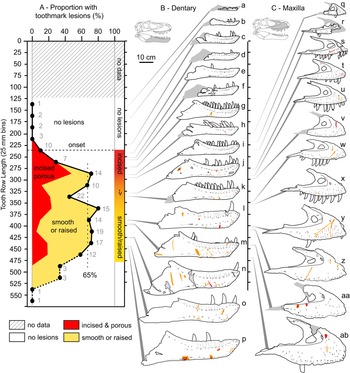
The occurrence of tooth-strike lesions on individual skeletons and elements is strongly positively correlated with body size (Figs. 6–8). Lesions are completely absent on elements/skulls of the smallest individuals (n = 18), with TRLs less than 215 mm (DETRL) or 234 mm (raw). This sample of lesion-free smallest specimens includes the 13 smallest dentaries (136–255 mm TRL) and the five smallest maxillae (181–214 mm DETRL, 198–235 mm TRL). Lesions are first observed in two similar-sized articulated specimens, TMP 2016.014.0001 and TMP 2016.012.0014 (214 and 216 mm DETRL, respectively; Figs. 6–8). Lesion counts increase drastically with size in specimens larger than ~250 mm TRL (Fig. 6, Supplementary Table S7) and reach maximum frequency in large individuals (~400 mm TRL). In contrast, the proportion of specimens with lesions remains relatively constant at ~60% (Figs. 7, 8) with no significant variation across further size classes (see Supplementary Table S8). Frequency results are robust across multiple binning protocols (50, 25, 20, 15, and 10 mm TRL), using both raw TRLs and DETRLs (Fig. 8).
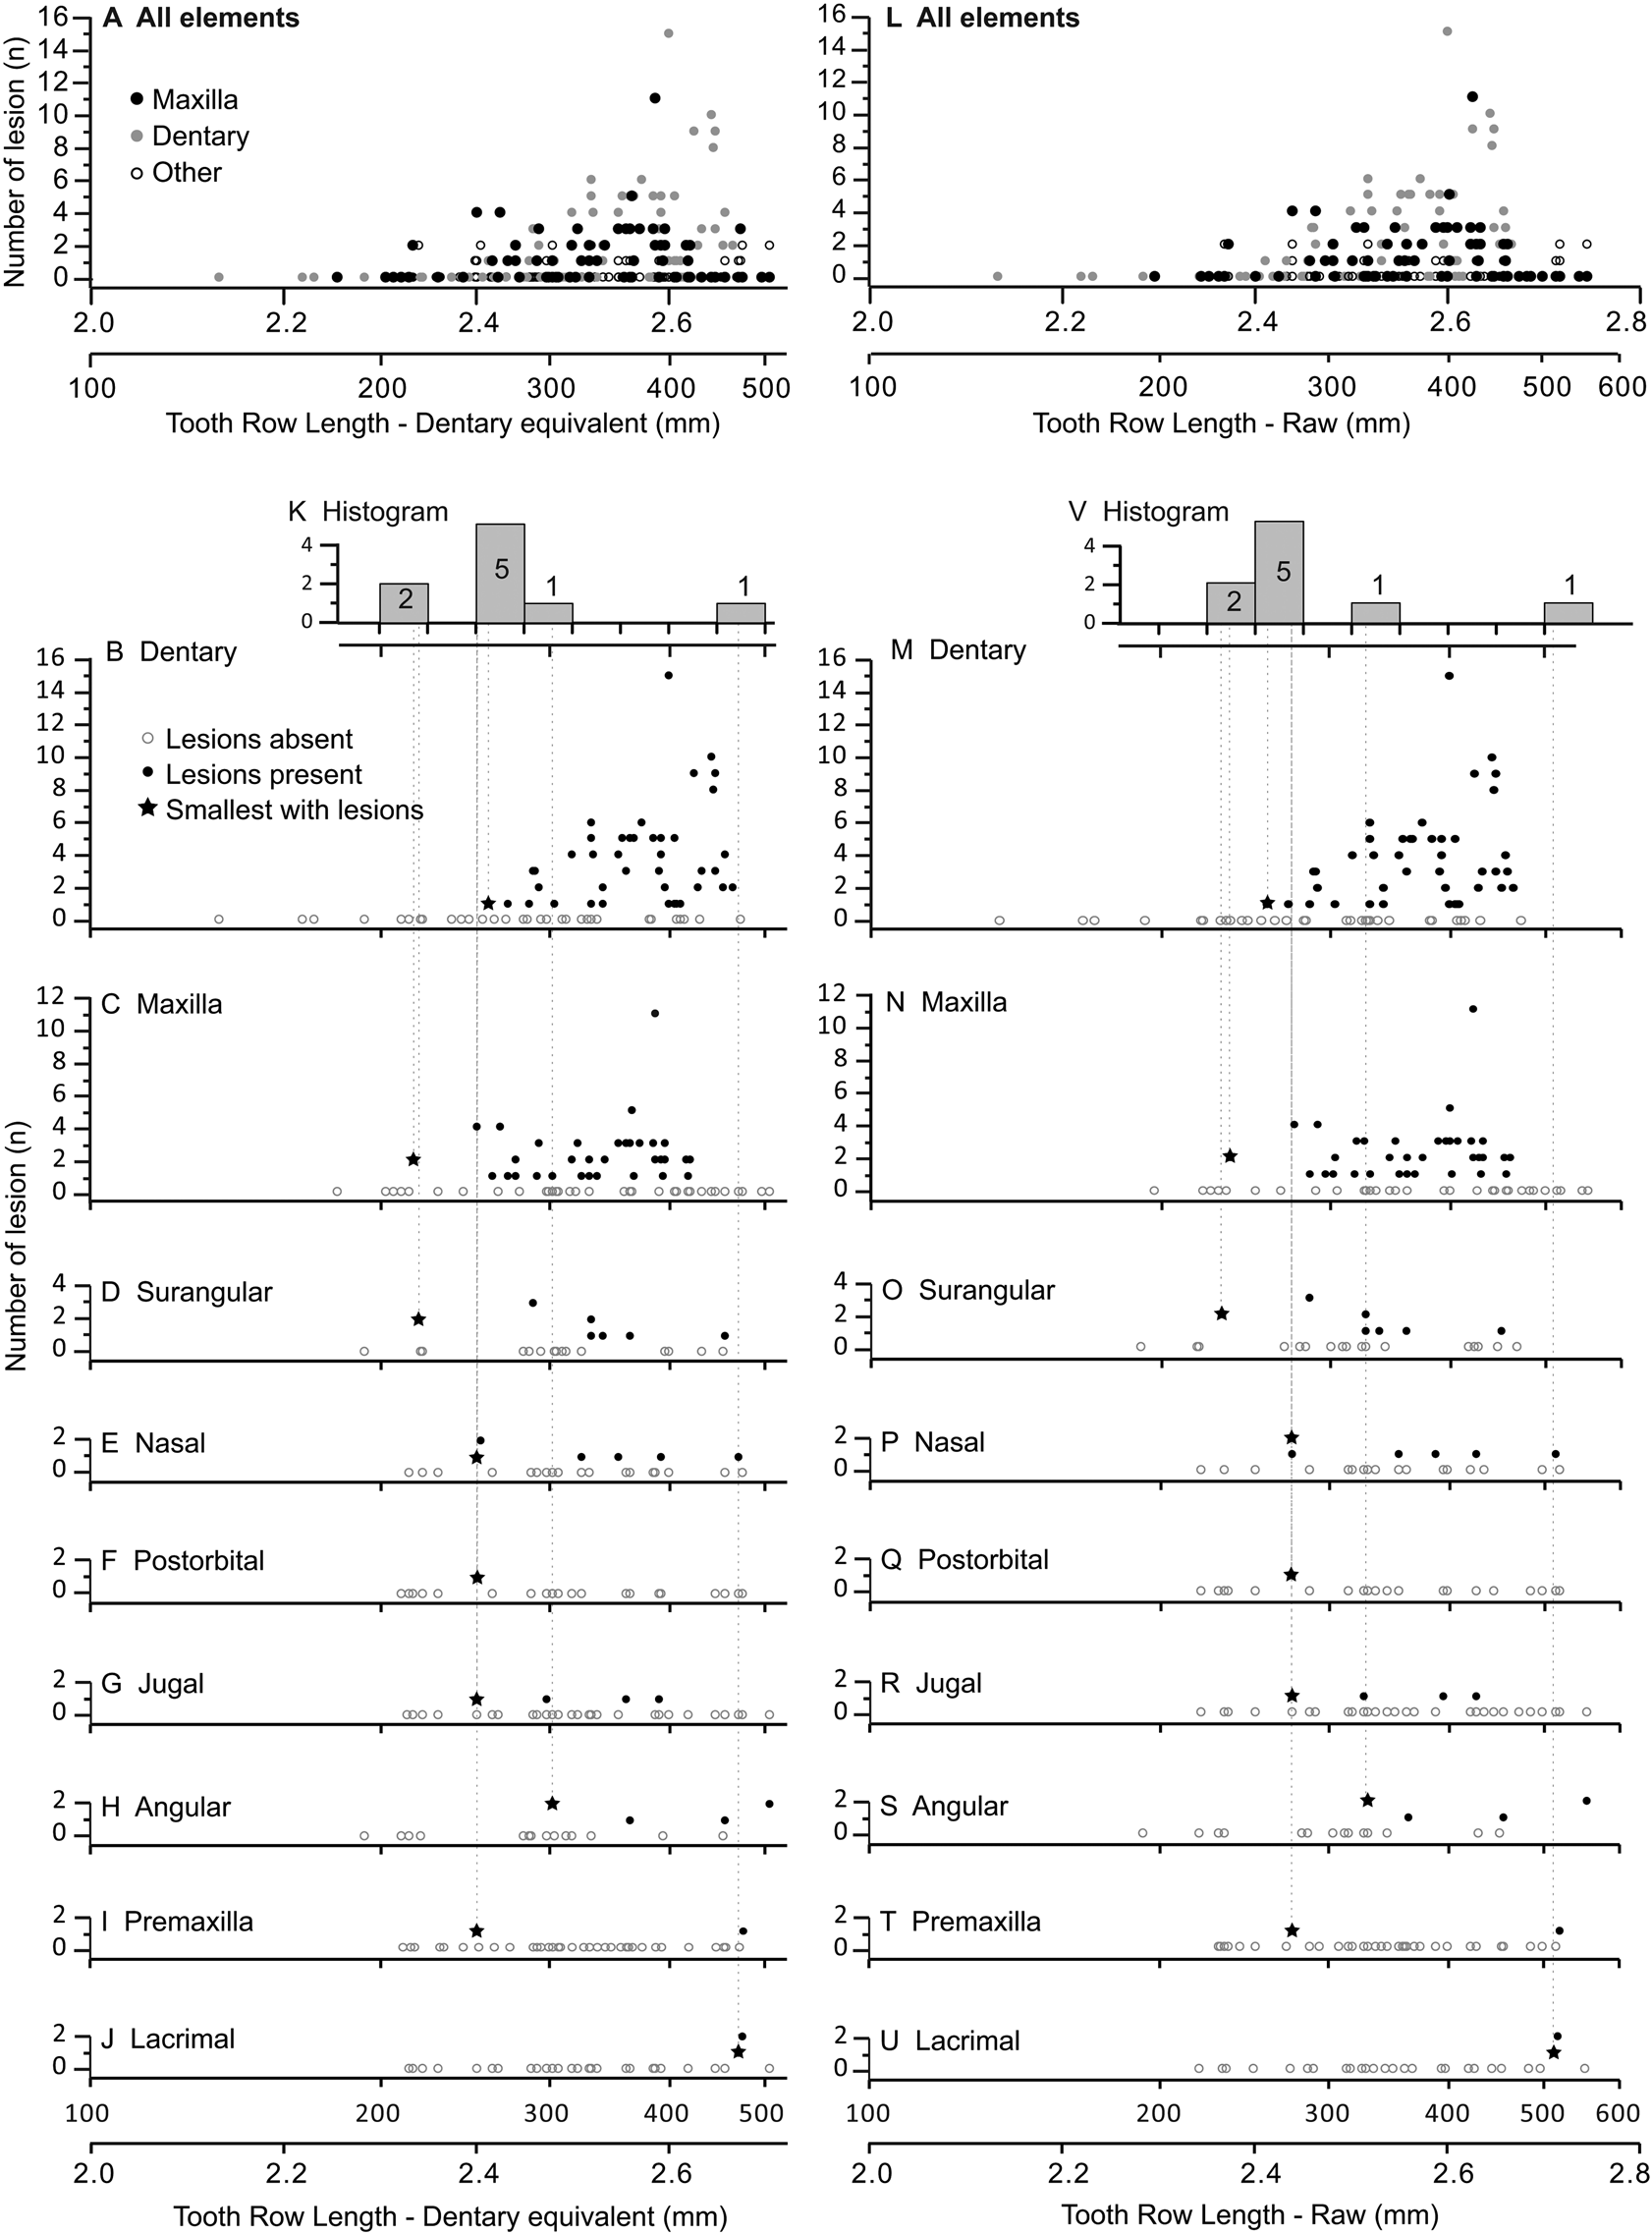
Figure 6. Graphs showing number of lesions per specimen (bite-mark intensity) as a function of element size, scaled to dentary equivalent tooth row length (left A–K) and raw tooth row length (right L–V). Each dot represents a single specimen. (A, L) Illustrate the combined data for all bones, while the dentary (B, M), maxilla (C, N), surangular (D, O), nasal (E, P), postorbital (F, Q), jugal (G, R), angular (H, S), premaxilla (I, T), and lacrimal (J, U) are also shown separately. K and V are histograms showing the smallest specimen with lesions (shown as stars in the bone-specific plots) for each bone.

Figure 7. A, Plot showing the portion of specimens with tooth-strike lesions across the size series (25 cm bins, raw tooth row length), as well as the relative proportion of incised and porous (red) versus smooth or raised (yellow) lesions. B, Line drawings of exemplar dentaries (n = 16) arrayed in size series, showing lesions acquisition. C, Line drawings of exemplar maxillae (n = 12) arrayed in size series, showing lesion acquisition. Gray numbers in A indicate samples size in respective bins. Specimens (r = reflected): a, TMP1990.081.0026; b, TMP1994.012.0155; c, TMP1986.144.0001; d, TMP1987.046.0001; e, TMP1999.050.0040; f, CMN 57057 (r); g, TMP1991.036.0500; h, TMP1994.143.0001; i, UALVP 49500; j, ROM 1247; k, TMP1999.055.0170 (r); l, TMP1986.205.0001 (r); m, UALVP 45937 (r); n, TMP2003.045.0084 (r); o, TMP2003.045.0076; p, TMP1967.009.0164 (r); q, TMP1993.036.0539 (r); r, TMP1986.144.0001; s, TMP2016.014.0001 (r); t, UALVP 56630; u, TMP1983.036.0100 (r); v, TMP2014.012.0006; w, TMP1999.033.0001; x, ROM 1247 (r); y, TMP2017.012.0002; z, TMP1998.125.0001; aa, TMP1995.025.0083 (r); ab, TMP1998.063.0088.
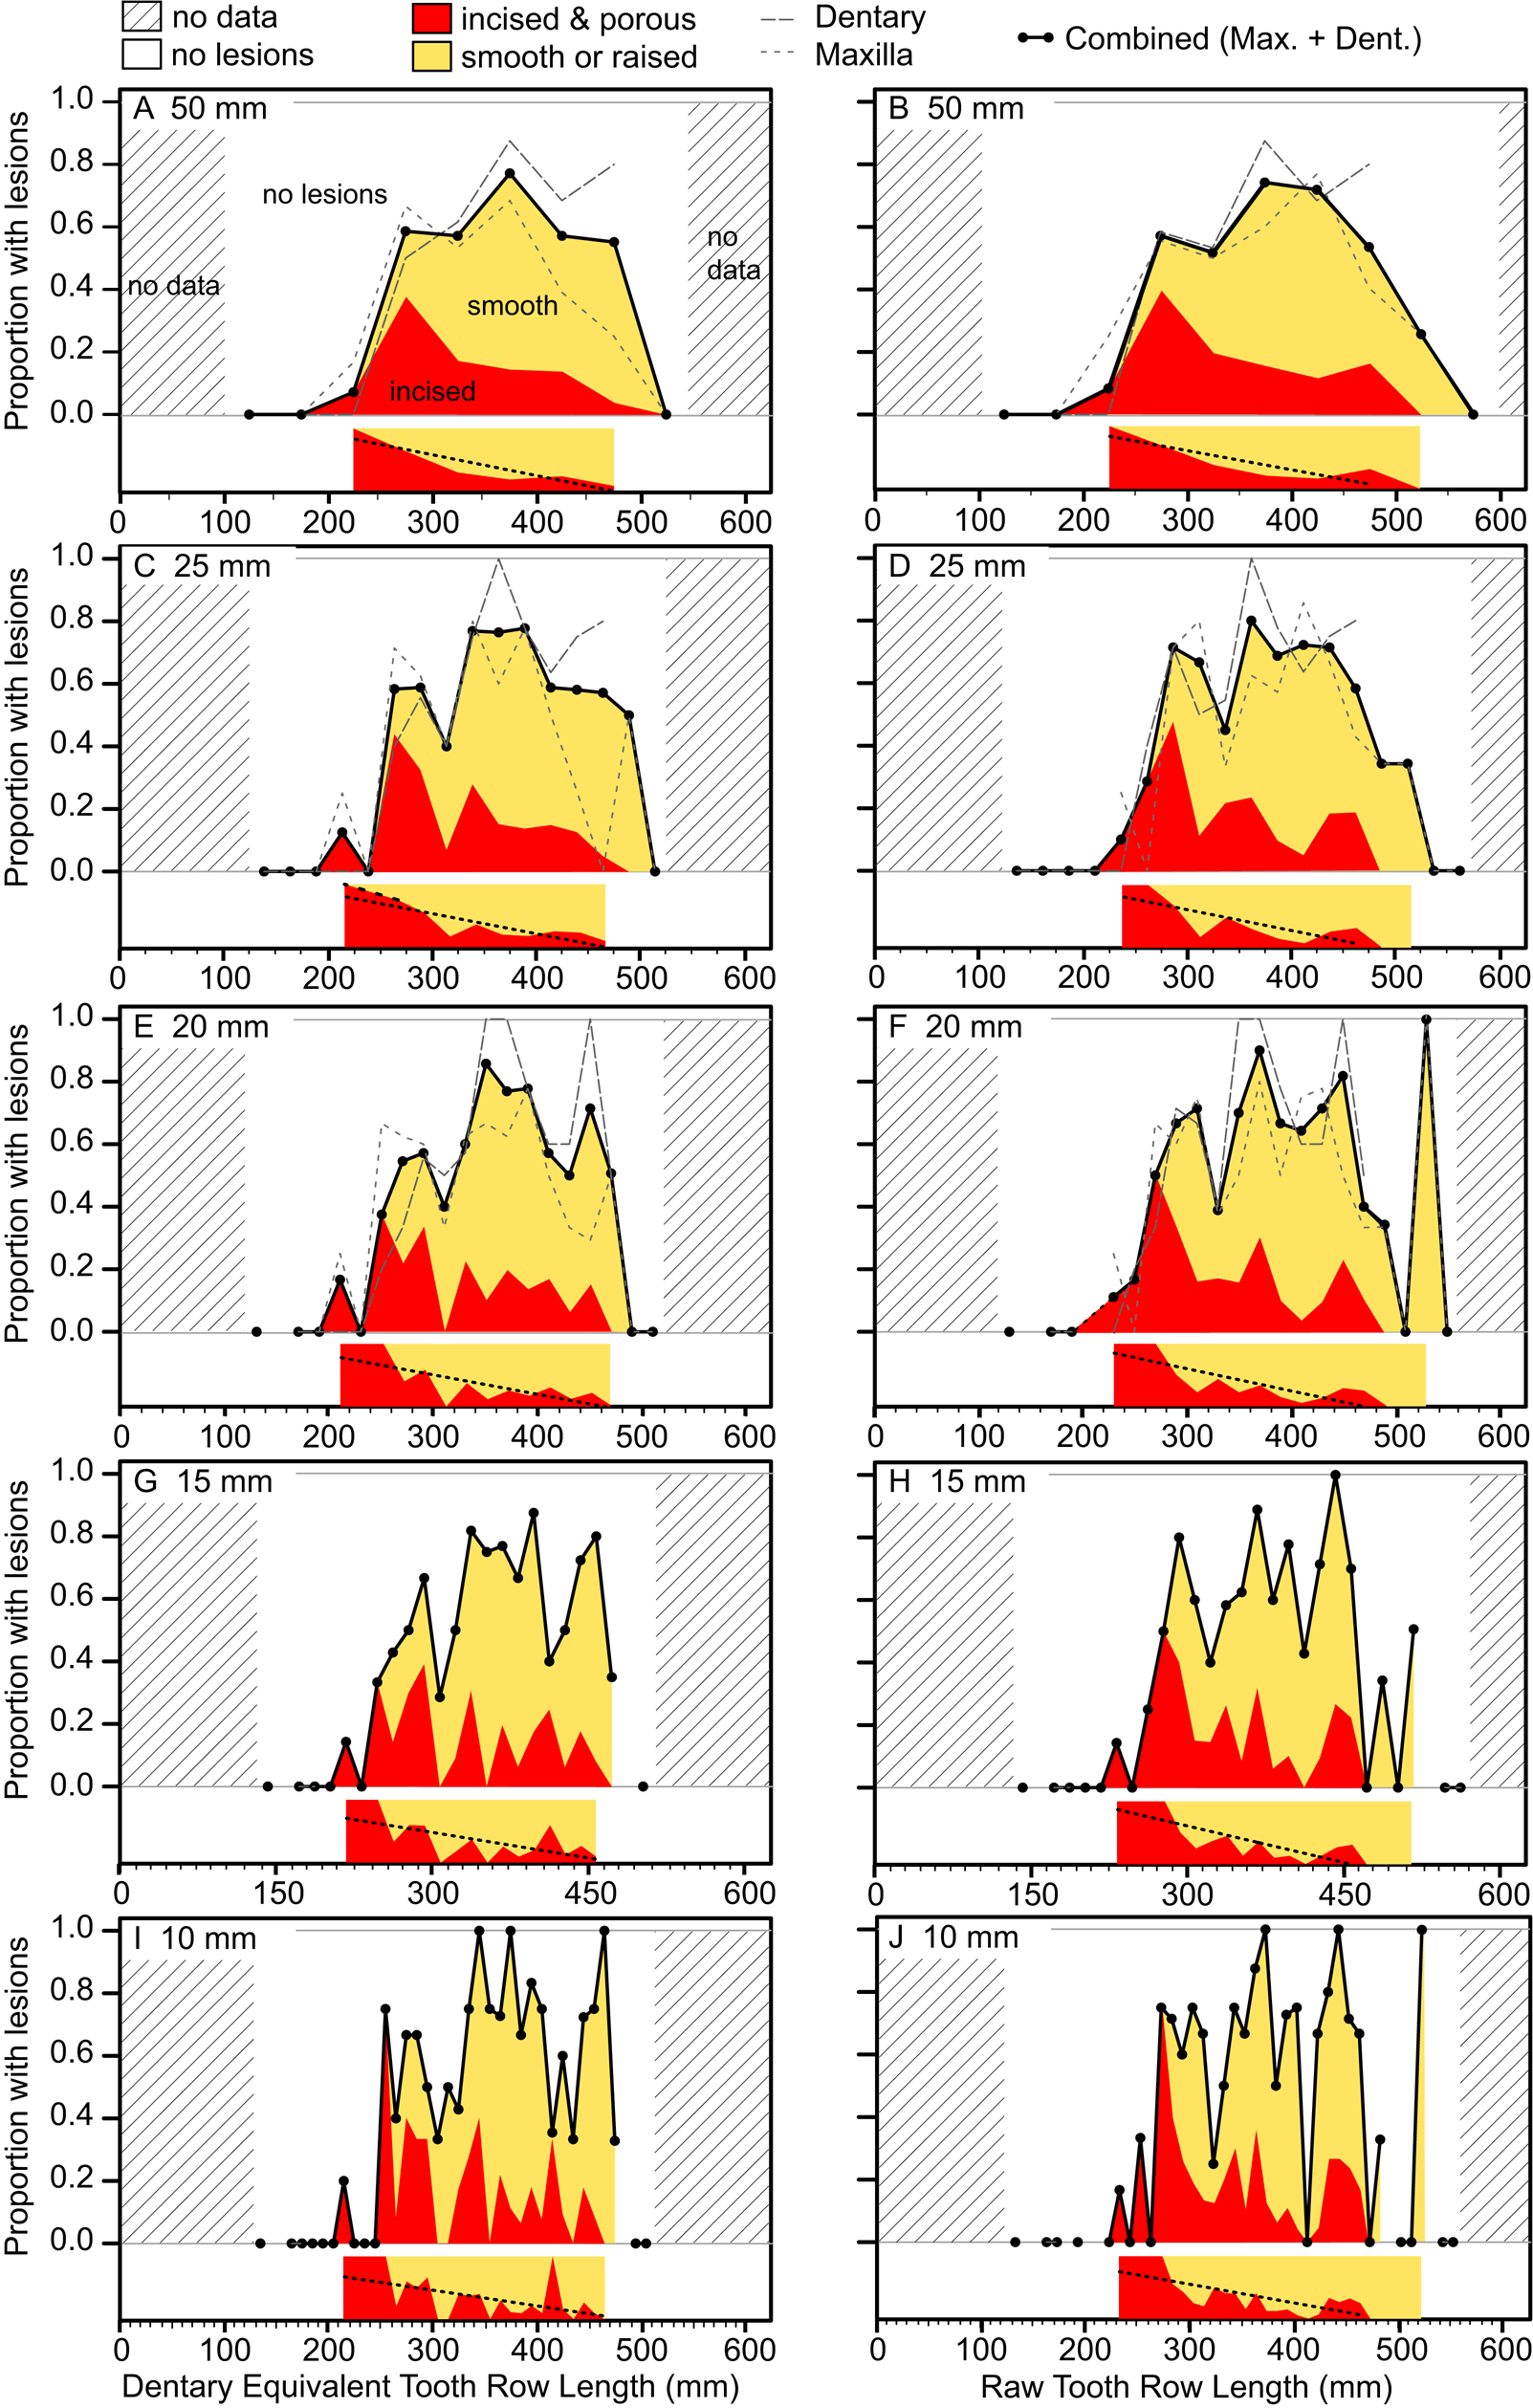
Figure 8. Plots showing the portion of specimens with healed or partially healed tooth-strike lesions across the size series under various binning treatments. Left column (A, C, E, G, I) shows dentary equivalent tooth row lengths, while the right column (B, D, F, H, J) shows raw tooth row length. Bin sizes are 50 mm (A, B), 25 mm (C, D), 20 mm (E, F), 15 mm (G, H), and 10 mm (I, J). Insets under each graph show the proportion of incised and porous (red) and smooth or raised (yellow) lesions within each bin. Combined (maxilla and dentary) proportions shown for all binning treatments, but element-specific proportions are only shown for large bins (50, 25, and 20 mm) due to low bin occupation at small bin size. (Color online.)
Similar patterns of ontogenetic distribution of lesions are observed independently in both Albertosaurus and Gorgosaurus subsamples, the only two tyrannosaurid taxa known from sufficient sample sizes to analyze patterns at the species level (Supplementary Figs. S4, S5). With the exception of low values for Albertosaurus in the 300–350 mm range (indicated by circles in the figure), the lesion frequency between Albertosaurus and Gorgosaurus differs by no more than 20%, raw TRL (Supplementary Fig. S5A), or 30%, DETRL (Supplementary Fig. S5B), through the ontogenetic series. These results are very similar to the multitaxic dataset (of which they are a subset), although it is unclear whether the small differences are of biological origin or due to sampling.
The relative proportion of incised and porous versus smooth or raised lesions is also strongly and significantly negatively correlated with size (r = −0.92 to −0.55, all p-values < 0.011; Fig. 7, Supplementary Table S9). Although minor differences are observed between size-binning treatments (Fig. 8), the smallest specimens are exclusively dominated by incised and porous lesions, and the relative proportion of these to smooth or raised lesions drops and plateaus in larger specimens.
Relative Size of Aggressor and Injured
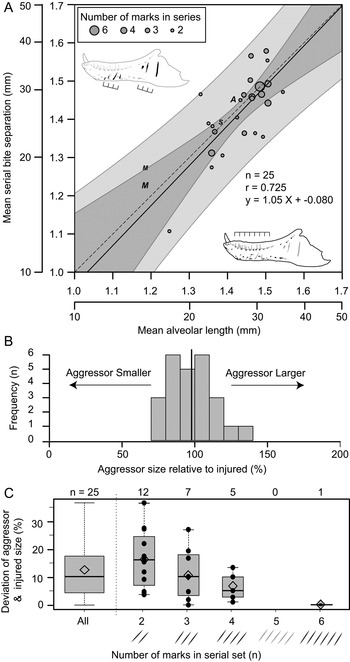
Of the surveyed lesions, a total of 26 sets (74 lesions in total) were interpreted to be the result of single bites, in which multiple (two [n = 12], three [n = 8], four [n = 5], and six [n = 1]) parallel and equidistant lesions represent the contact points of serially positioned teeth (Supplementary Table S10). These sets of serial lesions occur across 24 elements, with two dentaries (TMP 2003.045.0084 and TMP 2003.045.0076) and one associated skull (ROM 1247, left surangular, left dentary) bearing two different serial sets. Comparisons between mean distances separating successive lesions with mean alveolar lengths of that element allow for direct comparisons of the size between the aggressor (i.e., the “biter”) and the injured specimen (i.e., the “victim”) for each serial set. These two metrics of size show a strong and significant positive correlation (r = 0.725, p = 2.7 × 10⁻⁵) (Fig. 9A). When lesion spacing is regressed against alveolar length, the relationship is both isometric (slope = 1.044, 95% CI = 0.62, 1.46) and equal (intercept = −0.080, 95% CI = −0.68, 0.52) (Fig. 9A), indicating that statistical scaling equality between the two parameters is maintained as both animals increase in body size (i.e., a near 1:1 aggressor:victim ratio is maintained across all body sizes). The mean size of the aggressor is 98% that of the victim, with a maximum of 137% and a minimum of 72% (Fig. 9B). When the absolute difference between the aggressor and the injured specimen is considered, the mean difference is 12% (range of 0.2% to 37%) (Fig. 9C, leftmost column). The greater the number of lesions preserved in a serial set, the smaller the difference in estimated body size between the aggressor and victim (Fig. 9C).
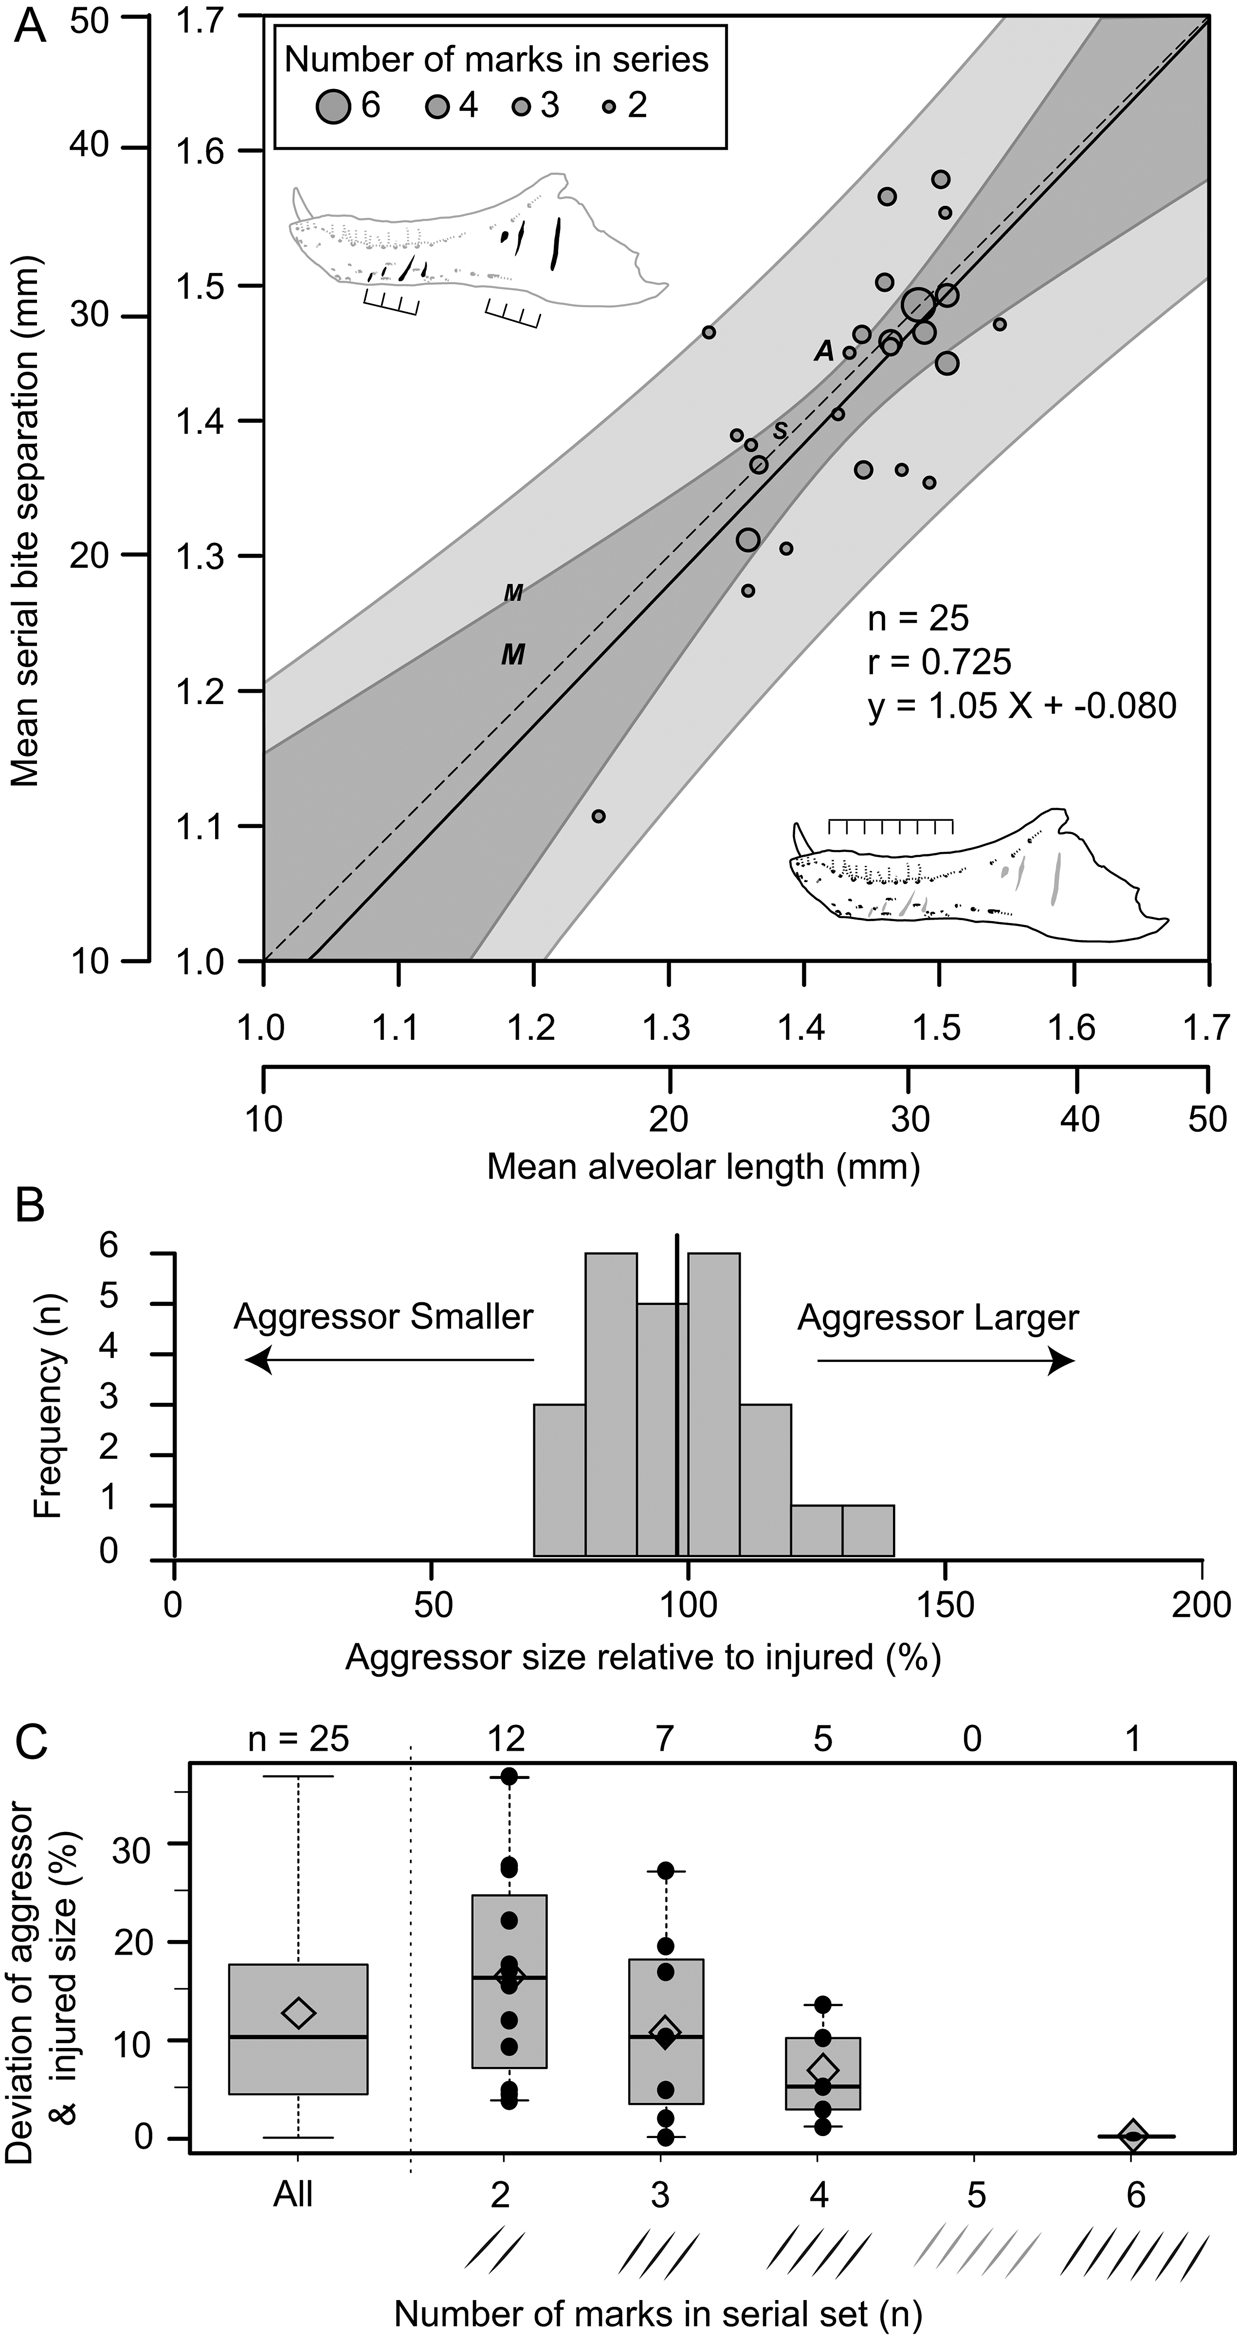
Figure 9. Correlation of estimated size between the injured specimen (based on mean alveolar length) and aggressor specimen (based on spacing between serial lesions). A, Regression of mean distance between successive serial lesions onto mean alveolar length. Solid line indicates line of best fit (OLS regression), while dark and light gray areas represent 95% confidence and prediction intervals, respectively. Dashed line represents isometry (slope of 1) with an intercept of zero. Circles indicate tyrannosaurid specimens (used for calculations), while “A”, “M”, and “S” indicate specimens of Allosaurus, Monolophosaurus, and Sinraptor, respectively (not used in calculations) (see Supplementary Table S10). Size of circles reflects the number of successive marks in each set from which mean was derived. B, Histogram showing the estimated size of aggressor relative to the injured specimen. Solid vertical line indicates mean. C, Box plots (with superimposed data points) showing the absolute deviation between aggressor and injured size as a factor of the number of lesions used to calculate mean spacing for each set of serial marks. Open diamond indicates mean.
Discussion
Interpretation of Lesions as Intraspecific Bite Marks
Multiple lines of evidence support the interpretation of the documented lesions as resulting from intraspecific bites from tyrannosaurs, consistent with previous interpretations (Tanke and Currie Reference Tanke and Currie1998; Peterson et al. Reference Peterson, Henderson, Scherer and Vittore2009; Bell Reference Bell2010; Bell and Currie Reference Bell and Currie2010; Hone and Tanke Reference Hone and Tanke2015; Dalman and Lucas Reference Dalman and Lucas2021). One direct line of evidence is the presence of a tyrannosaurid tooth embedded in the lower jaw of another tyrannosaurid individual (TMP 1996.005.0013) (Tanke and Currie Reference Tanke and Currie1998; Bell and Currie Reference Bell and Currie2010). However, several indirect lines of evidence also suggest the facial bite lesions were produced by tyrannosaurids. The consistency in position and orientation of the lesions across dozens of specimens suggest they were acquired due to a repeated, postured behavior and not due to random injuries acquired stochastically during the life of the animal.
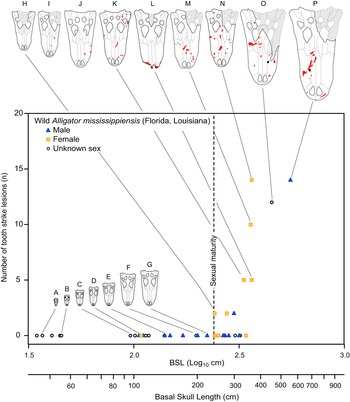
The pattern of bite marks observed in tyrannosaurids shows many similarities with the pattern of bite marks resulting from intraspecific aggression in extant crocodylians (Cott Reference Cott1961; Webb and Messel Reference Webb and Messel1977; Webb et al. Reference Webb, Manolis and Buckworth1983). Among living crocodylians, tooth/bite injuries are the most abundant (Webb et al. Reference Webb, Manolis and Buckworth1983), with these falling into the categories of puncture wounds (i.e., Type 1) or raking marks (i.e., Type 2) (Webb et al. Reference Webb, Manolis and Buckworth1983). Examination of modern Alligator mississippiensis osteological material also reveals a pattern of lesions very similar to that observed in tyrannosaurids: round to oval bite marks occur on dorsal- and ventral-facing surfaces, whereas elongate bite marks occur on more vertical surfaces (Supplementary Fig. S6, Supplementary Table S11, Supplementary Datasets S3, S4). Additionally, the inferred incised and porous-to-raised heading gradient of healed lesions is also seen in the bones of A. mississippiensis. Spacing between raking marks in extant crocodylians (Webb et al. Reference Webb, Manolis and Buckworth1983) and arcing puncture series in A. mississippiensis (Supplementary Fig. S7) are similar to the intertooth spacing of the crocodylian trace makers, similar to the pattern in tyrannosaurids. The pattern of how these lesions are accrued within an ontogenetic series in A. mississippiensis (Fig. 10) also reflects the pattern seen in the tyrannosaurid dataset (Figs. 6–8).
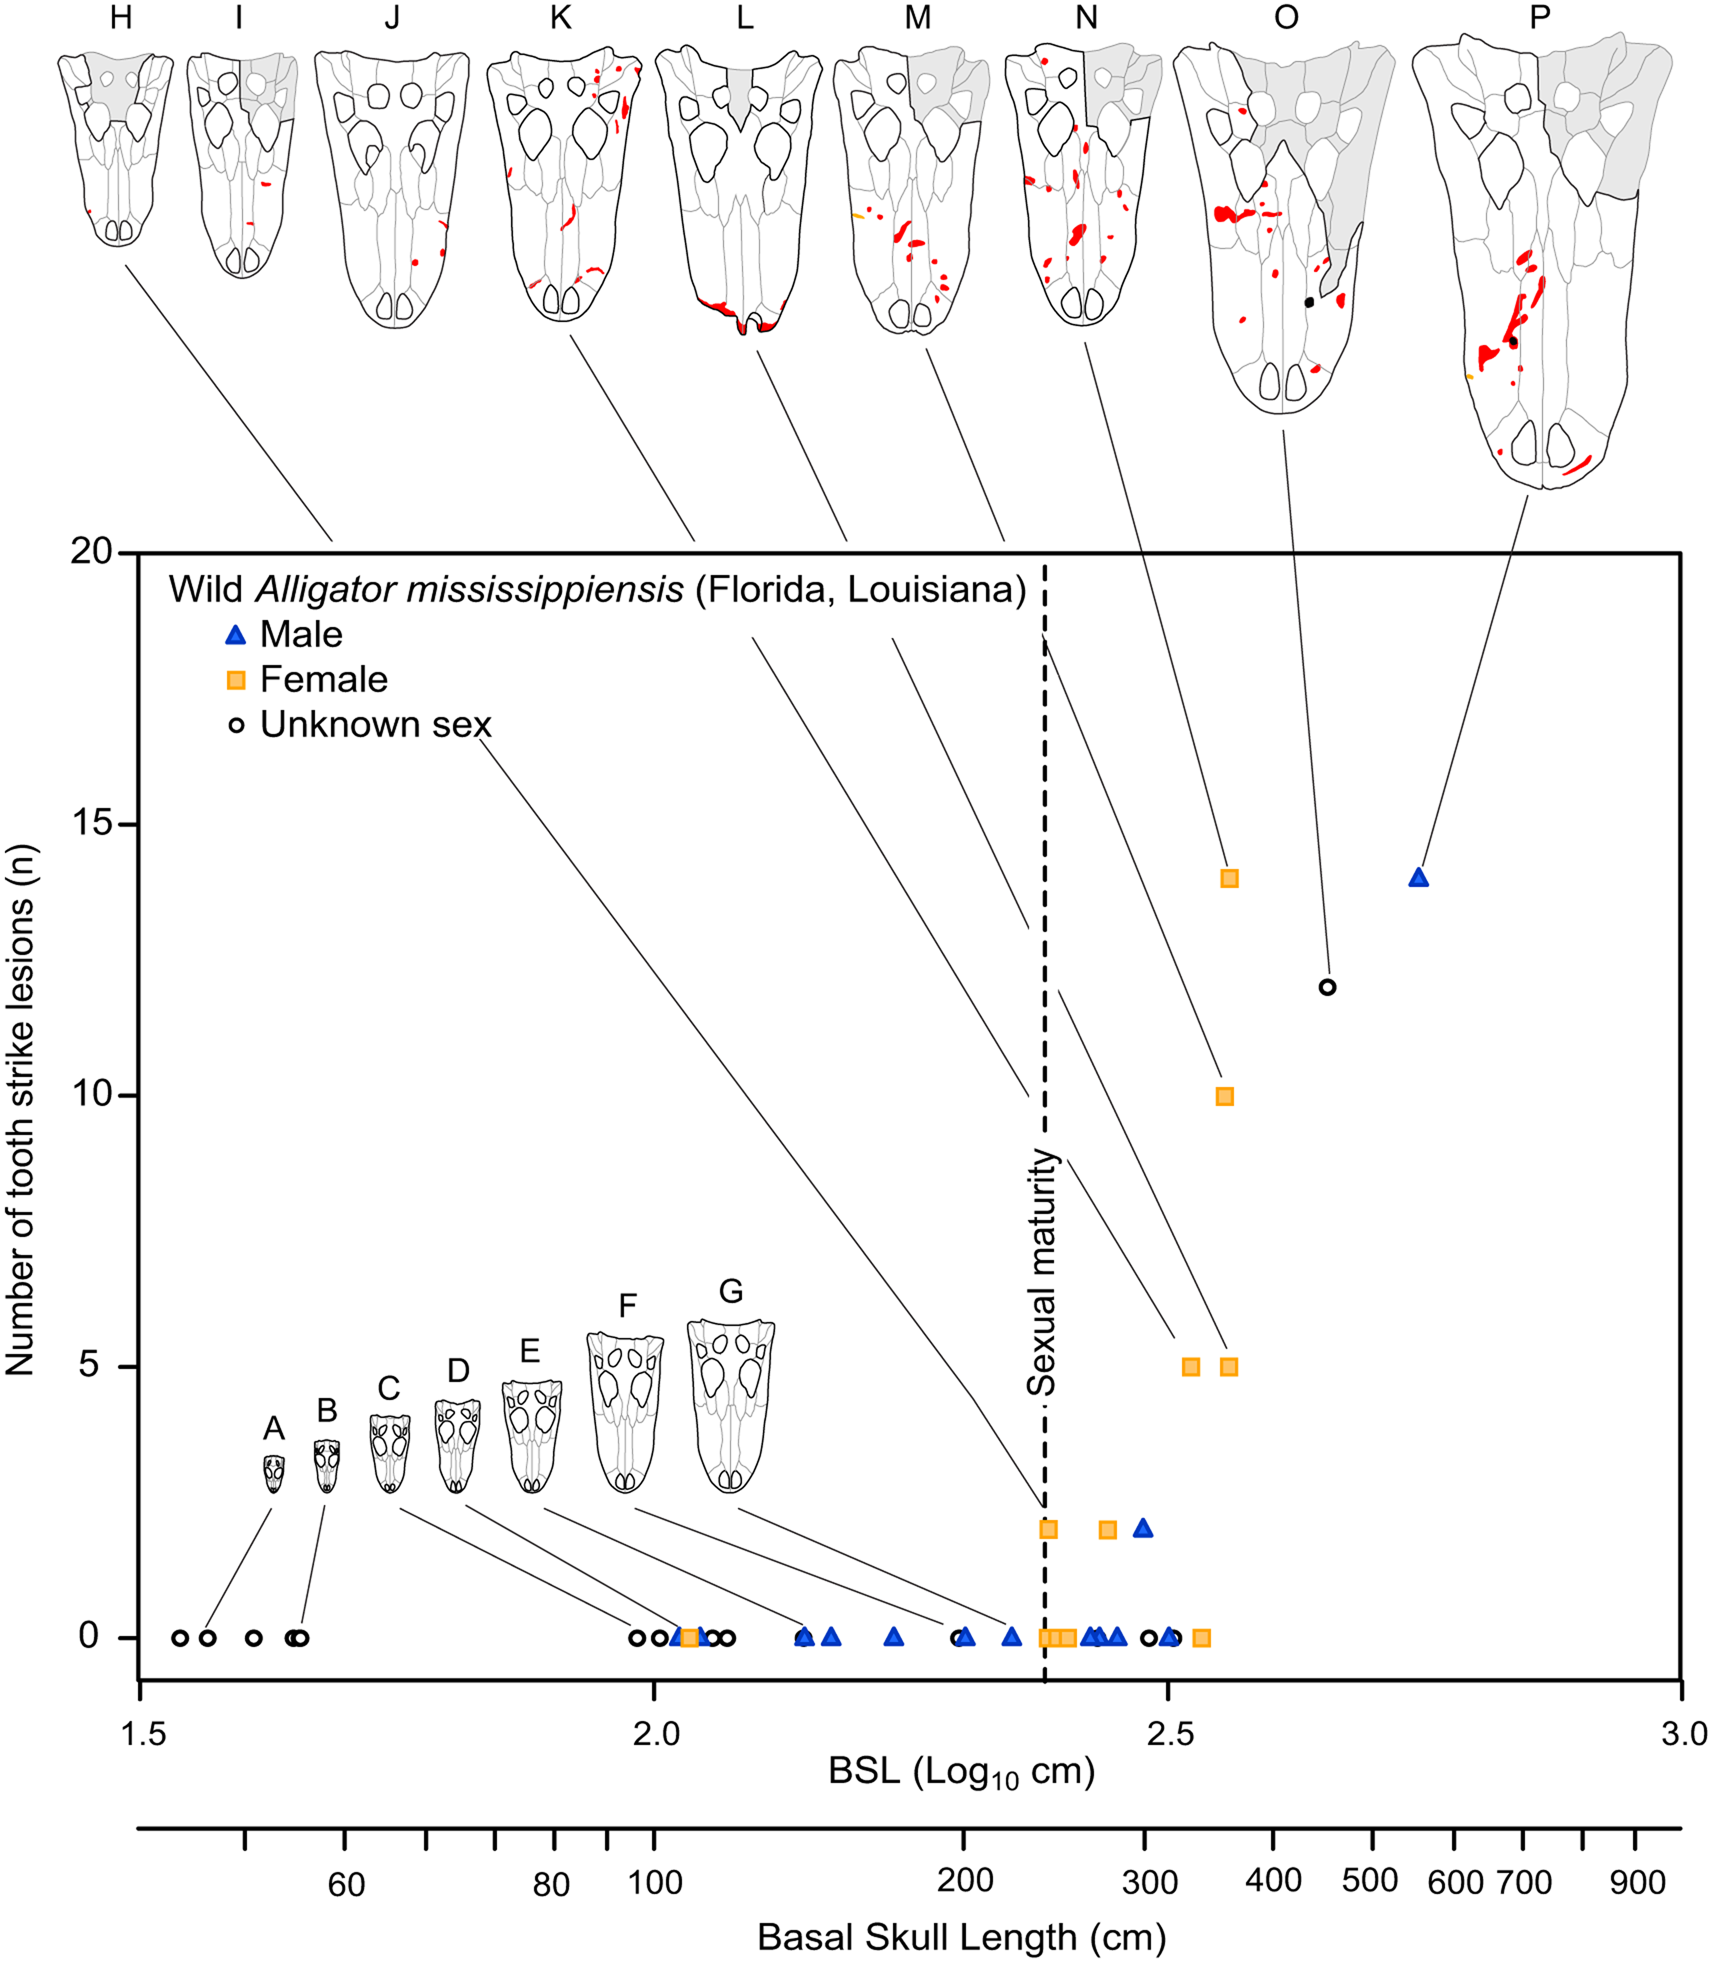
Figure 10. Graph showing number of tooth-strike lesions per specimen of Alligator mississippiensis, as a function of skull size (basal skull length). Vertical dotted line indicates sexual maturity in Alligator (Florida) at 1.82 m (240 mm BSL). Specimens: A, ROM R 7965; B, ROM R 6253; C, ROM R 0008; D, ROM R 8352; E, ROM R 8355; F, ROM R 8335; G, ROM R 8332; H, ROM R 8334; I, ROM R 8331; J, ROM R 4422; K, ROM R 4416; L, ROM R 8343; M, ROM R 8327; N, ROM R 8326; O, ROM R 494; P, ROM R 8324.
Additionally, the ontogenetic acquisition of intraspecific bite marks/injuries across a variety of extant analogs also shows patterns similar to both the tyrannosaurid and A. mississippiensis sample, including Intellagama lesueurii (Fig. 11A,B) (Baird et al. Reference Baird, Baird and Shine2012), Chelydra serpentina (Fig. 11C) (Keevil et al. Reference Keevil, Hewitt, Brooks and Litzgus2017), Ursus maritimus (Fig. 11D) (Ramsay and Stirling Reference Ramsay and Stirling1986), Monodon monoceros (Fig. 11E) (Gerson and Hickie Reference Gerson and Hickie1985), and Haliaeetus albicilla (Fig. 11F) (Müller et al. Reference Müller, Altenkamp and Brunnberg2007). Comparable ontogenetic and/or sex-based rate data on intraspecific injuries in extant birds are more limited. Intraspecific combat in birds (often, but not exclusively male–male intrasexual combat) has been documented across many bird groups but is perhaps most prominent in the kicking and/or talon-based combat seen in ratites (Glatz Reference Glatz, Glatz, Lunam and Malecki2011) and raptors (Simmons and Mendelsohn Reference Simmons and Mendelsohn1993; Hunt et al. Reference Hunt, Dunlop and Lockhart2021). While keratin is a softer tissue than bone, the ability of claws of living animals to damage bone surface has been demonstrated experimentally (Rothschild et al. Reference Rothschild, Bryant, Hubbard, Tuxhorn, Kilgore, Martin and Naples2013). Although we believe the vast majority of the lesions in tyrannosaurs were likely caused by intraspecific face biting, the possibility of claw-induced injuries as a potential cause cannot be ruled out.
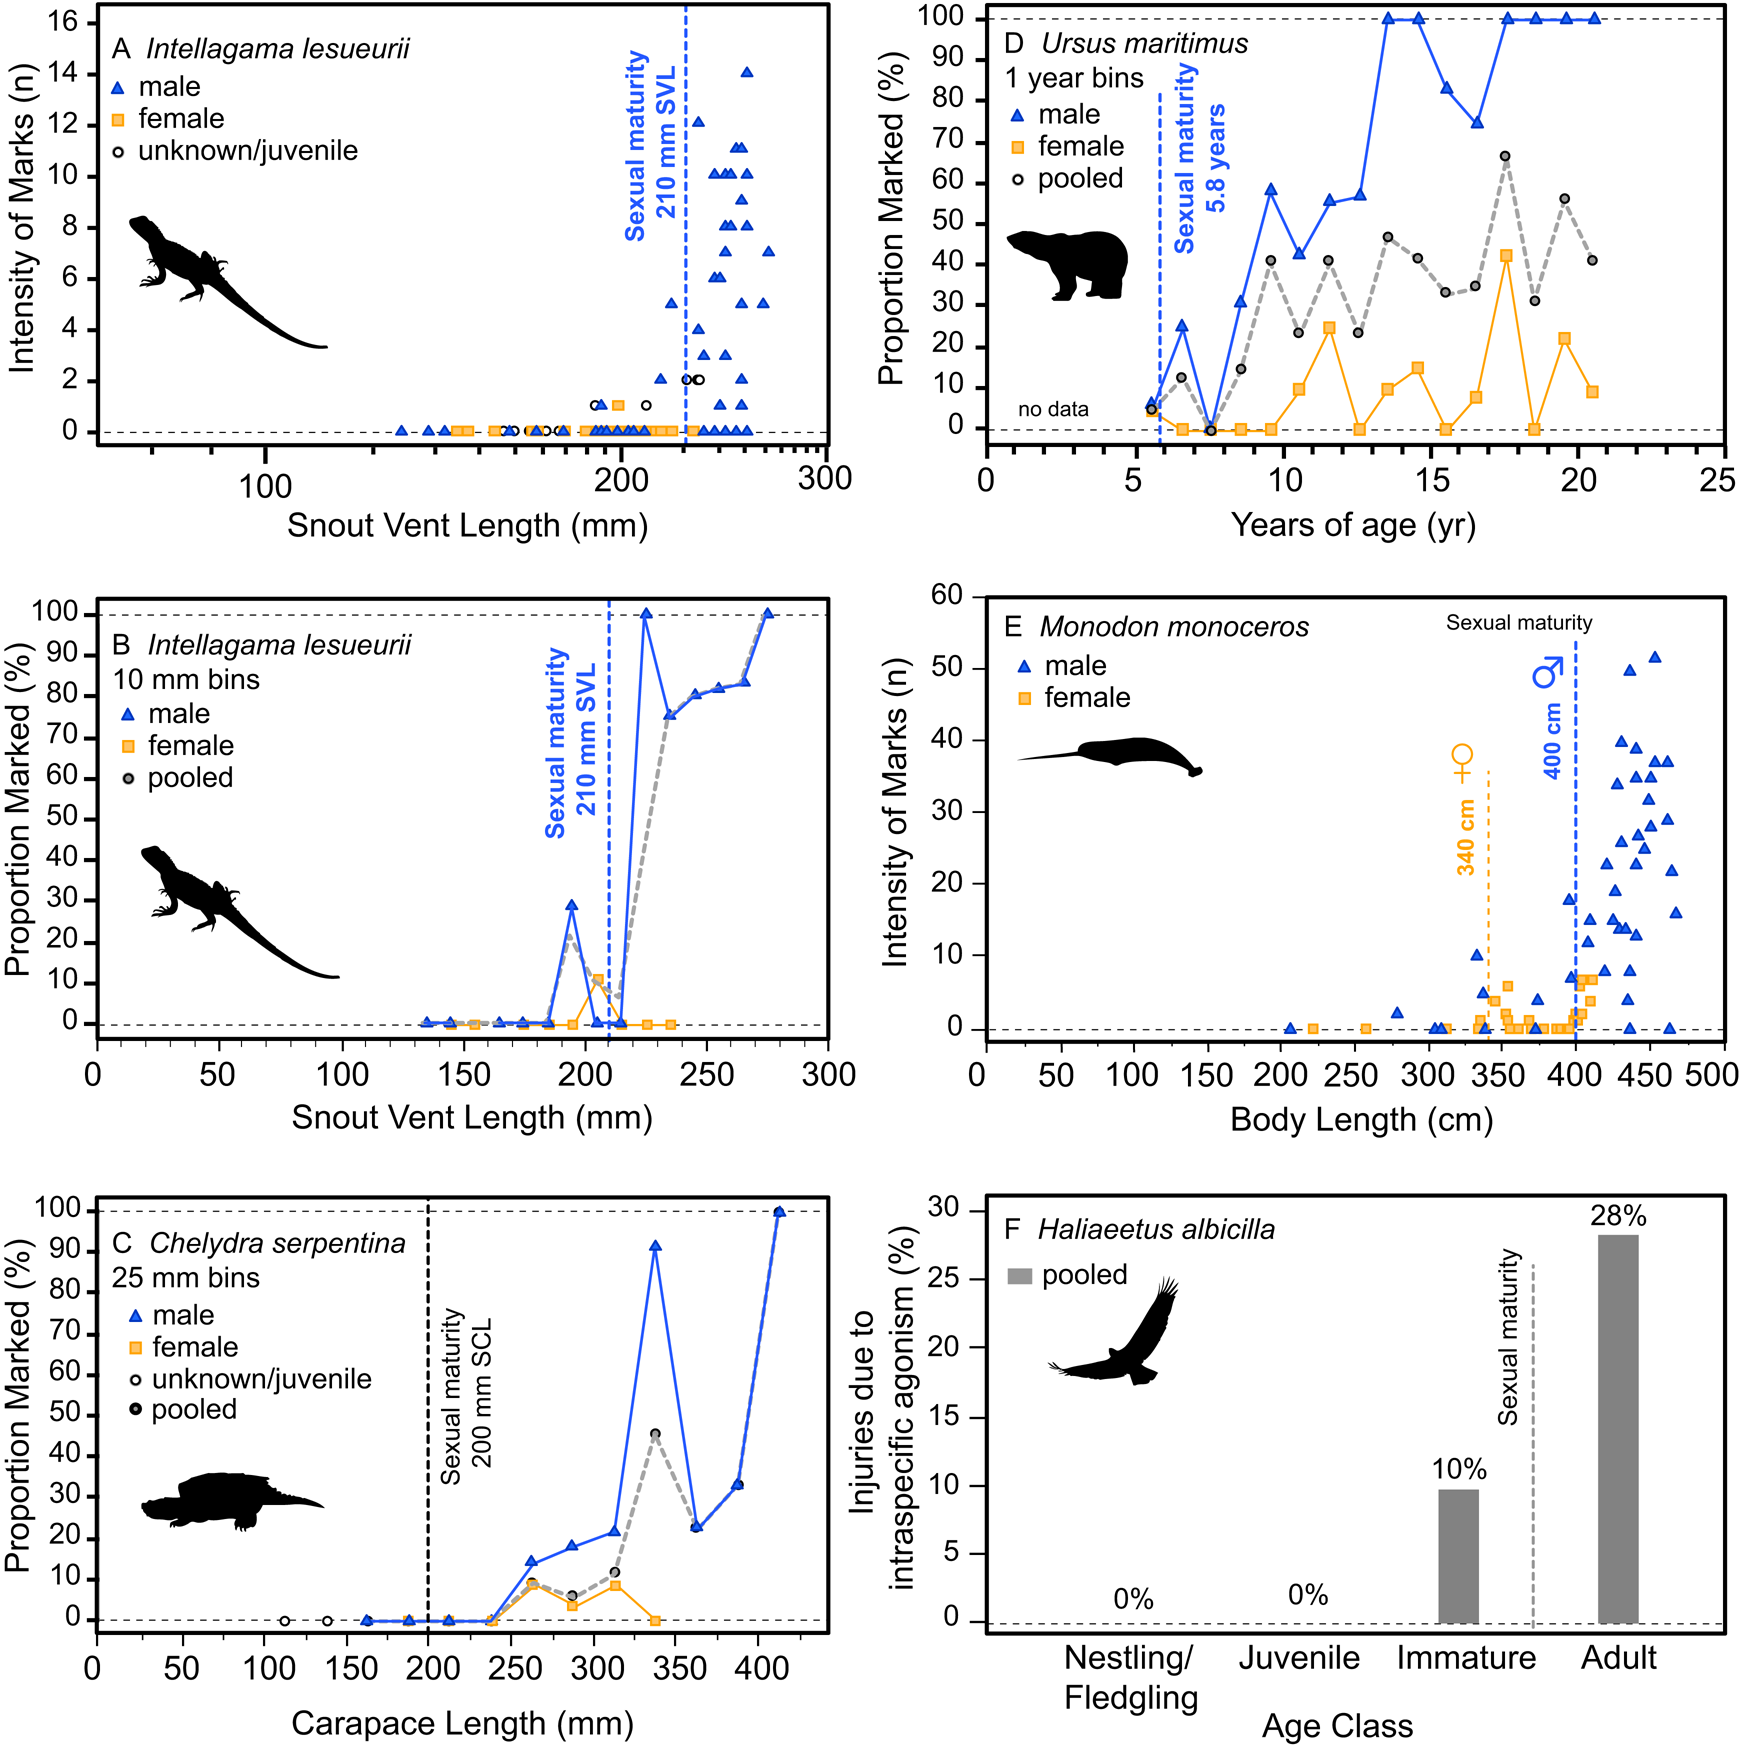
Figure 11. Ontogenetic and sex-specific bite-mark frequency for several modern analogs. The agamid lizard Intellagama lesueurii (formerly Physignathus lesueurii) is shown for both intensity, i.e., count, data (A) and proportion data (B) across body size, the chelydrid Chelydra serpentina is shown with proportion data (C) across body size, the polar bear Ursus maritimus is shown with proportion data (D) across age, the narwhal Monodon monoceros is shown for intensity data (E) across size, and the avian raptor Haliaeetus albicilla across age classes (F) (intraspecific mortality, not bite marks). Vertical dotted line indicates approximate age/size of sexual maturity.
Finally, the size of the lesions and, in some cases, the spacing between serial lesions in tyrannosaurids indicates they were made by animals possessing large, well-spaced teeth in powerful jaws. Of the potential sympatric carnivorous taxa (i.e., dromaeosaurids, troodontids, crocodylians) that lived during the Late Cretaceous of North America, all are too small to be responsible for all but the smallest bite marks seen in the tyrannosaurid dataset. Consequently, the most parsimonious interpretation of the evidence presented in this study is that the lesions observed on the tyrannosaurid bones are the result of bites produced by conspecifics to which the victim survived.
Intraspecific Face Biting in Tyrannosaurids
Several hypothetical models of lesion frequency and intensity through ontogeny were developed to visualize the patterns expected under certain size- and sex-specific aggressive behaviors within a population (see Supplementary Information, Supplementary Figs. S8, S9). The model that most closely matches the ontogenetic distribution of lesions in tyrannosaurids suggests that intraspecific aggression occurred in three phases: (1) absence of intraspecific aggression at a young age/small size; (2) a distinct size/age threshold (~50% of maximum skull length), after which intraspecific aggression becomes common; and (3) a continuation, but not an increase in frequency, of that behavior through the remaining life history of the animal.
Based on the data presented in this study and comparisons with extant reptiles, some aspects of the intraspecific face biting in tyrannosaurids can be reconstructed. The consistency of the location, orientation, and polarity of the lesions across specimens indicates that the most likely scenario of agonistic behavior involved two individuals squaring off, with each individual attempting to seize the adversary's skull or lower jaw between its jaws. The maxillary teeth of the aggressor would either squarely contact the dorsal surface of the victim's skull, leaving circular puncture lesions on the nasal or dorsal maxilla, or land glancing blows across the lateral surface of the maxilla, causing elongate scars with ventral polarity. Similarly, the dentary teeth of the aggressor would either squarely contact the ventral margin of the lower jaw, producing circular puncture lesions, or land glancing blows across the lateral surface of the lower jaw, causing elongate scars with dorsal polarity. Given the high density of lesions on the lateral surfaces of the centers of the maxilla and dentary relative to the few lesions seen on the premaxilla and nasal (Fig. 5), and the fact that serial lesions are largely aligned with the long axis of the skull (e.g., TMP 1967.009.0164, 2003.045.0084; Supplementary Dataset S1) the most likely relative positions of the two animals is with their heads positioned side by side (lateral to each other), with the bites being delivered with lateral swings of the head (Fig. 12). Furthermore, the consistency in the arcing posteroventral path of the elongate scars on the lateral maxillae of several specimens (American Museum of Natural History 5664, CMN 12063, TMP 1998.125.0001, 1999.033.00001, 2000.012.0011, 2017.012.0002, ROM 1247; Supplementary Dataset S1) may indicate the two opponent's heads were facing opposite directions (Fig. 12).

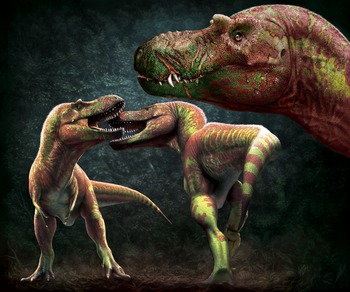
Figure 12. Artistic reconstructions of hypothesized intraspecific agonism (face-biting behavior) in Tyrannosauridae. Left, Two Gorgosaurus individuals square off in face-biting behavior. Right, The aftermath of face-biting behavior, showing recent wounds and older scars, in left lateral view. Art by Julius T. Csotonyi.
Broadly comparable face-biting behavior is commonly observed in a variety of extant animals, including salamanders (e.g., Hynobius [Park et al. Reference Park, Park and Yang1996], Plethodon [Anthony et al. Reference Anthony, Jaeger and Wicknick1997]), squamates (e.g., Anolis [Greenberg and Noble Reference Greenberg and Noble1944; Greenberc Reference Greenberc1977]), and crocodylians (e.g., A. mississippiensis [Brien et al. Reference Brien, Lang, Webb, Stevenson and Christian2013]), generally proceeded by postural and/or visual threat displays (ritualized aggression). Similar ritualized postural and/or visual threat displays may also have preceded face biting in tyrannosaurs. Similarity and isometric scaling of serial bite marks indicate these contests were largely between similar-sized individuals, rarely between opponents of different size, consistent with experiments in some birds that show that adult male aggressors avoid juveniles (McDonald et al. Reference McDonald, Clay, Brumfield and Braun2001; Stein and Uy Reference Stein and Uy2006).
One interpretation of the spectrum in lesion textures (i.e., incised and porous vs. smooth or raised) is that this represents a coarsely defined healing gradient, with the incised and porous lesions being less healed (possibly more recent), and the smoother, flush, or raised scars being further along in the healing process (possibly older). The ontogenetic distribution of lesions (and the ratio of incised and porous vs. smooth or raised) suggests the face-biting behavior first began in individuals at approximately one-half maximum skull size, reached a sustained frequency of ~60% of individuals, and persisted through adulthood. Given that the overwhelming majority of tooth-strike lesions show extensive healing, we can suggest that these intraspecific contests were generally nonfatal. The reason for the instigation of the face-biting behavior is unknown, but could be related to contests for territory, resources, or mates; establishing a dominance hierarchy; or courtship rituals.
Intraspecific Face Biting and Sexual Maturity
Injuries derived from intraspecific aggression in extant animals often show a strong correlation with body size and age. While in some cases the onset of these injuries can be gradual and may represent the attritional accumulation of injuries throughout life, many taxa show a distinct onset where intraspecific injuries increase dramatically, which is often strongly correlated with the body size or age at sexual maturity (Figs. 10, 11). This pattern is seen across a broad phylogenetic range, such as in the crocodylian A. mississippiensis (Fig. 10), the agamid lizard I. lesueurii (Baird et al. Reference Baird, Baird and Shine2012) (Fig. 11A,B), the chelydrid turtle C. serpentina (Keevil et al. Reference Keevil, Hewitt, Brooks and Litzgus2017) (Fig. 11C), the polar bear U. maritimus (Ramsay and Stirling Reference Ramsay and Stirling1986) (Fig. 11D), the narwhal M. monoceros (Gerson and Hickie Reference Gerson and Hickie1985) (Fig. 11E), and the sea eagle H. albicilla (Müller et al. Reference Müller, Altenkamp and Brunnberg2007) (Fig. 11F), including both solitary (e.g., Chelydra, Intellagama, Ursus) and social (e.g., Monodon) animals.
Intraspecific aggression behavior in tyrannosaurids is first observed in individuals that reached ~50% of maximum skull length (Gorgosaurus TMP 2009.012.0014 [48.6%] and TMP 2016.014.0001 [48.9%], Albertosaurus TMP 1999.050.0040 [54.6%]). Given the distinct ontogenetic or size threshold at which bite marks are acquired in multiple species of Tyrannosauridae, the onset of sexual maturity as a causal factor for intraspecific aggression is a reasonable hypothesis. Under such a hypothesis, face biting could have been related to courtship rituals, dominance assertion, or territoriality.
To determine the timing of the onset of intraspecific aggression in tyrannosaurids, the two smallest specimens bearing tooth-strike lesions (TMP 2009.012.0014 [femur length = 556 mm] and TMP 2016.014.0001 [femur length = 537 mm]) were plotted on published growth curves by Erickson and colleagues (Reference Erickson, Makovicky, Currie, Norell, Yerby and Brochu2004, Reference Erickson, Currie, Inouye and Winn2010). Based on their femoral lengths, these juvenile Gorgosaurus have an estimated age of around 6 years and occur at the phase of growth where annual increases in femur length slow (Eberth and Currie Reference Eberth and Currie2010), indicative of a decreasing growth rate and consistent with previous interpretations of the onset of sexual maturity in dinosaurs (Lee and Werning Reference Lee and Werning2008), but not all agree (Prondvai Reference Prondvai2017). Although arguments have been published regarding the validity of these tyrannosaurid growth curves (Eberth and Currie Reference Eberth and Currie2010; Myhrvold Reference Myhrvold2013), future work refining these curves will allow for testing the hypothesis that this onset of the face-biting behavior corresponds with an inflection point or decrease in growth rate that may indicate sexual maturity.
Previous work on an immature specimen of Tyrannosaurus rex bearing healed/partially healed tooth-strike lesions (BMRP 2002.4.1) suggested that this specimen was younger than the estimated age of sexual maturity and, consequently, excluded sexual display and courtship as potential behavioral explanations for the intraspecific aggression (Peterson et al. Reference Peterson, Henderson, Scherer and Vittore2009). However, more recent work has revised the estimated age from 11 (Erickson Reference Erickson2005) to 13 (Woodward et al. Reference Woodward, Tremaine, Williams, Zanno, Horner and Myhrvold2020) years, more in line with the estimated point of sexual maturity in T. rex (Carr Reference Carr2020). Carr (Reference Carr2020) also noted that sexual maturity is often reached at approximately one-half adult size in extant archosaurs and suggested that BMRP 2002.4.1 may represent the stage for the earliest onset of sexual maturity in T. rex. This specimen exhibits abundant, partially healed lesions, and supports the putative correlation between the onset of face-biting behavior and the onset of sexual maturity once individuals attained ~50% of adult size, as suggested here for Albertosaurus and Gorgosaurus. This is not to suggest that these individuals are actively competing with full-sized individuals, as the size of the aggressor and victim are linked. Rather, this may reflect a behavior similar to practice bouts for individuals that are sexually mature but unlikely to be successful against full-grown opponents.
On the Validity of Using Face-Bite Lesions as Sex Indicators in Tyrannosaurids
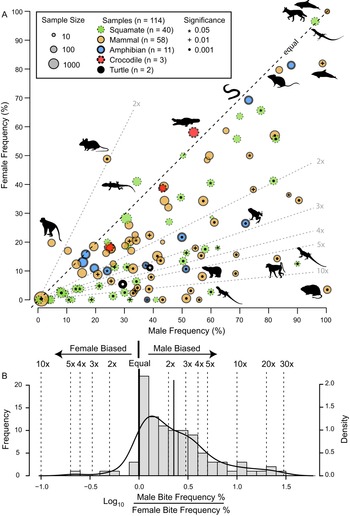
The frequency of intraspecific injuries is often distinct between males and females of the same species/population. Most often, males exhibit higher rates of intraspecific injuries than females as a result of male–male intrasexual aggression. A literature review of the occurrence of intraspecific bite marks in extant taxa (Supplementary Information, Supplementary Dataset S5) shows a pervasive and phylogenetically widespread pattern of higher incidence in males than in females (Fig. 13). Despite this widespread pattern of higher intraspecific injuries in males, some groups show the opposite pattern (i.e., higher injury rate in females), especially in species with extreme or reverse sexual size dimorphism (Le Boeuf and Mesnick Reference Le Boeuf and Mesnick1991), or in cases of courtship rituals and/or copulatory bites (Carpenter Reference Carpenter1961, Reference Carpenter1962; Klimley Reference Klimley1980). This is less common than male-biased scars, and most copulatory bites do not result in major injury (but see Carrick et al. Reference Carrick, Csordas and Ingham1962; Le Boeuf and Mesnick Reference Le Boeuf and Mesnick1991). However, in some species, this pattern is pervasive enough to identify individuals that are both female and sexually mature/multiparae based on scars alone (Springer Reference Springer1960; Pratt Reference Pratt1979; McCann Reference McCann1982).
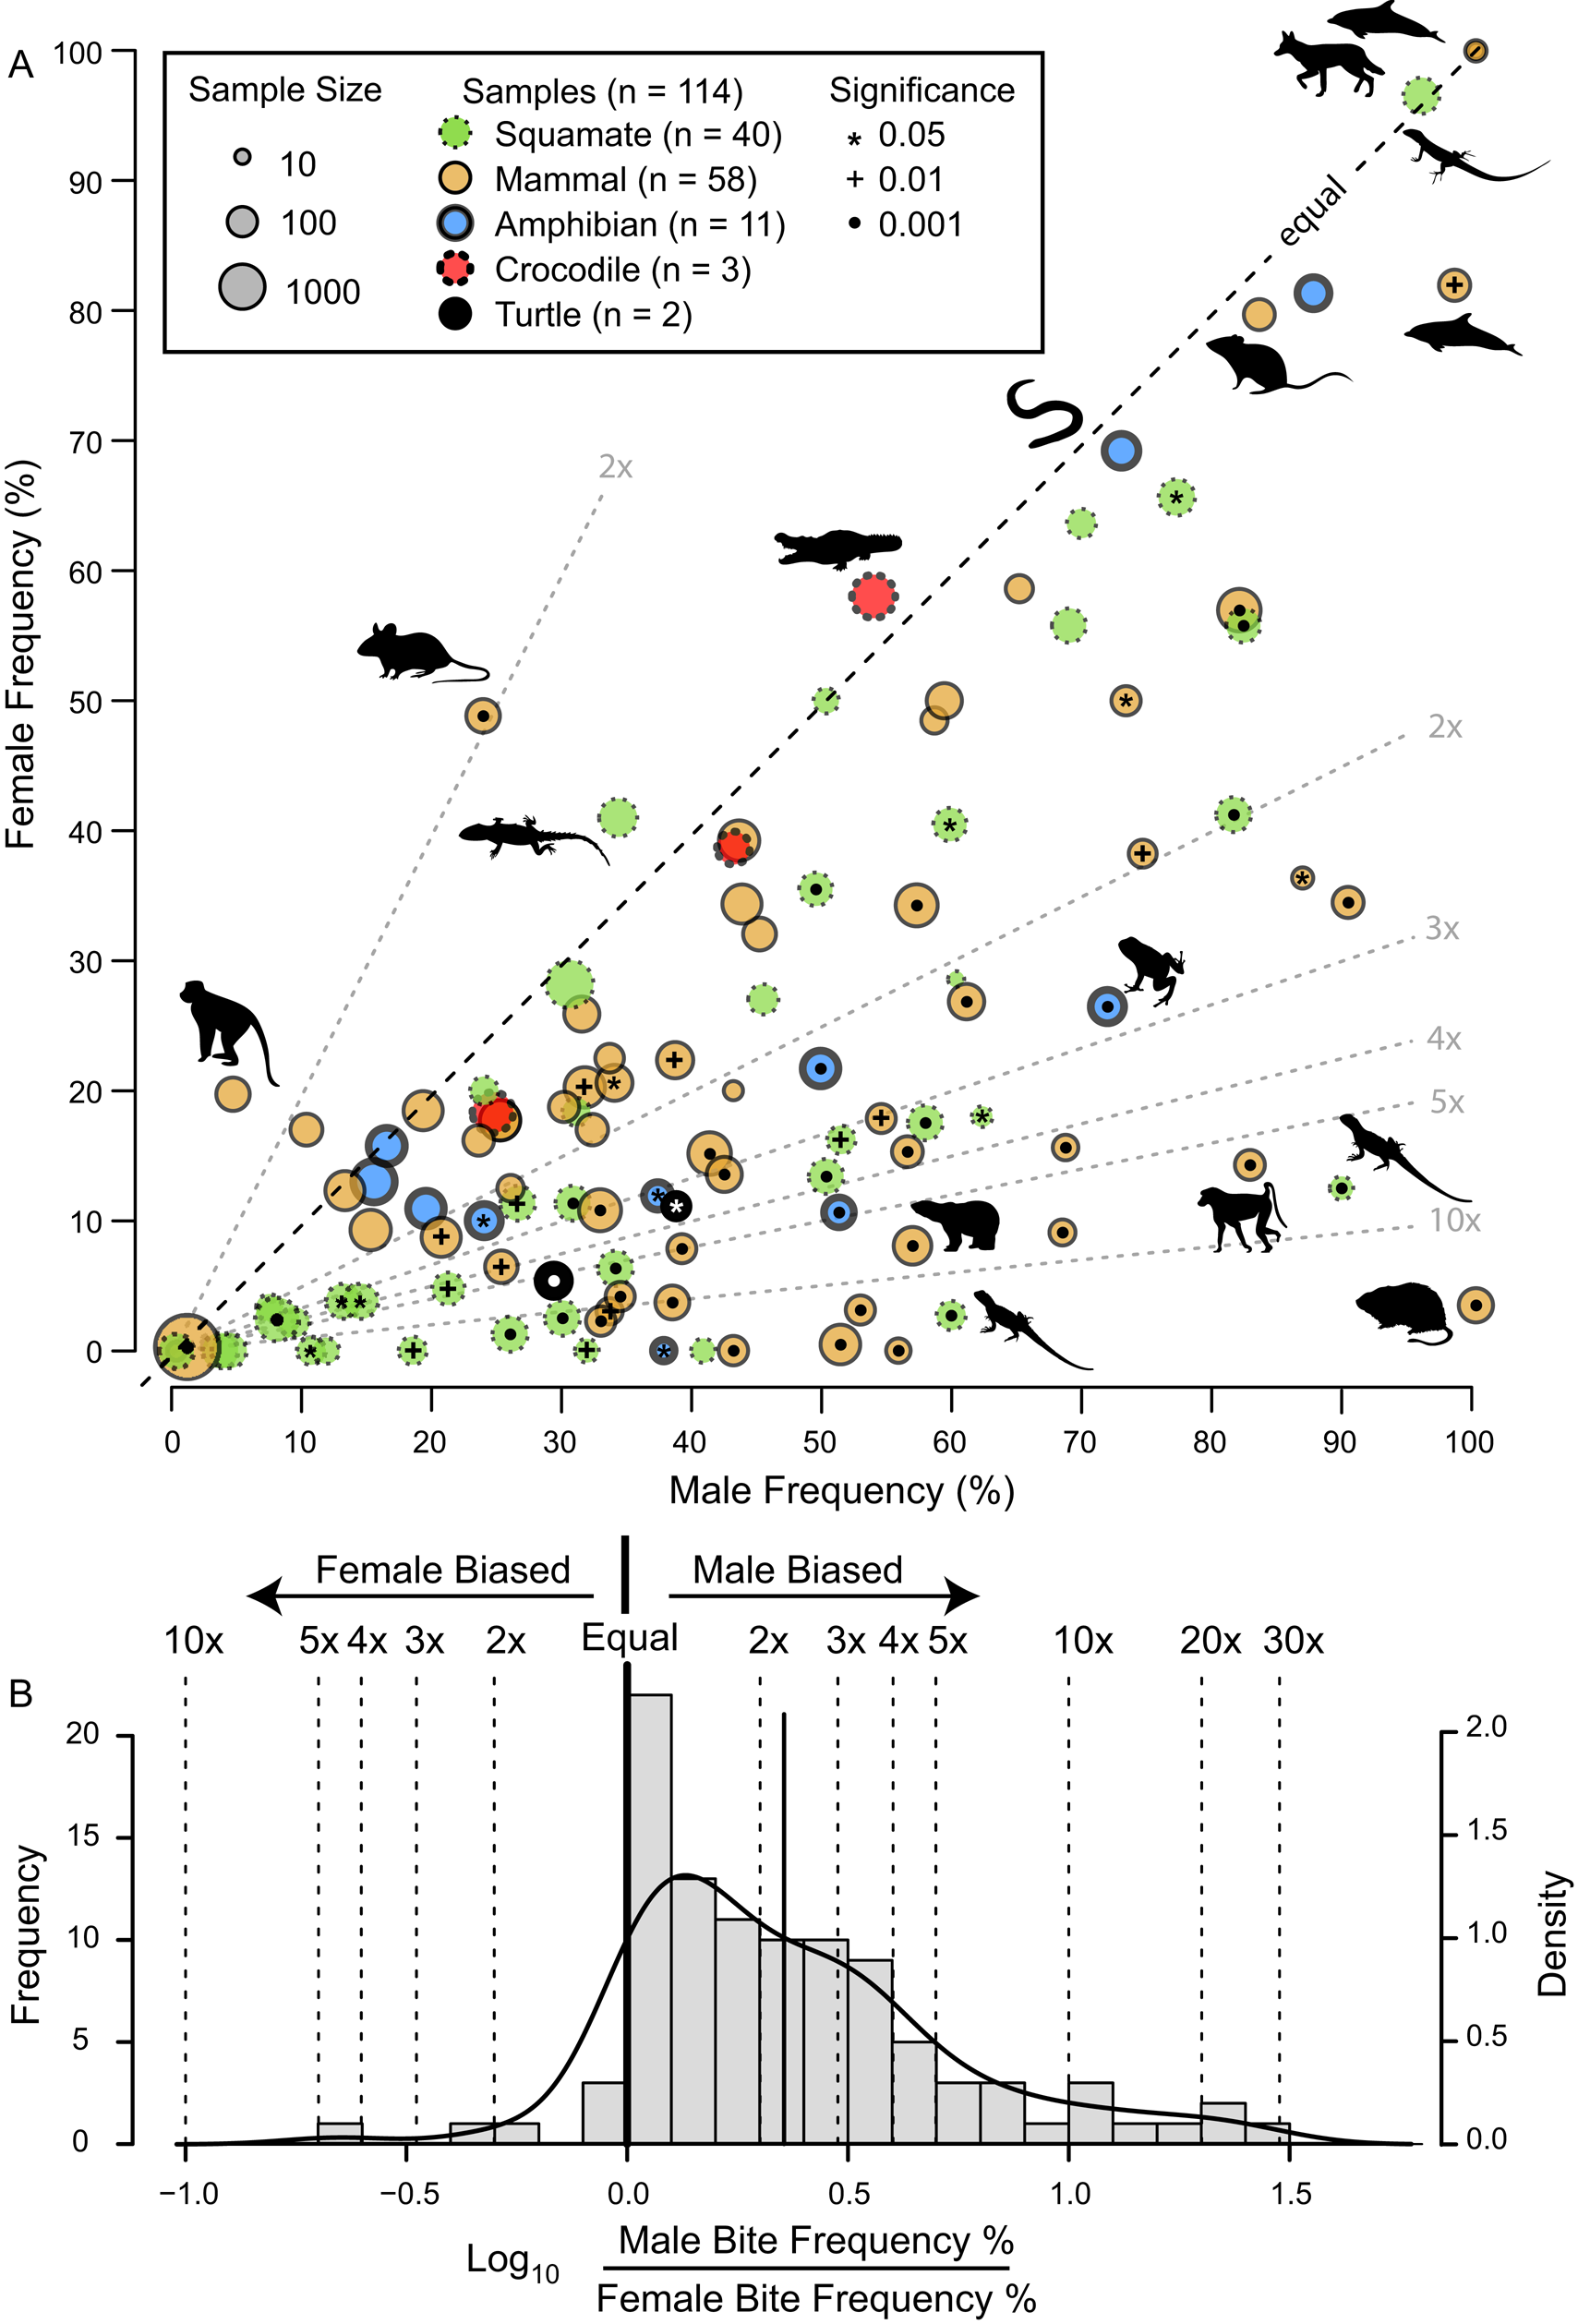
Figure 13. A, Scatter plot contrasting male and female intraspecific bite/tooth-mark frequency in a sample of living tetrapods. Each dot represents a dataset. Circle color indicates taxonomy, while circle size represents sample size. Symbols within circles indicate significance level for differences between male and female bite-mark frequency (chi-squared test). Select data points show taxon silhouette. Diagonal dotted lines indicated magnitude differences in frequency between the two sexes. B, Histogram of the difference between male and female bite/tooth-mark frequencies, showing male bias. (Color online.)
Given the sexual skew (generally male) in the bite-mark record, it is worth investigating whether the occurrence of intraspecific bite marks in Tyrannosauridae could be used as a sexual indicator, specifically that heavily scarred individuals are more likely to be male.
The proportion of adult-sized individuals with intraspecific bite lesions is consistently around 60% (in the total dataset and in all genus- and site-specific subsets), which is consistent with the overall pattern of adult sex ratio (proportion male) in extant birds and crocodylians, clades that phylogenetically bracket non-avian dinosaurs (Supplementary Fig. S10, Supplementary Information, Supplementary Dataset S7). Therefore, the proportion data are at least consistent with a sexual hypothesis.
Although the pattern of higher bite marks in males than females is phylogenetically widespread (Fig. 13), it is not a 1:1 correlation with sex (i.e., it is not fully dichotomous), and inferring sex based only on scars in non-avian dinosaurs is problematic for several reasons. First, only in a few cases (5% of the extant datasets) does the proportion of male individuals of a given species showing injuries exceed 90%, and females of these species often have high bite-mark frequencies. Second, while injury rates in female individuals are nearly always lower than in male individuals, they are rarely zero (only in 10% of datasets). Finally, of these extant species, those most closely related to non-avian dinosaurs (i.e., crocodylians) show the weakest male bias (Fig. 13A), with the small sample of A. mississippiensis skulls showing a female bias (Fig. 10). Consequently, without comparisons with other independent lines of evidence, confident sex identification in tyrannosaurids cannot be accomplished through the presence/absence of intraspecific bite marks alone. Independent methods of determining sex, such as medullary bone (Schweitzer et al. Reference Schweitzer, Wittmeyer and Horner2005, Reference Schweitzer, Zheng, Zanno, Werning and Sugiyama2016; Lee and Werning Reference Lee and Werning2008; Prondvai Reference Prondvai2017), may allow for testing the hypothesis that the presence of interspecific bite lesions could be used as a sex indicator in Tyrannosauridae.
Implications for the Evolution of Intraspecific Aggressive Behavior in Archosauria
Healed and partially healed intraspecific bite-mark lesions are phylogenetically widespread in Theropoda (Fig. 14, Supplementary Fig. S1, Supplementary Dataset S8). Taxa with these lesions include basal taxa, such as Herrerasaurus from the Late Triassic of South America; large-bodied theropods from the Jurassic of Asia and North America, such as Allosaurus, Monolophosaurus, and Sinraptor; large carcharodontosaurids from the Early to middle Cretaceous of Africa and North America (Acrocanthosaurus, Carcharodontosaurus); and tyrannosaurids from the Late Cretaceous of North America and Asia (see Supplementary Materials). Rather than representing an independent evolution of the behavior in several different lineages, intraspecific face-biting behavior may be plesiomorphic for Theropoda. Testing this hypothesis is difficult, as the results of character tracing across the phylogeny largely depend on whether the less well-sampled taxa lacking bite marks are scored as “unknown” or “bite marks absent” (Supplementary Fig. S11). The presence of bite marks implies aggressive behavior, but the absence of bite marks does not necessarily reflect nonaggressive behavior, especially with small, incomplete, or poorly preserved samples. The sample required to confidently (i.e., with 95% confidence) conclude a lack of intraspecific tooth marks scales with the population frequency of these marks (i.e., five scorable specimens are needed at 50% frequency, 11 specimens at 25%, and 29 specimens at 10%). Many taxa are known from fewer specimens than these thresholds, and few of these have been examined specifically for healed bite marks, limiting the ability to score many taxa as “absent.”
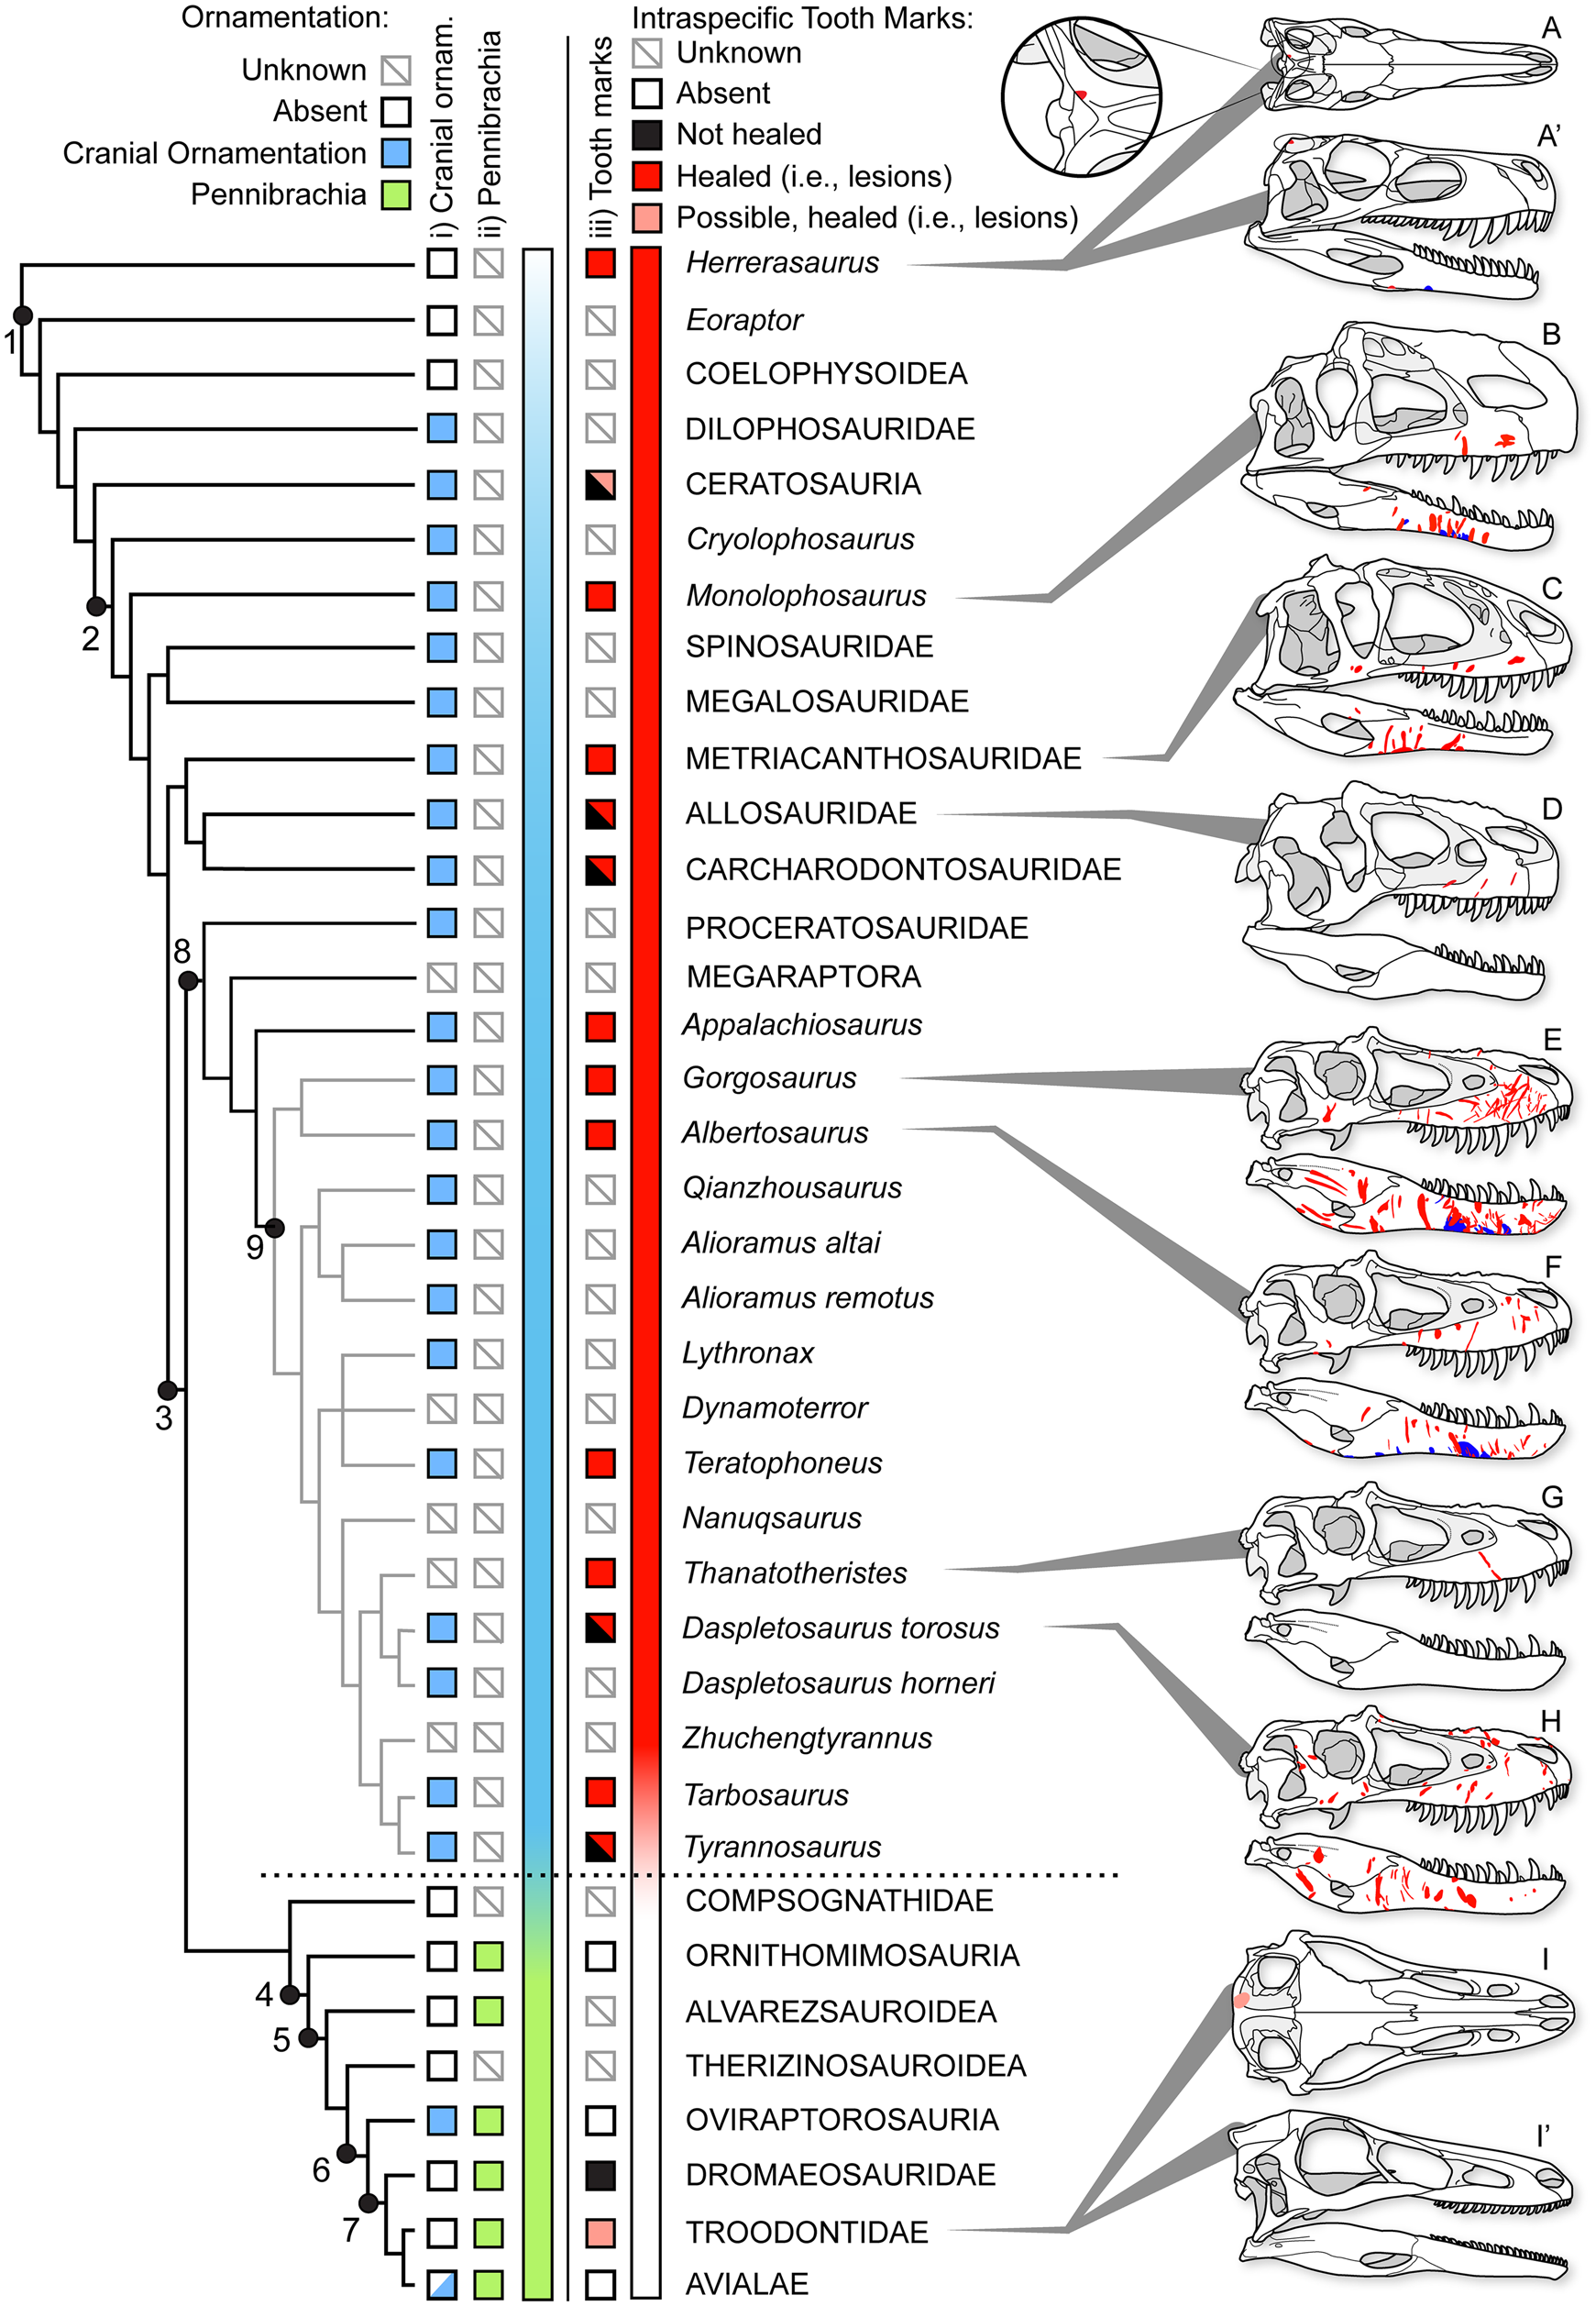
Figure 14. Phylogeny of Theropoda showing the known occurrence of bony cranial ornamentation (column i), pennibrachia (column ii), and intraspecific bite marks (column iii) across major clades and Tyrannosauridae. Box fill color indicates: gray = unknown, white = absent, blue (i) = cranial ornamentation present, green (ii) = pennibrachia present, black (iii) = unhealed (consistent with predation/cannibalism), red (iii) = healed or partial healed tooth-strike lesions (consistent with intraspecific face-biting behavior), pink (iii) = putative/possible healed or partial healed tooth-strike lesions. Skulls on right show the occurrence of bite-mark lesions on specimens (A–D, H) or composites for multiple specimens (E–G), in right lateral and occasional dorsal (′) views. A and A′, Herrerasaurus ischigualastensis (PVSJ 407); B, Monolophosaurus jiangi (IVPP 84019); C, Sinraptor dongi (IVPP 10600); D, Allosaurus fragilis (ROM 49503); E, Gorgosaurus libratus (28 specimens); F, Albertosaurus sarcophagus (15 specimens); G, Thanatotheristes degrootorum (TMP 2010.005.0007); H, Daspletosaurus sp. (9 specimens); I and I′, Stenonychosaurus inequalis (TMP1979.008.0001). On skulls, red indicates visible externally (i.e., lateral), while blue is visible internally (i.e., medial). Phylogeny simplified from Hendrickx et al. (Reference Hendrickx, Hartman and Mateus2015), with Tyrannosauridae expanded following Voris et al. (Reference Voris, Therrien, Zelenitsky and Brown2020). Coding for cranial ornamentation and shafted feathers/pennibrachia follows Gates et al. (Reference Gates, Organ and Zanno2016) and Zelenitsky et al. (Reference Zelenitsky, Therrien, Erickson, DeBuhr, Kobayashi, Eberth and Hadfield2012). Numbered clades: (1) Theropoda, (2) Tetanurae, (3) Coelurosauria, (4) Maniraptoriformes, (5) Maniraptora, (6) Pennaraptora, (7) Paraves, (8) Tyrannosauroidea, (9) Tyrannosauridae.
There may also be a correlation between large body size and the presence of tooth-strike lesions. Nearly all theropod radiations leading to large-bodied (i.e., >1000 kg) predators display bite marks, with Megalosauridae and Spinosauridae being exceptions (Fig. 14). Conversely, few small-bodied animals (with the exception of Herrerasaurus and subadult tyrannosaurids) show the presence of bite marks. This may represent a true reflection of the occurrence of the behavior (i.e., it has evolved multiple times in large taxa), it may reflect that large taxa are more able to inflict serious injuries to bones (Supplementary Information), or it may represent a sampling bias, whereby larger taxa are represented by a better fossil record than small taxa and therefore have a higher chance of lesions being observed (Supplementary Information). As a result, it is difficult to quantitatively test the phylogenetic origins of face-biting behavior in theropods.
Furthermore, given the occurrence of very similar patterns in facial lesion distribution and frequency within a broad sample of both modern (Cott Reference Cott1961; Webb and Messel Reference Webb and Messel1977; Gorzula Reference Gorzula1978; Webb et al. Reference Webb, Manolis and Buckworth1983) and fossil (Mackness and Sutton Reference Mackness and Sutton2000; Avilla et al. Reference Avilla, Fernandes and Ramos2004; Martin Reference Martin2013) Neosuchia, the origin of the face-biting behavior could predate Theropoda and be more deeply nested within Archosauria. A detailed investigation of the distribution of facial lesions in extinct archosaurs would be required to test this hypothesis. Interestingly, evidence of healed and partially healed intraspecific bite marks is lost, or greatly reduced, in clades more closely related to birds (maniraptoriforms plus Compsognathidae) than to Tyrannosauridae (Fig. 14). No evidence of healed intraspecific bite marks is seen in Alvarezsauroidea, Compsognathidae, Therizinosauroidea, or toothed members of Ornithomimosauria and Oviraptorosauria. Among Deinonychosauria, a single troodontid specimen exhibits a cranial lesion, but its dramatically distinctive position has led it to be interpreted as a cyst (Currie Reference Currie1985). Within Dromaeosauridae, two specimens show bite marks, but neither shows evidence of healing (Norell et al. Reference Norell, Gaffney and Dingus1995; Jacobsen Reference Jacobsen, Tanke and Carpenter2001), suggesting they may be the result of predation or scavenging rather than intraspecific combat, with one being interpreted as the result of interspecific scavenging by a tyrannosaurid (Jacobsen Reference Jacobsen, Tanke and Carpenter2001). Given that the number of healed lesions greatly exceeds the number of unhealed bite marks in tyrannosaurids, the presence of unhealed bite marks in dromaeosaurids most likely reflects cases of peri- or postmortem predation rather than intraspecific aggression.
The absence of cranial bite-mark lesions indicative of intraspecific aggression in theropod clades crownward of Tyrannosauroidea may suggest that face biting ceased to be a common behavior and is potentially tied to several major evolutionary trends associated with the emergence of Aves (Dececchi and Larsson Reference Dececchi and Larsson2013; Benson et al. Reference Benson, Campione, Carrano, Mannion, Sullivan, Upchurch and Evans2014; Lee et al. Reference Lee, Naish and Dyke2014). Of note, the disappearance of physical injuries associated with intraspecific aggression coincides with a documented change in intraspecific display structures through phylogeny, from osseous cranial ornamentation in non-maniraptoriform theropods to its replacement by visual displays largely formed by feathers in maniraptoriform theropods (Hone et al. Reference Hone, Naish and Cuthill2011; Zelenitsky et al. Reference Zelenitsky, Therrien, Erickson, DeBuhr, Kobayashi, Eberth and Hadfield2012; Gates et al. Reference Gates, Organ and Zanno2016). The change in intraspecific aggressive behavior and display strategies documented in theropods may therefore mark a transition in sociosexual behavior in dinosaurs leading to birds. Basal theropods, including Allosauroidea, Monolophosaurus, and Tyrannosauridae, may have practiced a more crocodile- or lizard-like sociosexual behavior, with high rates of intraspecific (intrasexual?) aggression resulting in frequent and severe bite marks. With the evolution of more complex and pennaceous feathers before the evolution of flight (Zelenitsky et al. Reference Zelenitsky, Therrien, Erickson, DeBuhr, Kobayashi, Eberth and Hadfield2012), maniraptoriforms may have adopted a more bird-like sociosexual behavior, with high reliance on visual feather-based displays tied to intersexual selection and female mate choice, and with lower incidence of severe intrasexual aggression.
It should be noted that several aspects of the maniraptoran body plan, such as proportionally smaller heads, weaker bites, and reduced teeth (Zanno and Makovicky Reference Zanno and Makovicky2011), as well as reduced body size (Benson et al. Reference Benson, Campione, Carrano, Mannion, Sullivan, Upchurch and Evans2014, Reference Benson, Hunt, Carrano and Campione2018), likely imposed limitations on the ability to engage in face-biting behavior that would leave significant traces on bones. Extant avian intraspecific aggression is often characterized by aspects of eye pecking and feather plucking, as well as kicking, grasping, and pinning with the feet and beating with wings (Smith and Hosking Reference Smith and Hosking1955; Simmons and Mendelsohn Reference Simmons and Mendelsohn1993; Glatz Reference Glatz, Glatz, Lunam and Malecki2011). These activities are less likely to leave traces of injuries on bone than face biting and therefore are less detectable in the fossil record (but see Bartosiewicz and Gál Reference Bartosiewicz and Gál2008). Hence a loss of evidence for bite lesions in maniraptoriform skulls does not necessarily indicate a decrease in intraspecific aggression. Instead, it may represent a change in the form of aggression, from face biting seen in large-bodied theropods and extant crocodylians to more avian-like combat in Maniraptoriformes.
Acknowledgments
The authors are grateful to D. Brinkman, T. Cullen, D. Eberth, J. Gardner, J. Mallon, L. O'Brien, M. Powers, D. Tanke, and J. Voris for fruitful discussions and suggestions about the research topic. Collection access and assistance were provided by M. Currie, J. Mallon, and K. Shepherd (CMN); D. Evans and K. Seymour (ROM); T. Courtenay, H. Feeney, R. Russell, R. Sanchez, and B. Strilisky (RTMP); and C. Coy and H. Gibbins (UALVP). D. Brinkman assisted with ammonium chloride coating for photography. I. Macdonald found, and A. Kilmury prepared, TMP 2017.012.0002, which prompted the research project. Countless staff and volunteers have helped to assemble the collection analyzed here. T. Baird provided raw scar frequency data for Intellagama lesueurii. D. Hone, L. Zanno, and an anonymous reviewer, as well as N. Campione (associate editor) and N. Froebisch (editor) provided constructive feedback that greatly improved the paper.
Artwork for Figure 12 was produced by J. T. Csotonyi. Taxon silhouettes used in Figures 11 and 13 were obtained from Phylopic (http://phylopic.org) under Public Domain Dedication 1.0 license, Creative Commons Attribution-ShareAlike 3.0 Unported license (https://creativecommons.org/licenses/by-sa/3.0/), with images scaled and reflected and some details removed. Art by A. Caravaggi, A. van der Geer, O. Jones, T. A. Heath, Ron Holmes, T. Michael Keesey, C. Huh, B. Reinke, M. Scroggie, A. Slavenko, N. Tamura, S. Traver, N. Vitek, and “An Ignorant Atheist.” Silhouette for Chelydra serpentina was modified from Babcock (1919). Funding was provided by the Royal Tyrrell Museum and Royal Tyrrell Museum Cooperating Society.
Data Availability Statement
Data available from the Dryad Digital Repository: https://doi.org/10.5061/dryad.zpc866t8n


 Open access