

I. INTRODUCTION
Environmental or occupational exposure to dispersed powders can pose a health risk if inhaled. Typically, an airborne powder or dust cloud is characterized with respect to its health impact by considering the concentration and size distribution of the constituent particles. Three size regimes are considered (see ISO 7708, 1995): inhalable, thoracic, and respirable. The inhaled fraction is that part which can pass into the nose and mouth. The thoracic part is that fraction which can penetrate beyond the larynx; and finally, the respirable fraction is that part which can enter the lungs and penetrate into the unciliated airways where it remains. It is this respirable fraction that poses a health risk, causing silicosis, an irreversible pneumoconiosis. For cristobalite powder, the Occupational Safety and Health Administration (OSHA) defines the respirable size range as between 10 µm and ~2 µm. The determination is made from the mass fraction of powder passing a size selector such that no particles with an aerodynamic diameter of 10 µm pass the selector and 90% of particles with a diameter of 2 µm pass through. That actual size selection profile is given in Table Z-3 of the U.S. Department of Labor (2015). The measurement of the respirable fraction of any dust sample may be made using the National Institute for Occupational Safety and Health (NIOSH) Analytical Method 7500 (Eller and Cassinelli, Reference Eller and Cassinelli1994). This method relies on a comparison of X-ray diffraction data from material filtered from the dust to that of a standard material of know phase purity. As noted in the text of this method: “Calibration standards are limited to National Institute of Standards and Technology (NIST) and US Geological Survey (USGS) certified standards of known purity, particle size, and sample-to-sample homogeneity”.
Standard Reference Material (SRM) 1879b is designed for this purpose and was certified for phase purity using the experimental design described in Cline et al. (Reference Cline, Von Dreele, Winburn, Stephens and Filliben2011). It is based on the fact that the diffraction experiment is sensitive only to the mass of the crystalline part of the material and cannot account for the amorphous surface layer that exists in all finely divided powders. A weighing operation, on the other hand, includes the entire mass. If a known mass of an internal standard of known phase purity is mixed with a known mass of the sample, then the discrepancy between this mass fraction and that determined from the diffraction experiment indicates the amorphous content of the sample. Therefore, to quantify the amorphous content in unknowns requires an accurate mass determination, a standard of known phase purity, i.e., NIST SRM 676a (2012) and an accurate diffraction experiment. In order to assess the systematic errors of the diffraction experiment, multiple techniques are employed. Laboratory X-ray diffraction is not considered as biases of several percents are observed even when the effects of microabsorption and extinction are known to be minimized. Owing to the minimal absorption of neutrons because of the specimen attenuation, neutron powder diffraction provides data that are essentially free of the biases observed with laboratory X-ray data. We utilize two neutron diffraction geometries, time-of-flight (TOF) and constant wavelength (CW) powder diffraction; in both geometries, the specimen is in the form of a cylinder. With these two data sets, a valid assessment of systematic errors can be realized with a quantitative comparison of results.
II. SAMPLE PREPARATION
The feedstock for SRM 1879b was prepared with a high-temperature anneal of vitreous silica performed by Pyromatics Corp., Willoughby, OH (Certain commercial equipment, instruments, or materials are identified in order to adequately specify the experimental procedure. Such identification does not imply recommendation or endorsement by the NIST, nor does it imply that the materials or equipment identified are necessarily the best available for the purpose.) The starting material had a purity > 99.995% (by weight), with < 25 parts per million alkalies. It was annealed at 1600 °C in a furnace that allowed for insertion of the SRM material at the operating temperature and under an inert gas atmosphere. The material was annealed for 2 h after the furnace had re-equilibrated to the 1600 °C temperature, at which point the furnace was powered down and allowed to cool. The resulting high porosity sintered form was processed in a jaw crusher and jet milled to a median particle size of 3.5 µm. The jet milling was performed by Hosokawa Micron Powder Systems, Summit, NJ. The disordered, amorphous surface region of the powder was preferentially dissolved with a wash in hydrofluoric acid. Additional contaminants were removed with a second wash in hydrochloric acid. The powder was then rinsed several times in distilled water and ignited at 500 °C. These treatments were performed by MV Laboratories, Inc., Frenchtown, NJ. The powder was then bottled under argon by the NIST Standard Reference Material Program (SRMP).
Approximately 1.5 kg of feedstock powder was apportioned into 275, 5-g units by spin-riffling at NIST. Ten bottles of SRM 1879b were selected during this operation using stratified random sampling and ten bottles of SRM 676a were acquired from the NIST Office of Reference Materials. Twenty samples of a nominal 50:50 mass ratio of SRM 1879b to SRM 676a were prepared as described in Cline et al. (Reference Cline, Von Dreele, Winburn, Stephens and Filliben2011) using two samples of 1 g each from each bottle, with the pairings of SRM1879b and SRM676a selected at random. The weighing process had an estimated uncertainty of ±20 µg in each mass, which in turn leads to an uncertainty in prepared mass ratios that is significantly less than that from the X-ray measurements. A second set of five pure specimens of SRM 1879b were prepared for the measurement of certified lattice parameters. Five samples were also prepared for neutron diffraction analysis. These samples consisted of 4 g of material, 1 g from each of two bottles of SRM 1879b, and 1 g from each of two bottles of SRM 676a, also paired at random and prepared according to the procedure in Cline et al. (Reference Cline, Von Dreele, Winburn, Stephens and Filliben2011). These samples were homogenized in a mortar and pestle.
III. EXPERIMENTAL
A. Procedure for phase purity measurement
The certification for phase purity was performed using the neutron TOF powder diffraction facility POWGEN at the Spallation Neutron Source (SNS), Oak Ridge National Laboratory (ORNL) (Huq et al., Reference Huq, Hodges, Gourdon and Heroux2011). CW neutron data were obtained on the BT1 High-Resolution Powder Diffractometer located at the NIST Center for Neutron Research (NCNR) (NIST 2018). SRM 676a, which is certified with respect to amorphous content, was used as the internal standard (Cline et al., Reference Cline, Von Dreele, Winburn, Stephens and Filliben2011; SRM 676a 2012).
For the TOF measurement, approximately 3 g of sample were loaded in 8 mm diameter vanadium cans. Data were collected using a 0.1 nm band centered on a wavelength of 0.1333 nm at 300 K. This resulted in diffraction patterns with d-spacing ranging from 0.04 to 0.53 nm. The data were collected for 3 beam hours at an accelerator power of 850 kW. For the CW neutron data, samples were contained in cylindrical vanadium cans of 12.4 mm diameter by 50 mm high. Data were collected for ~14 h at a wavelength of 0.11969 nm produced by the [733] reflection from a Ge monochromator with a collimation of 60′, 30′, and 7′, before the monochromator, sample, and detectors, respectively, with a 120° take-off angle yielding a d-spacing range of 0.06–0.56 nm. The sample run order was randomized on an informal basis.
B. Measurement of lattice parameters and verification of homogeneity
X-ray powder diffraction data were collected on a NIST-built diffractometer that includes several advanced design features. A full discussion of this machine, its alignment and calibration can be found in Cline et al. (Reference Cline, Mendenhall, Black, Windover and Henins2015). The optical layout is that of a conventional divergent-beam diffractometer of Bragg–Brentano geometry. The machine is designed such that it can be interchanged between several optical configurations. Two were used for analysis of SRM 1879b. The first consisted of a conventional CuKα source and linear Si-strip position-sensitive detector (PSD). The second utilized a Johansson incident beam monochromator (IBM) and PSD. Data analyses were performed with the fundamental parameters approach (FPA) (Cheary and Coelho, Reference Cheary and Coelho1992) for line profile modeling in conjunction with the Pawley (Pawley, Reference Pawley1980) and Rietveld methods for analysis of lattice and structural parameters. The homogeneity of SRM 1879b was verified with an analysis of the mass fractions of quartz vs. alumina and the lattice parameters of specimens that consisted of 50–50 mixtures of SRMs 1878b and 676a. Linkage to the International System of Units (SI) (The International System of Units, 2006) is established via the emission spectrum of CuKα radiation employed as the basis for constructing the diffraction profiles. With the use of the FPA, diffraction profiles are modeled as a convolution of functions that describe the wavelength spectrum, the contributions from the diffraction geometry, and the sample contributions resulting from microstructural features. Rigorous analyses of data from this divergent beam diffractometer require knowledge of both the diffraction angle and the effective source–sample–detector distance. Two additional models, specimen displacement in the z-axis and sample attenuation, must therefore be included in the data analyses to account for the factors that affect the distances critical in the use of this geometry. Data were analyzed in the context of both type A uncertainties, assigned by statistical analysis, and type B uncertainties, based on knowledge of the nature of errors in the measurements, to result in the establishment of robust uncertainties for the certified values (Taylor and Kuyatt, Reference Taylor and Kuyatt1994; Guide to the Expression of Uncertainty in Measurement, 2008).
With the conventional X-ray source, the 2.2 kW copper tube of long fine focus geometry was operated at a power of 1.8 kW. With the IBM, the 1.5 kW copper tube of fine focus geometry was operated at a power of 1.2 kW. The variable divergence incident slit was set to 0.9°. A 1.5° Soller slit was located in front of the PSD window to limit axial divergence, no Soller slit was used in the incident beam for either configuration. The scan time was ~2.5 h. The PSD was scanned in “picture taking” mode wherein data from the full length of the PSD window were recorded. With a window length of 14.4 mm, containing 192 pixels of 75 µm each, and a goniometer radius of 217 mm, this corresponds to a window dimension of 3.8° in 2θ, and an angular resolution of 0.02° in 2θ. Post-data collection processing allows for scaling the PSD window length with tan(θ). The result is a pattern which effectively has variable dwell time, improving statistics for the high-angle reflections, at no cost in resolution [Mendenhall and Cline (Reference Mendenhall and ClineSubmitted)]. With the conventional X-ray source, a nickel filter was included on the PSD entrance window. Samples were spun at 0.5 Hz during data collection. The machine was equipped with an automated anti-scatter slit located above the sample to prevent air scatter of the incident beam from entering the PSD and contributing to the low-angle background. Its height above the specimen varied as αR/(2 cosθ) where α is the full equatorial divergence angle of the incident beam and R the goniometer radius. The data were collected from 18°2θ to 155°2θ. The machine was located within a temperature-controlled laboratory space where the nominal short-range control of temperature was ±0.1 K. The temperature was monitored using two 10 kΩ thermistors with a Hart/Fluke BlackStack system that was calibrated at the NIST temperature calibration facility (Vaughn and Strouse, Reference Vaughn and Strouse2001) to ±0.002 K. The source was equilibrated at operating conditions for at least an hour prior to recording any certification data. The performance of the machine was qualified with the use of NIST SRM 660b (SRM 660b, 2010; Black et al., Reference Black, Windover, Henins, Filliben and Cline2011) and SRM 676a using procedures discussed by Cline et al. (Reference Cline, Mendenhall, Black, Windover and Henins2015).
IV. DATA ANALYSIS
A. Neutron data
The neutron diffraction data were analyzed with a quantitative Rietveld analysis in two global refinements of the five data sets; one refinement for each diffraction method. The analyses of the TOF data were done utilizing TOPAS (Bruker, 2014) while that of the CW was done using General Structure Analysis System (GSAS) (Larson and Von Dreele, Reference Larson and Von Dreele2003). The crystal structure for low cristobalite as reported by O'Keefe and Hyde (Reference O'Keefe and Hyde1976) was used in these analyses. The refined parameters common to both analyses included: scale factors, lattice parameters of SRM 1879b, and structural parameters. With respect to the analysis of TOF data, calibration runs on POWGEN using SRM 660b were used to determine values for DIFC, DIFA and zero, and starting values for terms of the GSAS-style TOF profile function “type-3” (Von Dreele et al., Reference Von Dreele, Jorgensen and Windsor1982), i.e., back-to-back exponentials (α 0, α 1, β 0, β 1) convoluted with a pseudo-Voigt with a d-spacing and (d-spacing)2 dependence. With the analysis of the SRM 1879b/676a mixtures, terms pertaining to an additional pseudo-Voigt size broadening, also with a d-spacing and (d-spacing)2 dependence, were refined. These were constrained across histograms and phases. The lattice parameters of the alumina of SRM 676a were fixed at certified values and the diffractometer constant DIFA was refined. The back-to-back exponential terms α 0, α 1, β 0, and β 1 were also refined, with only small changes from the SRM 660b values; these were constrained with respect to the histograms. The TOF refinement included four terms of a shifted Chebyshev background function. To fit a contribution to the background from diffuse scattering evident at high Q, a second derivative Debye term with a thermal motion correction was used. The starting value of the atomic distance term r was the cristobalite Si–O bond distance of 0.164 nm. The terms of the function were constrained across the histograms while a scale factor was refined independently for each histogram. An absorption term refined to an insignificant value with the analysis of the TOF data. A typical fit to the TOF data is shown in Figure 1.
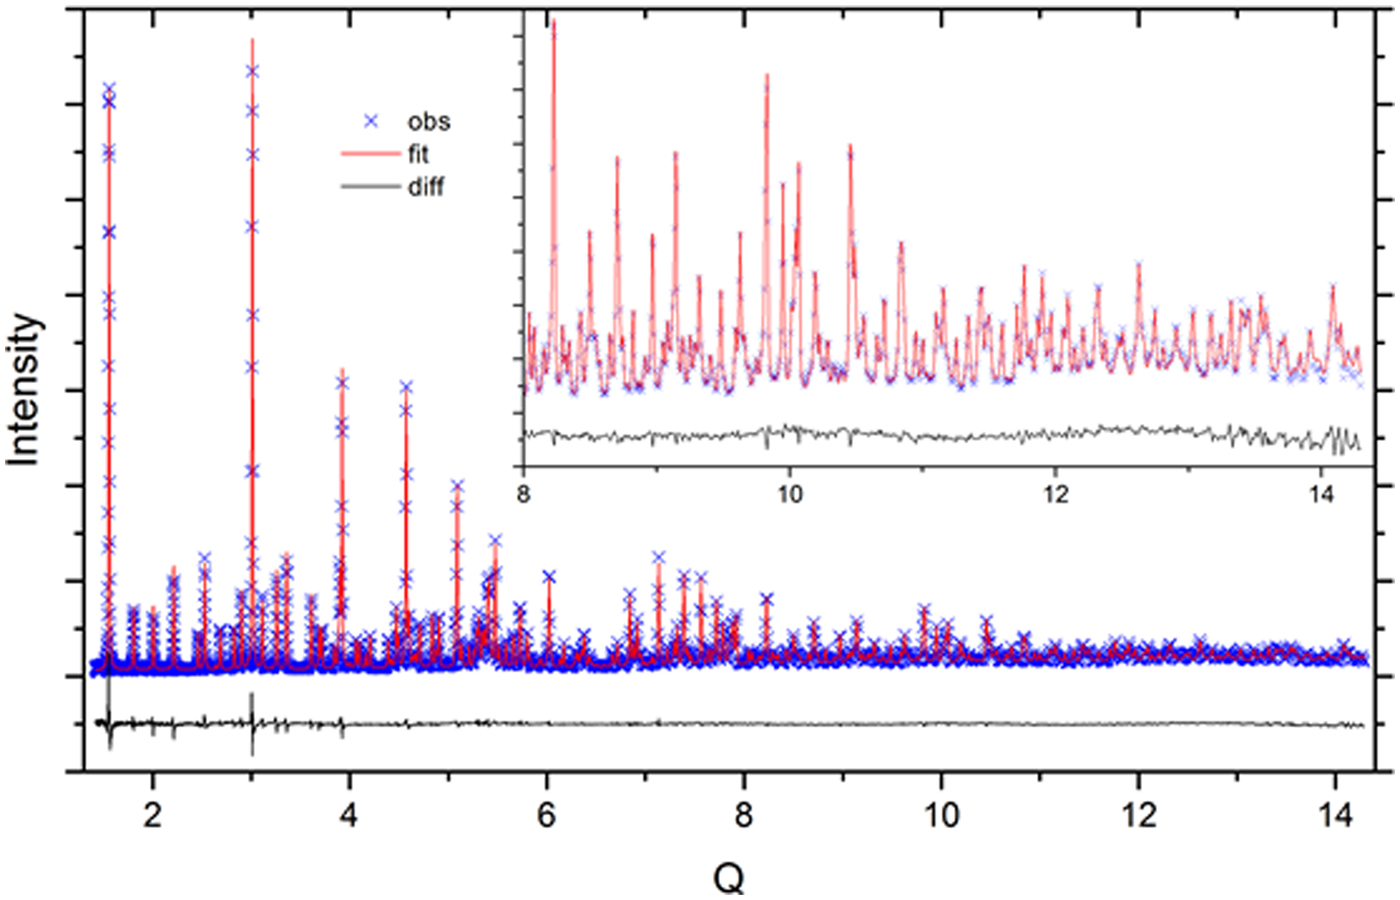
Figure 1. (Color online) Fit quality for a typical Rietveld analysis of the SRM 676a and 1879b mixtures, TOF data.
The CW neutron data were analyzed using the GSAS profile function “type 3” (Thompson et al., Reference Thompson, Cox and Hastings1987). Refined terms included GU, GV, GW, LX, LY, and SL; all were constrained by phase and histogram. The Finger model (Finger et al., Reference Finger, Cox and Jephcoat1994) was used to account for profile asymmetry; however, the S/L and H/L terms are highly correlated, only one term, SL, was refined while the other was fixed at a value nominally identical to the first. Also, given that the lattice parameters of the SRM 676a phase were fixed, the wavelength and zero values were refined. The CW refinement included seven terms of a shifted Chebyshev background function. Absorption was set to zero. A typical fit to the CW data is shown in Figure 2. The refined mass fractions of SRM 676a determined through these analyses are shown in Table 1.
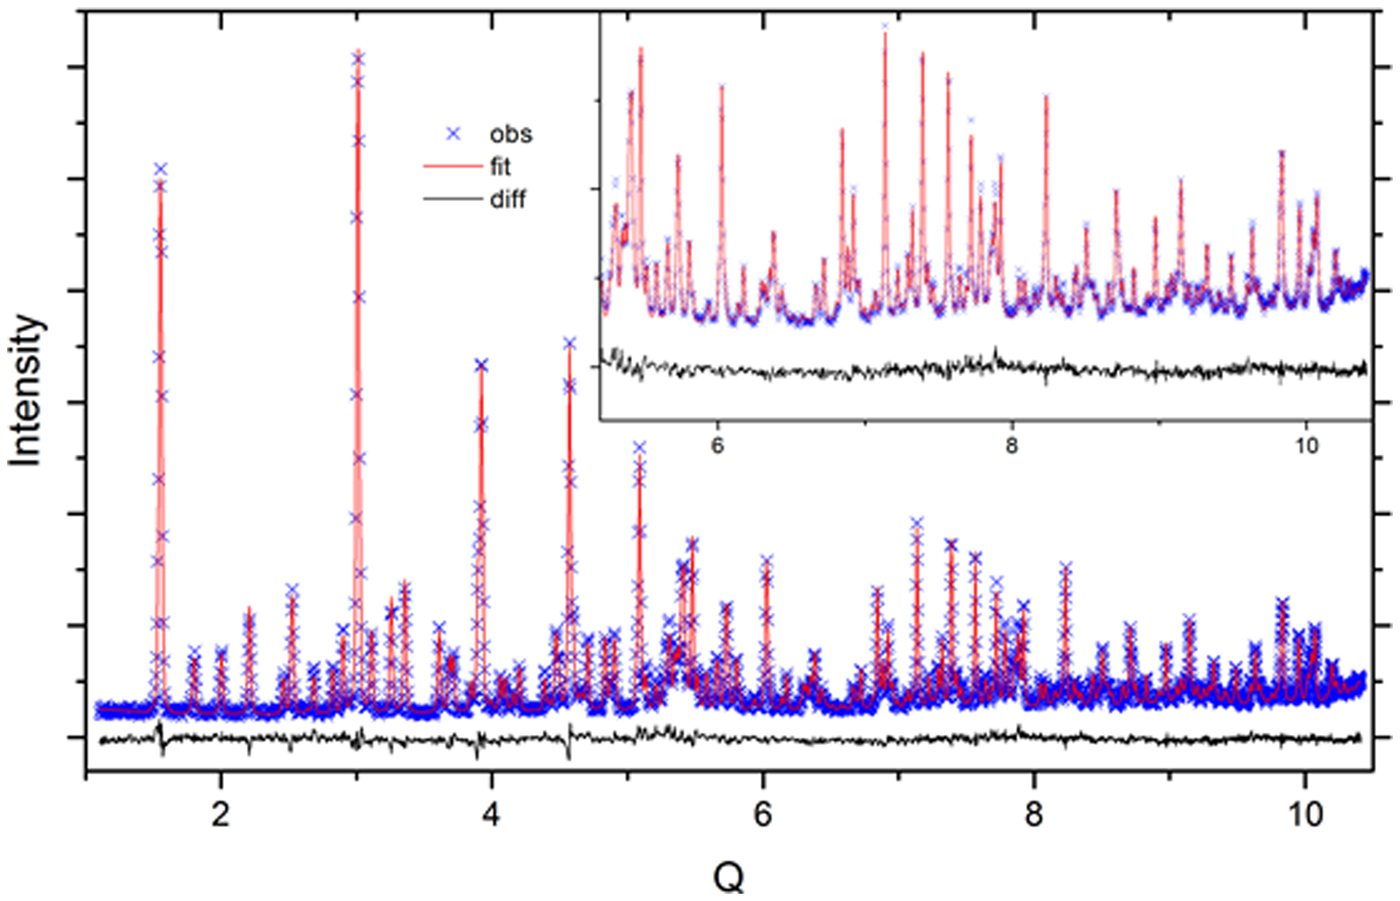
Figure 2. (Color online) Fit quality for a typical Rietveld analysis of the SRM 676a and 1879b mixtures, CW data.
Table 1. Refined mass fractions from the Rietveld analyses of neutron powder diffraction data and the percentage of crystalline material determined from these data via Eq. (10).
The scale factors in GSAS are proportional to the numbers of unit cells from each phase which allows quantitative data to be obtained with the following relation:
 $$\displaystyle{{X_\alpha} \over {\sum {X_{\rm p}}}} = \displaystyle{{S_\alpha Z_\alpha w_\alpha} \over {\sum {S_{\rm p}Z_{\rm p}w_{\rm p}}}}, $$
where X α is the mass fraction of phase α, S p are the scale factors, w p are the molecular weights, Z p are the number of formula weights per unit cell, and the summations are carried out over the various phases within the mixture. Use of this equation allows for “standardless” analysis only if one can assume that ΣX p is 1; i.e., there is no amorphous content and all of the crystalline phases are included in the analysis. Under these conditions, there are an equal number of unknowns and equations. However, if there is an amorphous component then ΣX p is unknown and
 $$\sum {X_{\rm p} + X_{{\rm amor}} = 1}, $$
where X amor is the amorphous fraction. Analysis for amorphous content requires the addition of a standard of known purity. We now consider that both the standard and the unknown contain both crystalline and amorphous fractions:
 $$\sum {X_{\rm u}} = \sum {X_{{\rm u - cry}} + \sum {X_{{\rm u - amor}}}} $$
and
 $$X_{{\rm stn}} = X_{{\rm stn} - {\rm cry}} + X_{{\rm stn - amor}}.$$
The fraction of standard added, X stn, provides another equation of type 1 with the only unknown being ΣX p:
 $$\displaystyle{{X_{{\rm stn - cry}}} \over {\sum {X_{\rm p}}}} = \displaystyle{{S_{{\rm stn - cry}}Z_{{\rm stn - cry}}w_{{\rm stn - cry}}} \over {\sum {S_{\rm p}Z_{\rm p}w_{\rm p}}}}. $$
In this case,
 $$\sum {X_{\rm p} = \sum {X_{{\rm u - cry}} +} {\rm} X_{{\rm stn - cry}}}. $$
Therefore
 $$\displaystyle{{X_{{\rm stn - cry}}} \over {\sum {X_{{\rm u - cry}} + X_{{\rm stn - cry}}}}} = \displaystyle{{S_{{\rm stn - cry}}Z_{{\rm stn - cry}}w_{{\rm stn - cry}}} \over {\sum {S_{\rm p}Z_{\rm p}w_{\rm p}}}} $$
and
 $$\left( {\sum {X_{{\rm u - cry}} + \sum {X_{{\rm u - amor}}}}} \right) + \left( {X_{{\rm stn - cry}} + X_{{\rm stn - amor}}} \right) = 1.$$
The terms in Eq. (7) refer only to the crystalline components of the mixture and, as such, the unknown(s) in Eq. (8) are determined through the diffraction experiment. The terms within the parentheses of Eq. (8), ΣX u and X stn, however, are the mass fractions of the unknown and standard known through the knowledge of the weighing operation when the specimens were prepared. The right-hand side of Eq. (5) is the mass fraction of the standard determined from the Rietveld analysis, MFstn, and allows for the determination of ΣX u-cry. Eq. (6) is then used to determine X u-amor. Solving Eq. (5) for ΣX u-cry and making this substitution into Eq. (6) we get:
 $$\sum {X_{{\rm u - cry}} =} \displaystyle{{X_{{\rm stn - cry}}} \over {{\rm M}{\rm F}_{{\rm stn}}}} - X_{{\rm stn - cry}}$$
and
 $$\eqalign{\sum X_{\rm u - amor} &= {\rm 1} - \left( X_{\rm stn - cry} \over {\rm M}{\rm F}_{\rm stn} - X_{\rm stn - cry} \right) - X_{\rm stn - cry} \cr &\quad - X_{\rm stn - amor}. }$$
The value of ΣX u-amor must be normalized with respect to ΣX u to yield the mass fraction of amorphous material in the unknown. The crystalline mass fractions of SRM 1879b determined via Eqs. (9) and (10) are listed in Table 1 and shown graphically in Figure 3. Considering the results from the two data collections methods independently, the mean for the results from the TOF experiments was 94.37% crystalline cristobalite, while the mean for the CW experiments was 93.58%. The difference between these two means being statistically significant; they were combined with a “Mean of Means” method to yield the certified value and k = 2 expanded uncertainty for the certified crystalline phase purity. The certified value for crystalline phase purity of the material expressed as a mass fraction is 93.98% ± 0.79%. The interval defined by the certified value and its uncertainty represents an expanded uncertainty calculated according to the method described in JCGM 100 (2008).
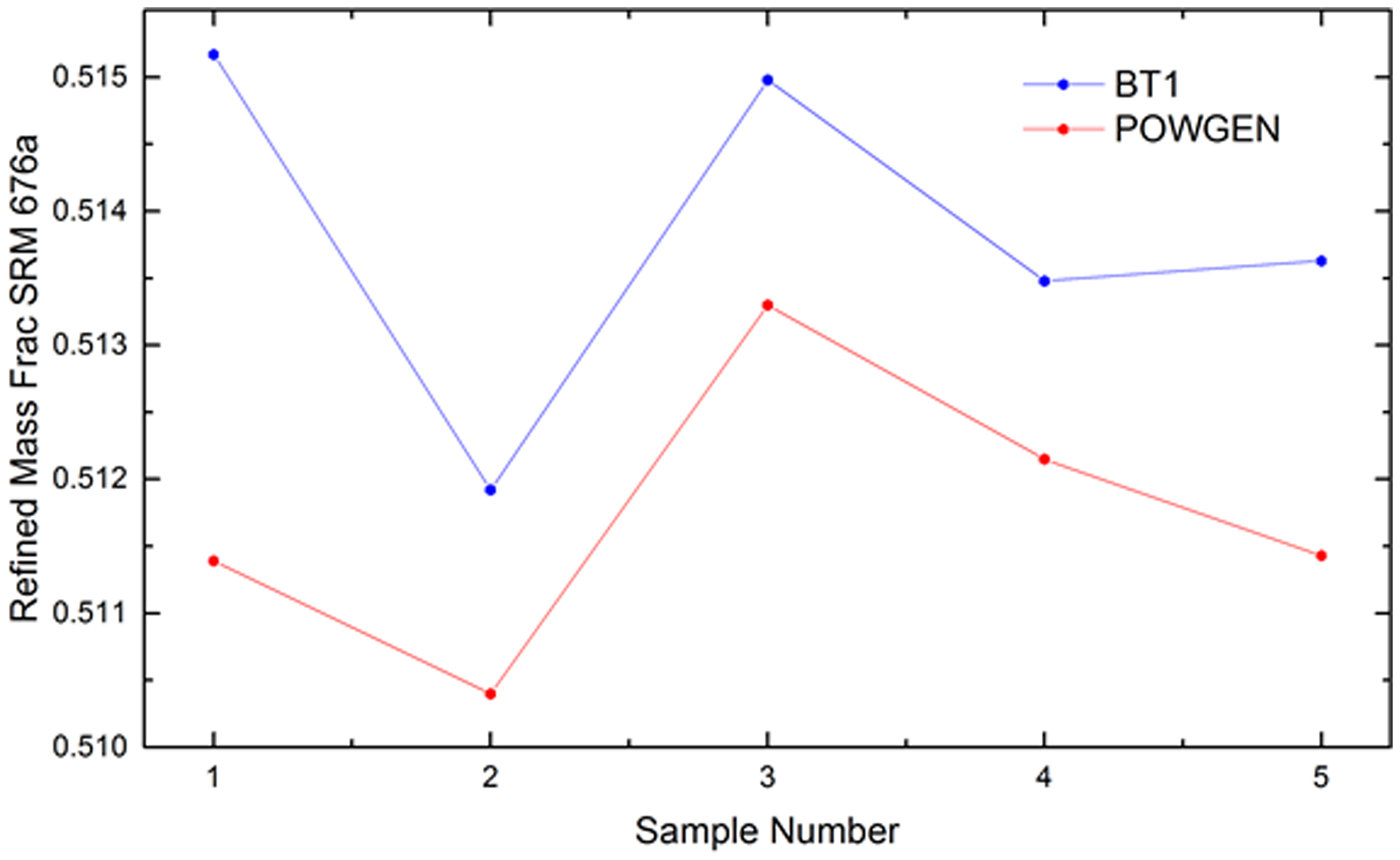
Figure 3. (Color online) The mass fractions of cristobalite obtained from Rietveld refinements of the neutron powder diffraction data from POWGEN (TOF) and BT1 (CW).
The statistical analysis of the neutron data indicated that the difference between the means of the two data sets was significant; however, a considerable overlay in the data set is observed in Figure 3. The differing geometries and physics governing TOF and CW instruments introduce differing sources of potential error in the measurements. TOF is a “white-beam” methodology relying on accurate timing for the choppers and detector electronics to produce high-quality diffraction data via the ideal time to a d-spacing relationship, TOF = DIFC d-spacing (Von Dreele et al., Reference Von Dreele, Jorgensen and Windsor1982). DIFC is a constant that may be calculated, but refinement with additional terms is needed during calibration with SRM660b or other suitable standard to account for different instrument aberrations. The resolution of CW monochromatic data is affected by factors such as the monochromator, sample-to-detector distance, detector pixel size, etc. Obtaining consistent results from these two diverse methods provides confidence that the errors in the data from each instrument are minimized.
B. X-ray data
The certification data were analyzed using the FPA method with Rietveld and Pawley refinements as implemented in TOPAS. Mendenhall et al. (Reference Mendenhall, Mullen and Cline2015) verified that TOPAS operated in accordance with published models for the FPA. The analysis used the energies of the CuKα emission spectrum as characterized by Hölzer et al. (Reference Hölzer, Fritsch, Deutsch, Härtwig and Förster1997). The refined parameters included the scale factors, Chebyshev polynomial terms for modeling of the background, the lattice parameters, specimen displacement, and attenuation terms, structural parameters, terms for Lorentzian size and, in the case of the cristobalite, strain broadening. With the conventional source, a model for the effects of the Ni absorption edge on the background was included. A discussion of the incident spectrum from the IBM and the approach used in its modeling are discussed in Cline et al. (Reference Cline, Mendenhall, Black, Windover and Henins2015). High-count-time data were collected from SRM 660b using a relatively small divergence slit angle of 0.5°. The incident spectrum was then modeled with a refinement of the breadths and intensities of three Gaussian profiles at the Kα 11 location, as defined by Hölzer, and a fourth one located at the Kα 12 location. Additional refined parameters included the Soller slit angles with the “full” axial divergence model (Cheary and Coelho, Reference Cheary and Coelho1998a, Reference Cheary and Coelho1998b). The value for the divergence slit width was fixed at 0.5°. This analysis provided parameters describing the incident beam spectrum and Soller slit angles characterizing the incident profile function (IPF) of the instrument utilizing the IBM. A second set of FPA analyses of SRM 660b were performed, as part of the calibration of the instrument (Cline et al., Reference Cline, Mendenhall, Black, Windover and Henins2015) for both the conventional and IBM configurations. These analyses were used for evaluation of other parameters pertinent only to the IPF such as the incident and “receiving slit” size, which, with the use of the PSD was actually the Si strip width. It was observed in these experiments that the values for the incident slit often refined to values larger than was physically reasonable. This observation is specific to the use of the IBM and the change in the residual error, with respect to incident slit value, was minimal. The incident slit size used in subsequent analyses constituted one that was within physical bounds. Parameters specific to the IPF were not refined with the subsequent analyses. A typical fit to the X-ray data used for certification of lattice parameters is shown in Figure 4.
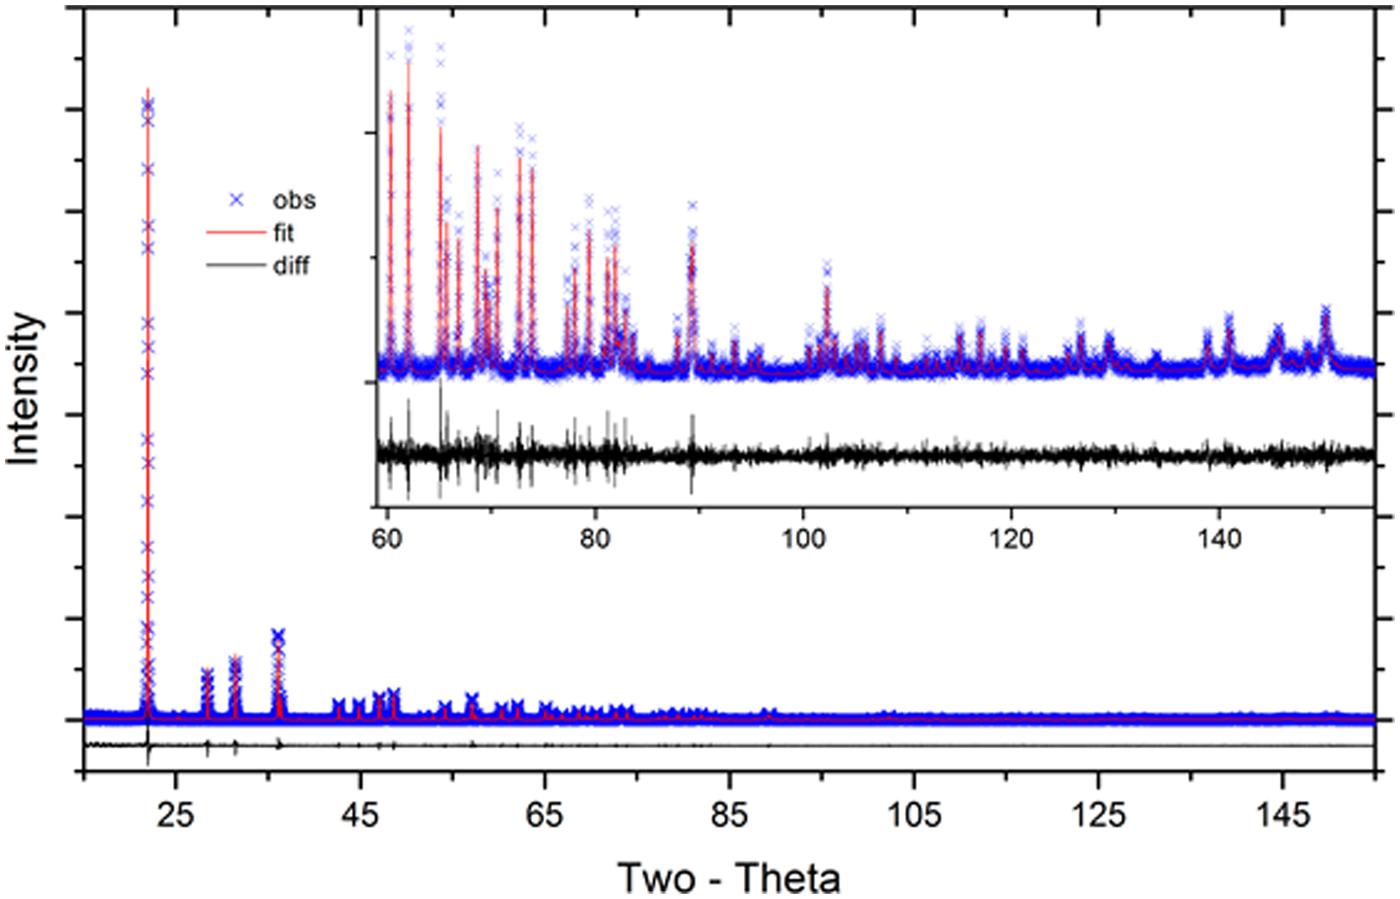
Figure 4. (Color online) Fit quality for a typical Pawley analysis of phase pure SRM 1879b, laboratory X-ray data.
The lattice parameters obtained from the phase pure 1879b specimens are listed in Table 2. The certified values for lattice parameters obtained with TOPAS via the Pawley method are a = 0.497 082 68 nm and c = 0.691 955 76 nm. The statistical, Type A, evaluation of the lattice parameters resulted in estimates of the expanded uncertainties, with a k = 2 coverage factor, of 0.000 005 16 and 0.000 005 91 nm for a and c, respectively. However, type B components of uncertainty must also be taken into account, and these are roughly one order of magnitude larger than those from statistical methods. An estimation for the type B uncertainty was derived from an examination of the difference in lattice parameter as a function of 2θ angle obtained with an FPA Rietveld analyses vs. those obtained with a profile analysis (Cline et al., Reference Cline, Black, Gil, Henins and Windover2010). This approach was applied to data from SRM 660b used to calibrate the machine, and both SRMs 676a and 1879b that were contained in the samples. These considerations lead to an assignment of a type A + B uncertainty of 0.000 030 0 nm to the a and c lattice parameters. The refined lattice parameters for SRM 1879b were adjusted using the coefficient of thermal expansion values found in Peacor (Reference Peacor1973) to values at 22.5 °C. Attempts to model the crystallite size broadening with a log-normal size distribution of spherical crystallites using the Scardi and Leoni (Reference Scardi and Leoni2001) formalism were unsuccessful, indicating that SRM 1879b displays an undetectable (with laboratory equipment) level of crystallite size induced broadening. The FWHM term varying as tan θ, interpreted as microstrain, refined to ε 0 value of 0.00022, where (ε 0)2 is the mean squared strain. The information values for the particle size distribution, as determined by laser scattering, are given in Figure 5. The refined structural parameters obtained from the Rietveld analyses of SRM 1879b, from both the X-ray and neutron data, did not differ substantially from those reported by O'Keefe and Hyde (Reference O'Keefe and Hyde1976).
Figure 5. Typical particle size data from SRM 1879b obtained from laser scattering.
Table 2. Refined lattice parameters from analyses of the X-ray diffraction data collected from phase pure specimens.
V. CONCLUSION
The phase purity and lattice parameters of cristobalite have been certified using neutron and X-ray powder diffraction. TOF and CW neutron diffraction from nominal 50:50 mixtures of SRM 1879b and SRM 676a provide for the certification of phase purity. The phase purity is certified to be 93.98% ± 0.79%. X-ray diffraction data from pure samples, using a NIST-built diffractometer, provided for the certification of the lattice parameters. The certified lattice parameters are a = 0.49708 3 ± 0.000 030 nm and c = 0.691956 ± 0.000 030 nm at 22.5 °C. These values incorporate an expanded type B uncertainty assigned based on a comparison of two different analysis methodologies.
Funding
Funding was provided by the U.S. Government, Department of Commerce.
Conflicts of Interest
The author have no conflicts of interest to disclose.
Acknowledgements
A portion of this research used resources at the Spallation Neutron Source, a DOE Office of Science User Facility operated by the Oak Ridge National Laboratory.


