


OVERVIEW
The purpose of this report is to inform APSA’s membership about the association’s financial health for the 2016–17 fiscal year, ending September 30, 2017. This report provides an overview and assessment of APSA’s assets and current financial operations. More detailed financial information is also contained in the APSA 990 federal tax form which is available on the APSA website at http://apsanet.org/ABOUT/Tax-Forms. The audit report for FY17 is also available on request from the APSA office.
The association’s financial condition remains healthy, providing a resource base sufficient to continue current operations, while expanding the association’s activities in new directions as needed. Since APSA’s last annual report, our assets increased in value from $37.6 million on September 30, 2016 to $41.5 million on September 30, 2017. During the same period, liabilities decreased from $4.6 million to $3.9 million.
As seen in table 1, for the recently ended fiscal year (October 1, 2016–September 30, 2017), operating revenue was $6.7 million (not including funds budgeted to be drawn from APSA’s endowments), with operating expenditures held below budget at $6.8 million. The association’s primary revenue sources (memberships, the annual meeting, and APSA journals and publications) are continuing to show growth with the exception of the annual meeting, which decreased about 6% in total revenue from the prior year.
Table 1 Operating Revenue Trends, 2012–2017
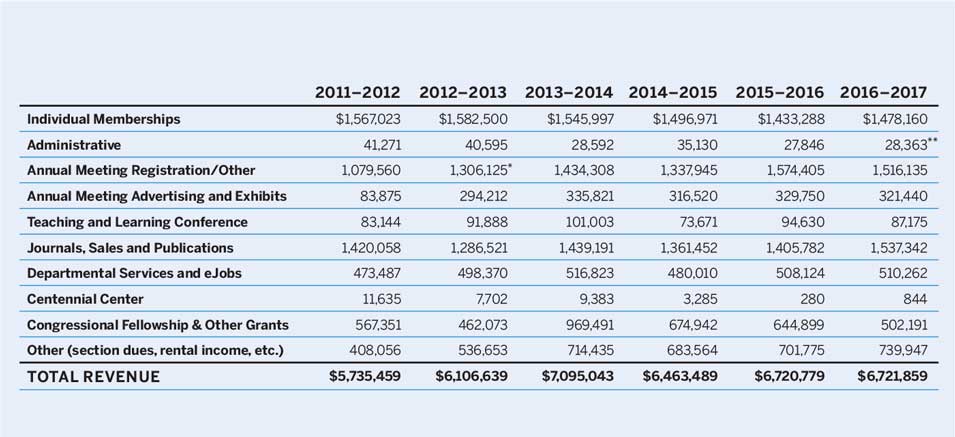
* Includes $26K 2012 Meeting Insurance Proceeds
** Includes $6,700 2017 Bldg1527 Insurance Proceeds
The association has continued to implement improved, more efficient financial practices. Thus, the association’s accounting is in line with best practices and APSA has diversified its investment strategies with an eye toward reducing risks associated with portfolio concentration.
In short, APSA continues to operate in a desirable financial environment, with steady income and growth-producing programs, minimal long-term liabilities, professional accounting practices, and a diversified investment portfolio. These steady growths were offset by the continued incremental decline in individual membership across the board with the exception of life, family, and retired members. Nonetheless, APSA is in a position to have an operating budget that meets anticipated income and expenses.
The remainder of this report will present more detailed analysis and information on each of these topics.
APSA INVESTMENTS AND NET ASSETS FOR FISCAL YEAR 2016–17
The association’s overall financial position is stable, with assets of more than $41.5 million as well as a headquarters building and adjacent property, and a carefully monitored operating budget (see table 2). Overall, APSA ended FY17 with a balance sheet that reflected assets of $41.5 million and liabilities of $3.9 million, resulting in a net worth of $38.0 million. Of this net worth, $5 million is permanently restricted, $16.0 million is temporarily restricted, and more than $17.0 million is either unrestricted or board-designated.
Table 2 Balance Sheet: September 30, 2017 (with Comparable Totals for 2012–2017)
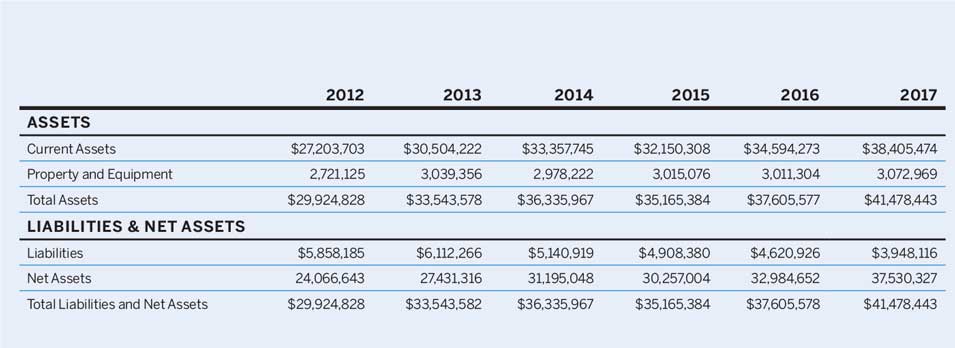
APSA’s financial statements, which also include figures for operations, investments, endowed programs, and grant-funded activities, show an increase in total net assets at September 30, 2017 of $4.5 million for the fiscal year. The change in net assets for 2016–2017 was due chiefly to the 4.5 million increase in fair market value (FMV) of APSA investments as well as an increase in total revenues of $1,100 thousand. As indicated in table 3, this performance compares to an increase of $2.7 million in year 2016, a decrease of $938 thousand in year 2015 and $3.8 million in year 2014.
Table 3 Investment Portfolio Summary for Trust Pool and Endowed Funds FY17
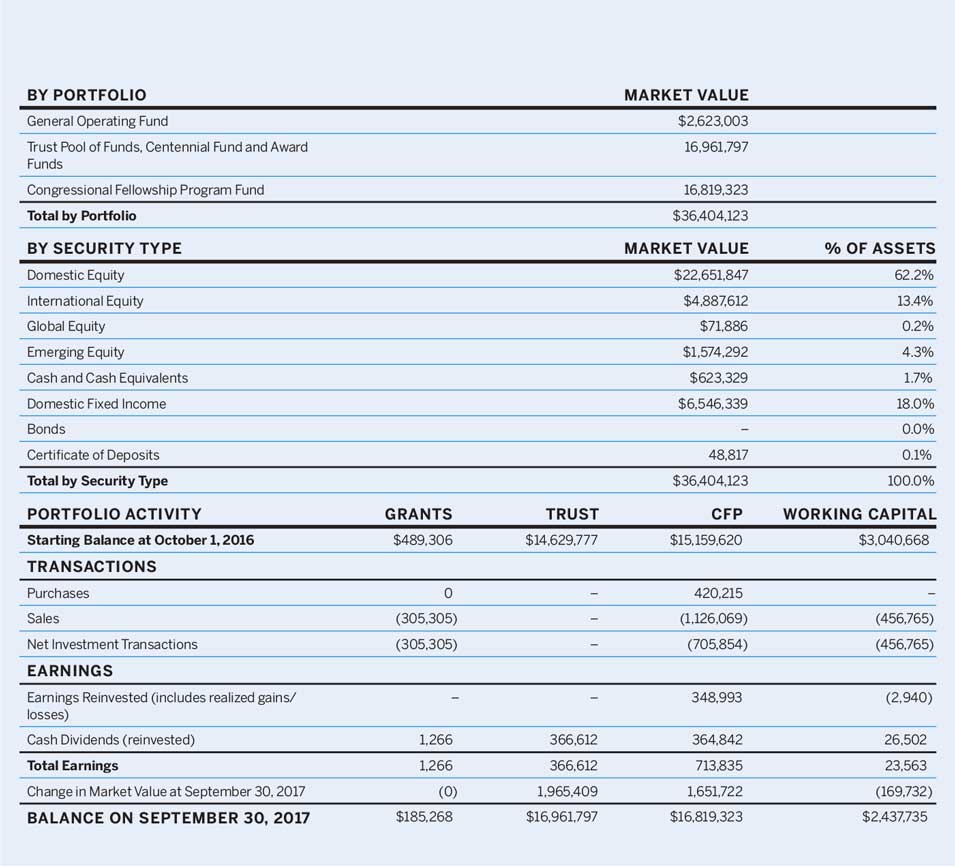
Our investments, seen in table 3, were valued at $36.04 million on September 30, 2017. These assets are defined by their fund: $16.8 million in the Congressional Fellowship endowment; $16.96 million in Centennial and Awards funds; and $2.4 million in general operating funds (all at market value as of September 30, 2017).
APSA’s portfolios have in recent years outperformed the S&P 500 (refer to table 3a). During the third quarter of 2017, asset class returns were broadly positive for the third quarter as global markets continued to rebound from the late June shock caused by the UK’s decision to leave the European Union. Investment returns benefitted from continued accommodative global central bank policies as well as a general improvement in economic data released during the quarter. Equities continued to outperform bonds as investors embraced risk-based assets as a result of historically low interest rates around the globe.
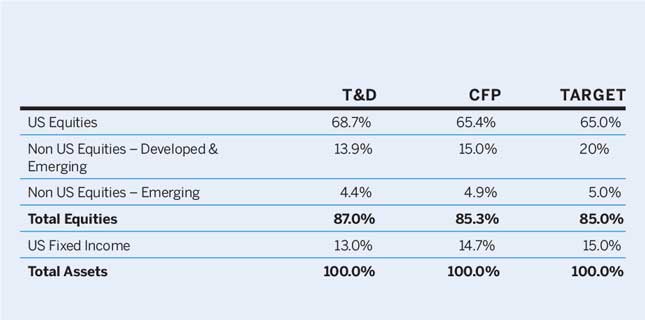
Table 3a Asset Allocation
This resulted in the following returns:
• The CFP account had a return of 4.5% for the third quarter and a trailing one-year return of 16.0%.
• The T&D account posted a return of 4.4% for the third quarter and also had a trailing one year return of 15.9%. The Working Capital account posted a gain of 0.32% for the quarter with a trailing one-year return of 0.74%.
OPERATING BUDGET FOR 2016–17
The budget for the most recent fiscal year appears in tables 4 and 5. Our largest anticipated income sources for the year were membership dues and fees ($1.9 million) conferences and meetings revenue ($1.85 million), and journals and publications ($1.5 million). Our largest anticipated expenditure areas were for "Business Office & Web/IT" ($1.3 million), journals ($1.11 million), and the annual meeting ($1.11 million).
Table 4 Operating Budget–Revenue
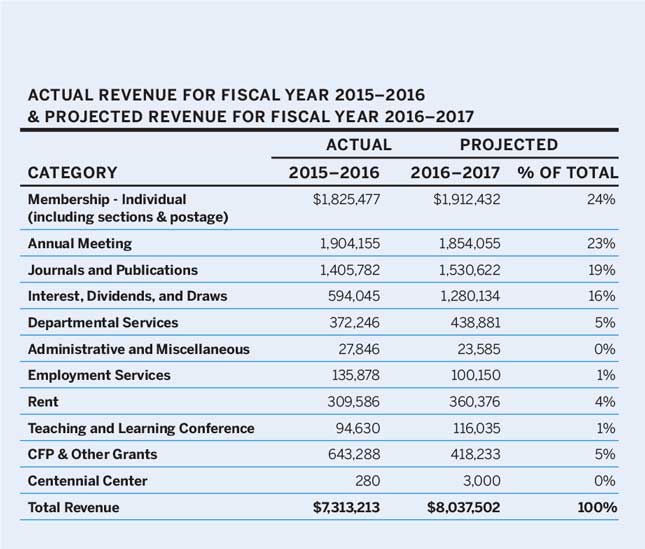
Table 5 Operating Budget–Expenditures
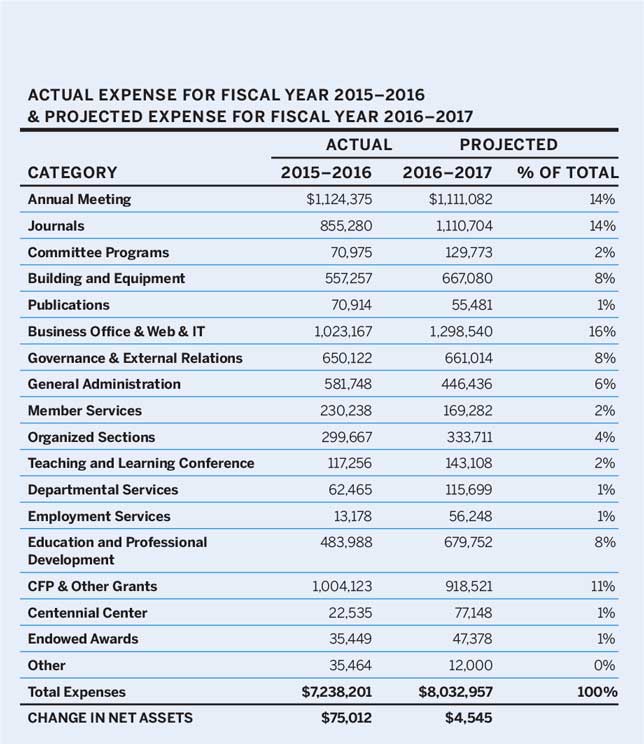
The budget anticipated that roughly 24% of total revenue would be derived from individual memberships; 23% from the annual meeting; and 19% from journals, sales, and advertising revenue streams. On the expense side of the ledger, annual meeting costs accounted for 14% of all operating expenses in 2016–17, Congressional Fellowship Program and other grant expenses were expected to account for 11%, while our three journals were expected to account for 14% of all operating expenses, followed by business office at 16% and governance and external relations at 8%. Building and equipment (including depreciation costs) stood at 8%, while general administration, education and professional development, and organized sections each accounted for just over 6%. Also, 3% or less of total expenses were costs related to committee programs, member services, the Teaching and Learning Conference, departmental programs and conferences, publications, employment services, the Centennial Center, and endowed awards.
Compared to the prior fiscal year, total revenue realized from individual membership dues during 2016–2017 increased slightly (3.1%). Total individual membership dues and numbers are 3% greater than at this time last year. This increase was due to a large span of individuals renewing or joining at a greater rate in the first six months of the fiscal year (October 2016 through March 2017). Historically, APSA membership trends have informed us that membership renewals and new member joins tend to increase leading up to and during the annual meeting. However, in 2017 membership renewals and joins were an anomaly to the trend, showing increased membership numbers leading up to and during the annual meeting.
The cost to deliver services in all major programs increased from 2016–17, with the exception of the Annual Meeting, Programs and Projects, and Membership, Business Office and Sales categories at rates of 11%, 21.1% and 12% respectively(see table 6 for multiyear comparisons).
Table 6 Operating Budget 2001–2017: A Multi-Year Perspective
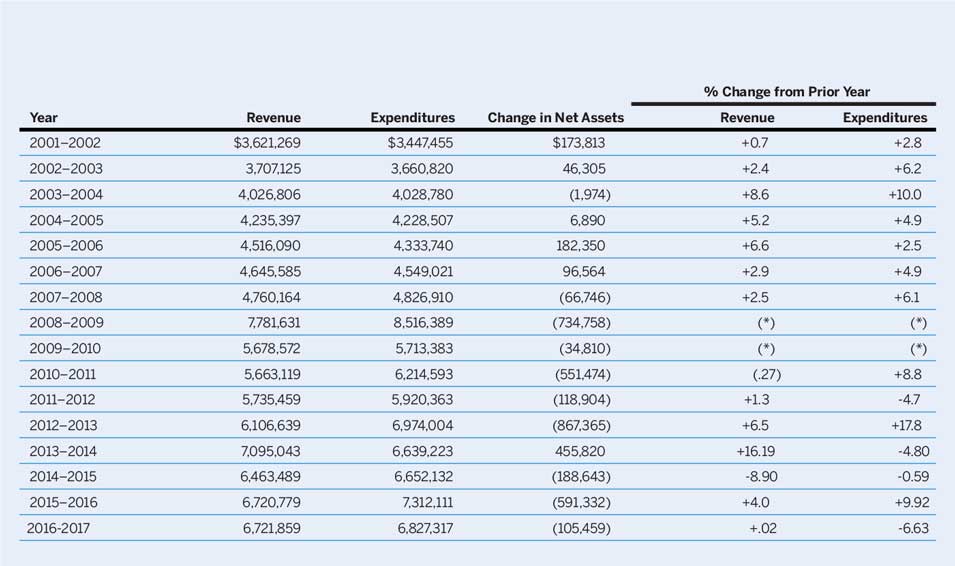
(*) In FY 2008–2009, APSA changed Year end from June 30th to September 30th, therefore budget is for 15 months.
OPERATIONS IN REVIEW: FISCAL YEAR 2016–17
The recently concluded fiscal year was an active one. Most importantly, after the success of the 2016 Annual Meeting in Philadelphia, the 2017 Annual Meeting in San Francisco was able to surpass expectations. Compared to 2016, the number of paid registrants was very strong; indeed, we set an attendance record for a west coast city at the San Francisco meeting. Our total attendance was 6,366—a 3.2% increase over our 2015 San Francisco meeting attendance. APSA also held its 14th annual Teaching and Learning Conference in February 2017 in Long Beach, CA. The conference theme was: “The 21st Century Classroom: Creating an Engaging Environment for All Student.” The 2017 Annual Meeting was held in San Francisco centered on the theme “The Quest for Legitimacy: Actors, Audiences, and Aspirations.” Other initiatives in 2016–2017 included sustained efforts in the areas of public engagement, expanded department and international membership, the Teaching and Learning Conference, annual workshops in the Middle East and North Africa, mentoring, and graduate education.
In 2016, APSA provided support for the APSA Ralph Bunche Summer Institute (RBSI) at Duke University, at a level of 15 students due to the receipt of a new National Science Foundation (NSF) grant to Duke University for the RBSI. APSA contributed direct cost support for teaching assistants.
In conjunction with the RBSI Working Group report, in 2015 the APSA Council created this board designated RBSI Support Fund to provide funding for the 2016–2018 RBSI at Duke University, along with an RBSI Advisory Committee charged with overseeing the development of long-term programming options. A development strategy outlining a three-year, $750,000 fundraising goal for the Ralph Bunche Fund was submitted to APSA Council to support future efforts, and efforts to support the RBSI programs through institutional and individual philanthropy are continuing. With NSF funding in place for 2016–2018, updated recommendations for the RBSI Support fund for the short term will be submitted by the RBSI Advisory Committee.
In terms of earned operating revenue and program expenses, the outcome for the year for both was higher than budget expectations. As table 7 demonstrates, APSA earned approximately $6.7 million in operating revenues and incurred operating expenses of $6.8 million, excluding budgeted draws/fund transfers.
Table 7 Operating Expenditure Trends 2012–2017
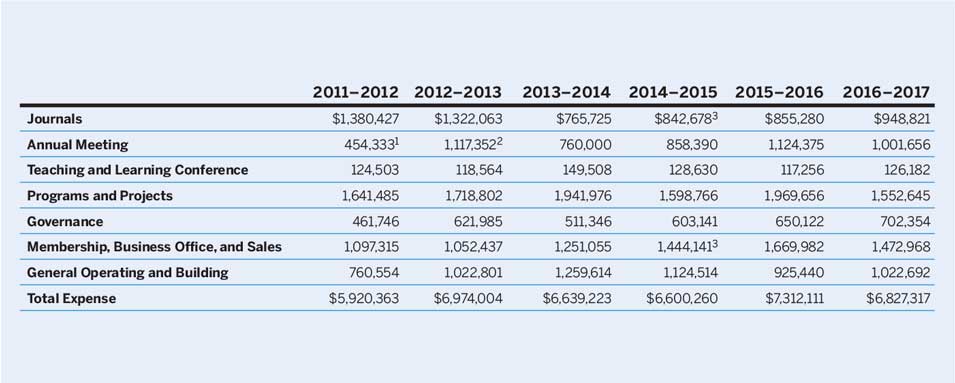
1 Includes net effect of 2012 Annual Meeting Cancellation
2 Includes additional cost related to 2012 Annual Meeting Cancellation of $100K
3 As of 2014–2015 Web Services has been moved to General Operating
Please note that in accordance with Generally Accepted Accounting Principles (GAAP), board approved draws/fund transfers on the following programs are not included in the reporting of actual revenue activities within the financials. These amounts are only included in the budget column for budgeting and council reporting.
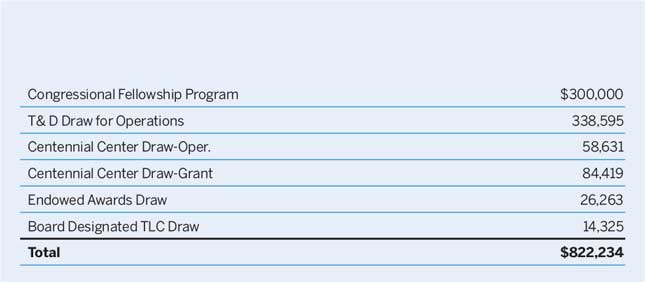
When draws/fund transfers are taken, as seen in table 8, they are reflected as a reduction of the Congressional Fellowship Fund and Trust and Development Funds and an increase of APSA General Operating Fund on the balance sheet.
Table 8 Budgeted Draws/Fund Transfers: 2016–2017
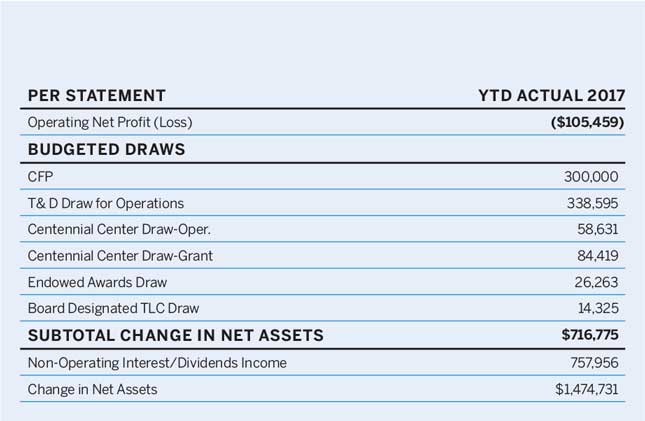
Therefore, when budgeted draws/fund transfers are taken into consideration for operating activities and projects, Operating Net Profit (Loss) is demonstrated in table 9.
Table 9 YTD Operating Net Profit
APSA and Cambridge University Press began a new 10-year agreement, effective January 1, 2017 through December 2026, for the publication of the American Political Science Review (APSR), PS: Political Science & Politics and Perspectives on Politics. Overall, the contract is worth approximately $17 million to APSA over the ten-year term.
SUMMARY
Overall, APSA is in a very strong financial position and is planning a number of new initiatives for the benefit of our membership including a special projects fund for worthy research initiatives benefiting the discipline. Members with questions about our finances should contact Steven Rathgeb Smith, executive director at smithsr@apsanet.org.


