


Dietary risk factors are a leading cause of death and disability globally( Reference Lim, Vos and Flaxman 1 ). National surveys indicate that children and adults in high-income countries such as the USA, the UK and Australia continue to consume foods high in fat, sugar and/or salt that contribute to excessive energy intake( 2 – 4 ). Given that dietary behaviours in childhood track into adulthood and are predictive of future chronic disease( Reference Mikkilä, Räsänen and Raitakari 5 , Reference Maynard, Gunnell and Emmett 6 ), improving child nutrition has been identified as a public health priority( 7 ).
The WHO recommends the implementation of food and beverage policies as a strategy to improve the nutrition of children( 8 ). These include policies which restrict the availability of foods and beverages with little nutritional value and increase the availability of foods and beverages with high nutritional value in settings frequented by children. Schools represent an attractive setting for such policies. Children consume almost 40 % of their recommended energy intake while at school and schools provide centralised access to the majority of children each day( Reference Bell and Swinburn 9 ). As such, policies to influence the availability of foods and beverages at school food services, or for sale at canteens, kiosks or vending machines, have been introduced by countries including the USA( 10 ), Australia( 11 ), New Zealand( 12 ) and Canada( 13 ).
Systematic reviews suggest that altering the availability of foods and beverages in community settings such as schools can have an impact on students’ purchasing and consumption( Reference Driessen, Cameron and Thornton 14 ). However, there is considerable variability in school-based guidelines and policy recommendations regarding the proportional availability of foods of different nutritional value( 11 , 15 , Reference Guthrie, Newman and Ralston 16 ). Some policies or guidelines ban specified food or beverage products (e.g. soft drinks) from sale( 17 ), while others restrict the proportion of foods available with low nutritional value (e.g. deep-fried foods), for example, to no more than 20 % of all available products( 18 ).
Little is known about how food purchases change with relative increases in the availability of foods of high or low nutritional value( Reference Driessen, Cameron and Thornton 14 , 17 ). Such information is important when establishing public health nutrition policies regarding the availability of foods in settings such as schools. As a first step to understand the relationship between food availability and students’ purchasing of unhealthy and healthy foods, we sought to describe their association in a cross-sectional sample.
Specifically, the aims of the present study were to:
1. describe the proportion of foods and beverages available on school canteen menus classified as having high nutritional value, moderate nutritional value or low nutritional value;
2. describe the proportion of foods and beverages purchased by students as having high nutritional value, moderate nutritional value or low nutritional value; and
3. examine the association between food and beverage availability on school canteen menus and food and beverage purchasing by students.
Methods
Context
The study was conducted in the Hunter New England region of New South Wales (NSW), Australia. All government schools in the region were required to adopt the NSW Fresh Tastes @ School (FT@S) Healthy School Canteen Strategy( 11 ) released by the NSW Department of Education in 2005. FT@S classifies foods and beverages sold in school canteens as ‘green’ (high nutritional value), ‘amber’ (moderate nutritional value) or ‘red’ (low nutritional value) based on their nutritional content (Tables 1 and 2). FT@S recommends school canteens should ‘fill their menu’ with green foods (interpreted by the research team as ≥50 % of menu items), not allow amber items dominate their menu and remove items classified as ‘red’ from regular sale.
Table 1 Food and beverageFootnote * classifications according to the Fresh Tastes @ School (FT@S) criteria( 11 )
* Combination foods such as sandwiches or hot meals were classified according to a ‘ready reckoner’ within the FT@S.
† Sugar-sweetened drinks that meet the nutritional criteria for ‘red’ foods outlined in the FT@S Canteen Menu Planning Guide are classed as ‘banned’ and not permitted for sale in school canteens or school vending machines at any time.
Table 2 The occasional food criteria for determining if a food is red( 11 )
If the item has more than the number specified in the energy, saturated fat or Na column, or less than the number in the fibre column, it is a red food.
Design
The study employed a cross-sectional design.
Sample and recruitment
A nested sample of fifty government primary schools was randomly selected from a sample of seventy schools participating in a larger randomised controlled trial. The larger randomised controlled trial was conducted from 2013 to 2015 and aimed to improve canteen compliance with FT@S( 19 ). Full details of the larger trial have been previously reported( 19 ). Primary schools were eligible to participate in the broader trial if they: (i) enrolled children aged 5–12 years; and (ii) had an operational canteen in February 2015 (i.e. southern hemisphere summer). Schools that enrolled both primary and secondary students, exclusively catered for children with special needs or were currently compliant with FT@S were excluded (<20 % of schools). Catholic and Independent schools were also excluded, as the FT@S policy is not mandated in these schools. There were no additional eligibility inclusion criteria for participation in the present study. Principals of the fifty randomly selected schools received an information letter inviting their school to participate in the study and informing them of the study procedures.
Measures and data collection
School characteristics
Principals of participating schools completed a computer-assisted telephone interview conducted by a trained research assistant. Principals completed items used in previous surveys of school principals( Reference Nathan, Wolfenden and Bell 20 – Reference Nathan, Wolfenden and Williams 22 ) to assess school characteristics, including school size (number of students enrolled) and school location (postcode area).
Canteen characteristics
School canteen managers participated in a computer-assisted telephone interview and completed items assessing the operational characteristics of canteens, including days of operation and whether the canteen manager and staff were volunteers, paid employees or both.
Food and beverage availability on school canteen menus
All canteen managers were asked to provide a copy of their canteen menu for Term 1, 2015 (i.e. their summer canteen menu). Managers were prompted with a reminder call if menus had not been received within one week. Menus were independently audited by two dietitians, blinded to group allocation, based on validated procedures for menu review previously described elsewhere( 11 , Reference de Silva-Sanigorski, Breheny and Jones 23 , Reference Reilly, Nathan and Wolfenden 24 ) and using published FT@S resources to classify menu items as ‘green’, ‘amber’ or ‘red’ according to the FT@S criteria( 11 ). If classification of an item could not be determined from the menu alone, canteen managers were contacted to provide additional information (e.g. brand, serving size). Discrepancies in menu item classification between dietitians were resolved through discussion and consensus or with a third dietitian if agreement could not be reached.
Environmental characteristics
One dietitian reviewed each school’s Term 1, 2015 menu to assess the presence of menu-labelling strategies. Use of any of the following strategies to indicate the nutritional value of any menu item was sufficient to be classified as ‘implementing’ menu-labelling practices: traffic-light symbols (green, amber or red), graphical symbols (e.g. a smiley face, tick or shape immediately adjacent to the item name), kilojoule content or other (e.g. descriptive terms such as ‘light’, ‘low-fat’). The same dietitian used the school’s menu to identify whether healthy foods were promoted through use of ‘meal deals’ (defined as two or more food or beverage products, at least one of which was classified as ‘healthy’ (green), and at a discounted price when purchased together). Schools were classified as ‘implementing’ this practice if all the meal deals listed on their menu contained at least one ‘green’ item. Canteen managers were asked in the computer-assisted telephone interview whether they positioned healthy foods prominently in their canteen. Specifically, schools were classified as ‘implementing’ this practice if the canteen manager reported that fruit and vegetables were positioned on the counter or at eye level.
Student purchasing of foods and beverages from school canteens
Student purchasing data were collected during a one-day field observation at participating school canteens. Research assistants (with dietetic qualifications) conducted observations using data collection tools and procedures designed specifically for the present study and pre-piloted in two canteens. All research assistants attended a one-day (7·5h) intensive training course in the data collection procedures. The training incorporated a quality assurance component which required research assistants to achieve 100 % accuracy in recording of students’ purchases using the observation tool in a simulated canteen setting.
Depending on the size of the canteen and number of service lines, two or three trained research assistants attended each school and observed canteen practices from two hours before the morning break until the end of the food service period (i.e. after the lunch break). Each research assistant kept a tally of canteen purchases including those made at each meal break by each student. Data checks were performed in 20 % of schools where each individual student’s purchase was recorded by two independent observers (i.e. an additional one or two research assistants per school). Agreement between observers in the products recorded per student purchase was 95 %.
All data were re-identifiable to enable matching by the statistician conducting the analysis. After data entry and matching were complete, all identifying information was removed.
Statistical analysis
Statistical analyses were performed using the statistical software package SAS version 9.3. Descriptive statistics were used to describe the characteristics of the schools and canteens participating in the study. NSW Department of Education School Directory( 25 ) classifications were used to classify schools as small (<160 students enrolled) and medium/large (≥160 students enrolled). The median value assigned to postcodes of the Socio-Economic Indexes for Areas (SEIFA)( 26 ) was used to classify schools as located in a higher or lower socio-economic region. Consistent with definitions and classification criteria used by FT@S, items classified as ‘green’ were defined as foods and beverages of ‘high nutritional value’; those classified as ‘amber’ were defined as foods and beverages with ‘moderate nutritional value’; and those classified as ‘red’ were defined as foods and beverages with ‘low nutritional value’. Separate general linear models were used to describe the association between availability of green, amber and red items, and student purchasing of these items, respectively, while controlling for school group allocation of the larger randomised controlled trial, school size, socio-economic status of the region where the school was located and other prognostic factors such as presence of menu labelling, promotion and position of menu items within the school food environment. The R 2 statistic was used to report the proportion of variance explained by the model. Alpha was set at 0·05. An analysis to describe the school characteristics and environmental characteristics of schools of high and low availability (dichotomised at the median) of green and red items was also undertaken.
Results
Of the fifty eligible schools that were randomly selected, 76 % (n 38) consented and participated in the present study. There were no significant differences among schools that did and did not consent to participate in baseline school characteristics (P>0·05). The characteristics of participating schools and canteens can be seen in Table 3.
Table 3 Characteristics of the participating government primary schools and canteens (n 38) from the Hunter New England region of New South Wales, Australia, Term 1, 2015
* Status was determined based on the postcode of the school locality and the Socio-Economic Indexes for Areas 2011.
Average proportion of foods and beverages available on menus
Green items represented on average 47·9 % of all canteen items (range: 36·0–69·0 %) across schools. The availability of amber items on canteen menus represented on average 47·4 % of all canteen items (range: 31·0–59·0 %) across schools. Red items represented on average 4·7 % of all canteen items (range: 0–17·0 %). There were few differences in school and environmental characteristics of schools with high and low availability of green and red, except for labelling and promotion which appeared to be associated with a higher availability of green (labelling and promotion) and lower availability of red (labelling); however, such differences did not reach statistical significance (see online supplementary material, Supplemental Table 1).
Average proportion of items purchased by students
Green items represented on average 30·1 % of all items purchased by students (range: 6·5–65·0 %) across schools. Amber items were the most frequently purchased and represented on average 61·8 % (range: 30·4–89·3 %) of all purchased items across schools. Red items represented 8·1 % of all items purchased (range: 0–34·7 %) across schools.
Association between food and beverage availability on menus and purchasing by students
Results from the general linear models predicted that, as the availability of green items on a canteen menu increased, so did the purchasing of these items (Fig. 1). For students to have the majority of their purchases consist of healthier foods (≥50 %), the menu would need to consist of over 70 % green items. Despite the similar average availability of amber items on menus compared with green items (47·9 and 47·4 %, respectively), the purchasing of amber items occurred at a much higher rate (Fig. 2). For example, having only 40 % of amber items available would result in approximately 50 % of students’ purchases being amber items. As with green and amber items, higher rates of red item purchasing increased as red item availability increased (Fig. 3). For example, even with only 5 % of red items available on a menu, approximately 10 % of students’ purchases would contain red items. The positive associations described above were found to be significant for the availability and purchasing of green items (R 2=0·66), amber items (R 2=0·57) and red items (R 2=0·61). In each case, a 1 % increase in availability of items in these categories was associated with an increase of between 1·21 and 1·67 % in the purchasing of these products (Table 4).
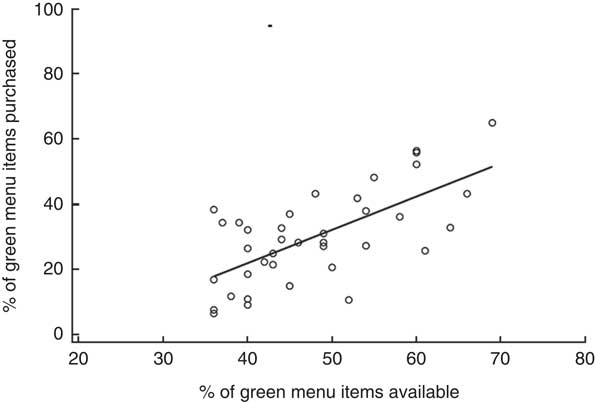
Fig. 1 Association between availability and purchasing of green menu items by students in randomly selected government primary-school canteens (n 38) from the Hunter New England region of New South Wales, Australia, Term 1, 2015
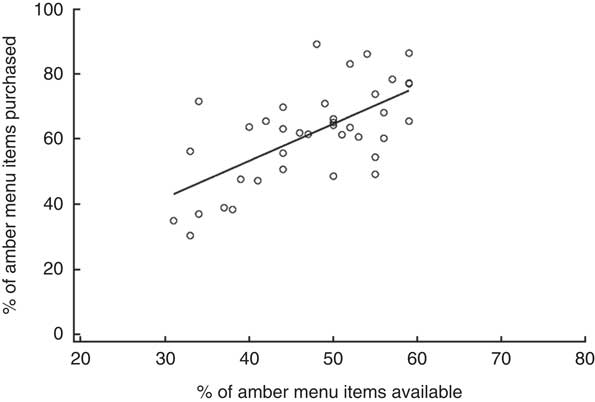
Fig. 2 Association between availability and purchasing of amber menu items by students in randomly selected government primary-school canteens (n 38) from the Hunter New England region of New South Wales, Australia, Term 1, 2015
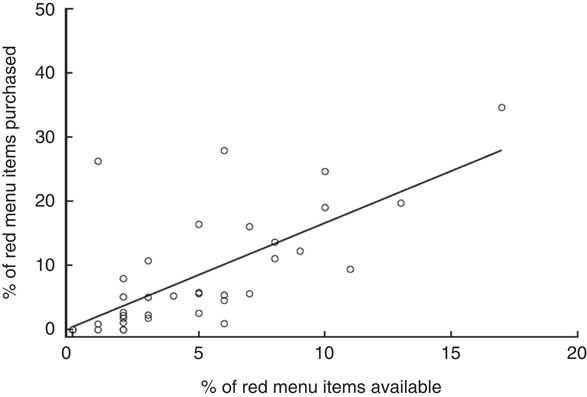
Fig. 3 Association between availability and purchasing of red menu items by students in randomly selected government primary-school canteens (n 38) from the Hunter New England region of New South Wales, Australia, Term 1, 2015
Table 4 Association between the availability of menu items and purchasing by students in randomly selected government primary-school canteens (n 38) from the Hunter New England region of New South Wales, Australia, Term 1, 2015Footnote *
* Data were analysed using separate general linear models while controlling for group allocation, school size, socio-economic status of the region, presence of menu labelling, promotion and position of menu items within the school food environment.
† The estimate represents the mean increase in purchase (%) for every increase in availability of 1 %.
Discussion
The present study sought to describe the association between food and beverage availability at school canteens and student food and beverage purchasing. The study found a significant positive relationship between food and beverage availability and purchasing across items classified as having high nutritional value (green), moderate nutritional value (amber) or low nutritional value (red). In each case, a 1 % increase in the availability of these foods and beverages corresponded to an increase in student purchasing of such foods of between approximately 1·0 and 1·7 %. The models predicted that greater restrictions on the availability of products with low nutritional value, or an increase in the availability of foods and beverages with high nutritional value, may have a significant impact on purchasing behaviours and, in turn, improve child nutrition.
These findings are consistent with a previous systematic review which demonstrated that initiatives to alter the availability of foods and beverages may have an impact on the foods and beverages purchased or consumed by children( 17 ). For example, in one US study of over 10 000 children from more than 2000 schools, it was reported that 24 % of children purchased at least one sweetened beverage in schools with a policy permitting sweetened beverages, compared with only 8 % of children in schools with a policy that banned the availability of such beverages( Reference Jones, Gonzalez and Frongillo 27 ). Similarly, in sports settings, an increase in the availability of healthy items at food outlets from 9·1 to 25·0 % corresponded with a significant increase in healthy item purchases, predominantly by children, of 7·7–22·7 %( Reference Olstad, Goonewardene and McCargar 28 ). A positive association between food availability and child consumption has also been demonstrated in the home environment( Reference Wyse, Campbell and Nathan 29 ).
While the absolute increases in the availability of green, amber and red items were associated with similar absolute changes in students’ purchase of these products, there was variation between these categories in the underlying likelihood of children selecting such products. In many jurisdictions in Australia, school food policies recommend that school canteens increase the proportion of menu items classified as green to at least 51 %, reduce the proportion of items classified as amber and remove items classified as red( 11 , 30 – 32 ). However, modelling in the present study suggests that a higher percentage of green items on the canteen menu is required (>70 %) to ensure the majority (≥50 %) of students’ purchases include green items. This was compared with the much lower threshold for the proportion of amber foods available on the menu (40 %) required to achieve ≥50 % of sales from this category. The findings have important implications for policy makers, suggesting that the availability of foods with lower nutritional value in school canteens disproportionally impacts students’ purchases relative to foods of higher nutritional value. Given current barriers to healthier food provision in school canteens( Reference Ardzejewska, Tadros and Baxter 33 – Reference Mâsse, Naiman and Naylor 35 ), further increasing the availability of healthier foods to ensure that the majority of purchases are for healthy foods represents a considerable challenge. Identification of strategies to support schools in the implementation of healthy canteen policies may be required. Revision of policy recommendations regarding the proportion of green items on canteen menus may also be required in Australian jurisdictions.
Previous studies of availability and child purchasing in schools( Reference Jones, Gonzalez and Frongillo 27 , Reference Fernandes 36 , Reference Taber, Chriqui and Powell 37 ) have relied on self-report data. The strengths of the present study include its use of objective observation data for students’ purchases and the rigorous assessment of canteen menus to classify menu items, based on a randomly selected sample of schools within one region of NSW. Nevertheless, the findings of the study should be interpreted in the context of a number of methodological characteristics. Primarily, the distribution of the availability of items in each category (red, amber, green) was limited. This was particularly the case for items categorised as ‘red’ where availability ranged from 0 to 17 %. The capacity of the study to describe the association between availability across a broader distribution was therefore limited. Furthermore, the cross-sectional design of the study does not permit causal attribution of the relationship between food availability and students’ purchases as it does not account for secular (temporal) changes in purchasing behaviour or other confounding factors. However, the analyses controlled for a number of prognostic factors (e.g. school socio-economic status, size, school allocation and environmental characteristics). Nevertheless, the study would be strengthened by use of a prospective study design, with a greater number of participating schools and repeated observations of student purchasing across the week.
Conclusions
The present study demonstrated a significant positive association between the availability of green, amber and red items, and their purchasing by students in school canteens. The results indicate that to achieve a majority of purchases from green items, the proportion of green items available on the menu needs to increase to at least 70 %. The identification of strategies to support schools to ensure that a greater availability of green items is achievable may assist in the implementation of this policy and improve student nutrition.
Supplementary material
To view supplementary material for this article, please visit https://doi.org/10.1017/S1368980018001726
Acknowledgements
Acknowledgements: The authors would like to thank the NSW Department of Education and Communities (DEC) for permitting the study to be conducted in Hunter region public schools. The authors would also like to acknowledge Katie Robertson, Emma Robson, Taya Wedesweiler, Kage Gold, Belinda Marshall, Sarah Preece, Tamara Orr, Meagan Rose, Loren Fullager, Erin Corbett, Melinda Cooper and Irena Patsan for their assistance with data collection. Financial support: This study received funding through the Australian Research Council (ARC) Linkage Project Scheme (grant number LP130101008). Infrastructure support was provided by the University of Newcastle, Hunter New England Population Health (HNEPH) and the Hunter Medical Research Institute (HMRI). The Australian Research Council had no role in the design, analysis or writing of this article. L.W. is supported by a Heart Foundation Future Leader Fellowship (grant number 101175) and a National Health and Medical Research Council Career Development Fellowship (grant number APP1128348). Conflict of interest: All authors declare they have no conflicts of interest. Authorship: L.W., N.N., J.W., S.L.Y., R.W., L.J., T.D., C.L. and K.R. contributed to the study method, design and intervention development. T.C.-M., L.J., T.R., A.G., T.D. and L.W. contributed to manuscript development. All authors reviewed, edited and approved the final manuscript. Ethics of human subject participation: This study was conducted according to the guidelines laid down in the Declaration of Helsinki and all procedures involving human subjects were approved by the Human Research Ethics Committees of the University of Newcastle (approval number H-2008-0343) and the Hunter New England Local Health District (06/07/26/4.04). The project was also approved by the NSW Department of Education and Communities (DEC; #2012277) and the State Education Research Applications Process (SERAP). Written informed consent was obtained from all participants.


