


Nuts are nutrient dense, and are particularly rich sources of cis-unsaturated fat, protein, fibre, antioxidants (e.g. Se) and a variety of vitamins (e.g. vitamin E, folate), minerals (e.g. Mg, Ca, K) and phytonutrients( Reference Alasalvar and Bolling 1 – Reference Ros 3 ). The nutrient profiles of nuts, including peanuts, likely contribute to their reported health benefits. The regular consumption of nuts is inversely associated with total mortality( Reference Grosso, Yang and Marventano 4 , Reference Hshieh, Petrone and Gaziano 5 ) and in particular with a reduction in the risk of CVD( Reference Ros 3 , Reference Kris-Etherton, Yu-Poth and Sabate 6 – Reference Sabate, Oda and Ros 8 ). This has led to recommendations to consume 30–42 g of nuts daily as part of a cardioprotective diet( Reference Tey, Brown and Chisholm 9 , 10 ).
Despite a wealth of information on the health benefits of regular nut consumption, population intakes of nuts are far lower than recommended( Reference Brown, Tey and Gray 11 – Reference O’Neil, Nicklas and Fulgoni 14 ). For example, the percentage of people who consume whole nuts among populations in New Zealand (NZ), Europe and the USA on a given day is 6–7 %( Reference Brown, Tey and Gray 11 – Reference O’Neil, Nicklas and Fulgoni 14 ). When total nut intake is considered, the percentage of consumers among populations in NZ, Australia, Europe and the USA is 29, 18, 27 and 34 %, respectively( Reference Brown, Tey and Gray 11 – 15 ). In addition, mean population intake of whole nuts in these countries is less than 3·5 g/d, although consumers on the day of the 24 h recall often achieve guidelines around amounts recommended.
Gaining a better understanding of how nuts are perceived in terms of both sensory and health effects, as well as the motivators of and barriers to regular nut consumption, could provide important information for developing public health messages aimed at improving these low levels of nut consumption and raising intakes towards recommended levels, thereby contributing to improving people’s health in progressively obesogenic environments. To our knowledge, only two studies have examined knowledge, perceptions, attitudes and barriers to nut consumption: one among individuals with low socio-economic status (n 124)( Reference Pawlak, Colby and Herring 16 ) and the other among individuals with or at risk of CVD and/or diabetes (n 85)( Reference Pawlak, London and Colby 17 ).
Among the low socio-economic cohort, Pawlak et al. found that only about one-third of participants believed nuts would help lower blood cholesterol levels( Reference Pawlak, Colby and Herring 16 ). In addition, only about one-quarter believed that nuts would lower risk of heart disease. Among those with or at risk of CVD and/or diabetes, approximately 40 % of participants were not aware that nuts could lower the risk of CVD and 33 % were unsure of the impact of nuts on blood cholesterol levels, with an additional 21 % disagreeing that nuts can reduce blood cholesterol concentrations( Reference Pawlak, London and Colby 17 ). These perceptions are at odds with data from both epidemiological studies( Reference Grosso, Yang and Marventano 4 , Reference Hshieh, Petrone and Gaziano 5 ) and clinical trials( Reference Sabate, Oda and Ros 8 ), which show reductions in CVD risk and lower total and LDL cholesterol concentrations among those regularly consuming nuts.
Although different types of nut differ in their nutrient content, they are all nutrient dense( Reference Alasalvar and Bolling 1 – Reference Ros 3 ). However, data from Pawlak et al. indicated that respondents’ knowledge of the nutrient content of nuts was poor( Reference Pawlak, Colby and Herring 16 ). Lack of knowledge on the nutrient composition and health effects of nuts could lead to lower intakes of nuts by some individuals.
Interestingly, 37 % of the low socio-economic cohort thought that eating nuts would cause weight gain( Reference Pawlak, Colby and Herring 16 ). However, unlike other energy-dense foods, the regular consumption of nuts has not been associated with weight gain and several epidemiological studies report that nut consumers are leaner than nut non-consumers( Reference Bes-Rastrollo, Sabate and Gomez-Gracia 18 – Reference Mozaffarian, Hao and Rimm 21 ). This is supported by clinical trials, which consistently report either no weight gain or less weight gain than predicted based on energy content alone( Reference Alper and Mattes 22 – Reference Tey, Brown and Gray 26 ). Explanations for this are the satiating effects of nuts( Reference Brennan, Sweeney and Liu 27 , Reference Tan and Mattes 28 ) and loss of metabolisable energy through increased faecal fat loss when nuts are consumed whole( Reference Ellis, Kendall and Ren 29 – Reference Novotny, Gebauer and Baer 32 ). Some of the confusion over nuts and their effects on body weight might stem from earlier dietary recommendations which advised against eating nuts because of their high fat content( Reference Hildreth, Hildreth and Mellinkoff 33 ).
Other barriers to nut consumption reported by the low socio-economic cohort included the cost and the high fat content of nuts( Reference Pawlak, Colby and Herring 16 ). However, the overall healthiness of nuts was acknowledged, with strong agreement among participants that they should eat nuts on most days of the week because nuts are healthy. Also, participants reported they would be more likely to eat nuts if their doctor recommended that they do so. Further, among those in the cohort with or at risk of CVD and/or diabetes, 64 % of participants agreed they would consume nuts on most days of the week if their doctor made a recommendation to do so( Reference Pawlak, London and Colby 17 ). This suggests that health professionals may have an important role to play in promoting the regular consumption of nuts.
These studies have provided some important insights into factors influencing nut consumption in specific population groups. However, their relatively small sample sizes (both n≤124) have not allowed precise estimates of effects and, more importantly, their samples were not intended to be representative of the general population, which means that whether their results also hold at this level is currently unknown. To the best of our knowledge, no large studies, using nationally representative samples, have examined the sensory and health perceptions of nuts and the motivators of and barriers to regular nut consumption. Therefore, given the low population intake of nuts and the lack of information on factors which influence nut consumption, the present study aimed to identify current barriers to and facilitators of regular nut consumption as well as perceptions of nuts in a nationally representative sample in NZ.
Methods
Study participants
This was a cross-sectional study using a national sample of NZ adults aged 18 years or over. A total of 1600 participants were randomly selected from the NZ electoral rolls. Oversampling of Māori using the Māori descent flag was used to achieve sufficient numbers for analyses involving this ethnicity. All NZ citizens and permanent residents 18 years or older are required by law to enrol to be registered on the Parliamentary Electoral Roll and the roll is estimated to include 92·6 % of all adults( 34 ). Recruitment took place from September to October 2014. All respondents were provided with an information sheet outlining the study and provided informed consent by completing the questionnaire. The study was conducted according to the guidelines laid down by the Declaration of Helsinki and all procedures involving human subjects were approved by the University of Otago Ethics Committee (reference number D14/288).
Survey development
Respondents completed either an online or a paper version of the questionnaire, which examined their perceptions of nuts (including nut butters) as well as barriers to and facilitators of nut consumption. The questionnaire content was based on previous work by Pawlak et al.( Reference Pawlak, Colby and Herring 16 ) and was further developed to include other relevant measures related to nut consumption. The questionnaire was developed by a group of researchers, including a registered dietitian, with expertise in the area of nuts and health, and was pre-tested and modified where appropriate among a group of forty-three members of the general public, establishing both face and content validity. The final version of the questionnaire included questions on nut consumption and intake, facilitators of and barriers to nut consumption, knowledge and perceptions of nuts, as well as participant demographics.
Survey content
Questions on their intake of ten types of nut (almonds, Brazil nuts, cashews, hazelnuts, macadamias, peanuts, pecans, pine nuts, pistachios and walnuts) and five types of nut butter commercially available in NZ (almond butter, cashew butter, hazelnut butter, peanut butter and walnut butter) were included in the questionnaire. For each nut type, respondents were asked about their frequency and usual quantity of consumption. Respondents were asked if they agreed or disagreed with carefully worded statements on perceptions on nuts, including their overall healthiness; energy, macronutrient and micronutrient content; affordability and availability; effects on satiety and weight; and effects on health, both generally and specific disease risks. They indicated answers using 5-point Likert-type items comprising responses of ‘strongly agree’=1, ‘agree’=2, ‘neither agree nor disagree’=3, ‘disagree’=4 and ‘strongly disagree’=5, with an additional option of ‘I don’t know’. Consumers, of nuts or nut butters, were asked about their reasons for consuming these foods. Correspondingly, nut non-consumers were asked about their reasons for not consuming these foods. A final section on demographics included age, sex, ethnicity (with the option to select multiple ethnicities), weight, height, smoking status, household income, level of education and employment status.
Survey administration
Both online and paper-based questionnaires were developed for the present study. For the online version of the questionnaire, Survey Gizmo© (Widgix Software, LLC, Boulder, CO, USA) was used as the survey tool to gather responses electronically. The paper questionnaire was posted to participants and returned using a reply-paid envelope. This mixed-mode design was aimed at maximising the response rate. Compared with the online questionnaire, the paper version used identical wording in the questions and was designed to be as visually similar as possible.
The study used a modified version of Dillman’s Tailored Design Method( Reference Dillman 35 ) comprising a total of four mail-outs. The first mail-out to all 1600 participants contained a cover letter and an information sheet regarding the study. The cover letter contained the web address for the online questionnaire. Users were provided with a login code so that each participant could complete the questionnaire only once. As an incentive, participants were informed that if they completed the questionnaire within 2 weeks, they would be eligible to go into a prize draw for one of five grocery vouchers worth $NZ 100 (about $US 72). A second mail-out was carried out 7 d after the first when a thank you and reminder postcard was sent to all 1600 participants. The postcard expressed the researchers’ appreciation to those who had completed the questionnaire and encouraged non-respondents to complete the survey. Responses from participants were monitored through the online survey software and those who completed the survey were taken off the mailing list based on their unique study ID numbers. This was done to separate them from the non-respondents who received a further invitation to participate in the study in the third mail-out. This third mail-out was sent 9 d after the second and consisted of a cover letter, a paper version of the questionnaire, a reply-paid envelope and a study-branded pen with the name of the research group on it. Participants were informed that upon their completion and return of the questionnaire within the following 2 weeks, they would be eligible for a prize draw for one of ten grocery vouchers worth $NZ 50 (about $US 36). The final mail-out was sent to all recipients of the third mail-out conducted 12 d later. It comprised a thank you and reminder postcard.
Statistical analysis
To obtain 95 % confidence intervals around proportions with a half-width of 0·05 and assuming a worst-case proportion of 0·5, 404 responses would be required (using asymptotic estimates with continuity correction). Assuming an overall response rate of 50 % and allowing for 2·5 % unusable data for any given question, 829 participants would be required. For subgroups which are a third of the sample, to have confidence interval half-widths of 0·075, 184 usable responses would be required, equivalent to 378 potential respondents in each subgroup. To achieve both goals, 1200 people would need to be selected from the electoral roll. Furthermore, to also provide confidence interval half-widths of 0·075 for estimates specific to Māori respondents overall, an additional sample of 400 from those indicating Māori descent would also need to be drawn from the rolls. Thus, the total number of participants approached was calculated to be 1600.
Survey weights were calculated based on NZ 2013 Census data using prioritised ethnicities (the highest category being Māori, then Asian people, other ethnicities (including Pacific peoples, MELAA (Middle Eastern/Latin American/African) and other ethnic groups) and finally European including NZ European) using Statistics New Zealand’s level one ethnicity categories)( 36 ), age groups (under 30 years, between 30 and 64 years, 65 years or over) and sex (male or female), so that respondents were representative of the Census population estimates in terms of combinations of these three demographics. All statistical analyses and percentages incorporate these weights, while numerical counts are based on unweighted data.
Characteristics of respondents are presented as frequencies and percentages for categorical variables and using means and standard deviations for continuous variables. Responders were identified in the original sample of 1600 and response rates calculated overall and by characteristics in the Electoral Roll (age group, sex (with some ambiguous), Māori descent and NZ Deprivation group). Response rates were compared between levels of these variables using ordinary χ 2 tests. To assess associations between beliefs and perceptions of nuts and intake categories, Kendall’s τ b correlations were calculated for each belief or perception item and each of nut and nut butter intake categories separately (excluding those who answered ‘I don’t know’ to the belief or perception question). To identify associations between reasons for consuming nuts and nut butters and intakes among consumers, Mann–Whitney U tests were used to compare nut and nut butter intake categories between those endorsing and those not endorsing each reason. Harrall’s c-index was used to quantify the strength of these associations. Univariable survey regression (logistic for binary variables and linear for ordinal variables) was used to initially identify associations with predictors comprising: sex (male, female), age (continuous), BMI category (<25·0 kg/m2, 25·0–29·9 kg/m2, ≥30·0 kg/m2), annual household income (≤$NZ 30 000 (≤$US 21 600), $NZ 30 001–70 000 ($US 21 600–50 400), ≥$NZ 70 001 (≥$US 50 400)), highest level of education (less than high school, completed high school, post-high school non-degree, university degree or above), smoking status (current, not current including former) and prioritised ethnicity (Māori, Asian, Other, European). For age, the addition of a quadratic term was investigated to assess, and where appropriate to model, non-linearities. Where there was evidence of a quadratic association, this is described in notes to the tables which present both linear and quadratic (after centring) effects and identify the minima or maxima as appropriate. For categorical variables, Wald tests were used to identify statistically significant evidence of association and post hoc tests were performed only where this initial test was statistically significant, without further adjustment for multiplicity. Those variables with univariable P<0·25 were included in the relevant multivariable model. For the logistic regression models which were subject to the guidelines from Peduzzi et al.( Reference Peduzzi, Concato and Kemper 37 ) and where not all such variables could be accommodated, they were included in the multivariable model in the order of sex, age, BMI, income, education, smoking and prioritised ethnicity (an order determined based on existing evidence and the potential usefulness of knowing about an association involving each variable). Where there was quasi-complete separation for logistic regression models, collapsing levels of the categorical variable was considered along with removing the problematic variable from the model. For examining differences between nut and nut butter avoiders, the χ 2 test was used when there were no more than 20 % of expected cell frequencies below 5 but there were too few respondents in each category based on Peduzzi et al.’s guidelines( Reference Peduzzi, Concato and Kemper 37 ), and Fisher’s exact test otherwise. The statistical software package Stata version 14·2 was used for all statistical analyses. All statistical tests were two-sided and P<0·05 was considered statistically significant.
Results
Demographics
A response rate of 44·4 % (n 710) was achieved. The characteristics of study respondents are shown in Table 1 (numbers of missing responses for each question can be obtained by subtracting responses from 710). The mean age was 52·9 years and 52·7 % were women. A total of 69·4 % of the respondents self-identified as NZ European, 11·3 % as Māori, 2·2 % as Pacific Islanders and 8·5 % as Asian. The mean BMI was 27·4 kg/m2, with 39·8 % classified as having a normal BMI, 36·9 % as having a BMI of 25·0–29·9 kg/m2, and 22·3 % as having a BMI of ≥30·0 kg/m2. Among the respondents, 10·8 % were current smokers. Most participants had a qualification beyond secondary school. Over two-thirds of respondents reported they were currently working and one-quarter reported total annual household income of $NZ 100 000 or greater (although 144 respondents had missing data for this question).
Table 1 Characteristics of the survey participants (n 710); a nationally representative sample of adults aged 18 years or over, New Zealand, September–October 2014
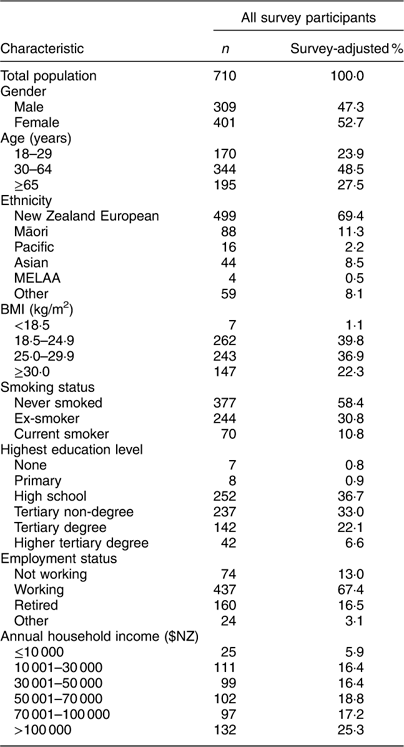
MELAA, Middle Eastern/Latin American/African.
One respondent removed the identification number from his/her survey and we were not able to note him/her as a responder in the original sample of 1600. Excluding this responder, response rates varied by NZ Deprivation group (χ 2 P<0·001), with the highest response rate of 53·6 % in the lowest deprivation (highest socio-economic status) group (NZ Dep deciles 1–3), declining to 45·8 % in the middle group (NZ Dep deciles 4–7) and 33·8 % in the most deprived (lowest socio-economic status) group (NZ Dep deciles 8–10). Those indicating Māori descent in the Electoral Roll (n 400) were less likely to respond (30·3 %) compared with non-Māori (49·0 %, χ 2 P<0·001). Response rates increased with age (χ 2 P<0·001), being 26·6 % for 18–29-year-olds, 45·3 % for 30–64-year-olds and 56·8 % for those aged ≥65 years (χ 2 P<0·001). Sex was determined from titles used in the Electoral Roll for 1437 (89·8 %) of the sample, with the remainder (n 163, 10·2 %) either having gender-neutral titles (e.g. Doctor or Professor) or not providing a title. Those with female titles had higher response rates (46·7 %) than those with male titles (39·3 %), but the highest rate of response was from those not classified as male or female based on their title (54·6 %, χ 2 P<0·001).
Intake of nuts and nut butters
About 16 % of respondents reported eating nuts daily, 8 % on most days (approximately five times per week), 20 % on some days (two to four times per week), 13 % once per week, 19 % two to three times per month, and 19 % once per month or less. About 6 % reported that they did not consume nuts. In terms of nut butters, 7 % of respondents reported eating nut butters daily. Approximately 5 % reported eating nut butters on average most days of the week (approximately five times per week), 16 % two to four times per week, 13 % once per week, 12 % two to three times per month, and 17 % monthly or less. Thirty per cent of respondents reported never consuming nut butters.
Perceptions of nuts and nut butters among the general public
Table 2 shows participants’ responses on perceptions regarding nuts and nut butters. More than half of all respondents agreed that nuts and nut butters are healthy, high in protein and fat, and are filling. Of the fifteen statements about nuts and nut butters, the statements ‘They are healthy’ and ‘They are high in protein’, both strongly supported by the literature, received the strongest agreement (mean score=2·1), with 1 indicating ‘strongly agree’ and 5 indicating ‘strongly disagree’. In contrast, the statement ‘They are low in energy/calories’, strongly contradicted by the literature, received the strongest disagreement (mean score=3·6). The five statements which received the highest percentages of ‘I don’t know’ responses were ‘Eating them can help lower people’s risk of diabetes’ (52·3 %; current evidence uncertain), ‘Some of them are high in selenium’ (42·7 %; supported by current evidence), ‘Eating them can increase people’s total blood cholesterol’ (41·9 %; contradicted by current evidence), ‘Some of them are high in iron’ (41·2 %; true for some nut types) and ‘Eating them can increase people’s risk of cardiovascular disease’ (38·3 %; contradicted by current evidence).
Table 2 Beliefs and perceptions of nuts and nut butters (survey-adjusted percentages and mean scores) among a nationally representative sample of adults aged 18 years or over, New Zealand, September–October 2014
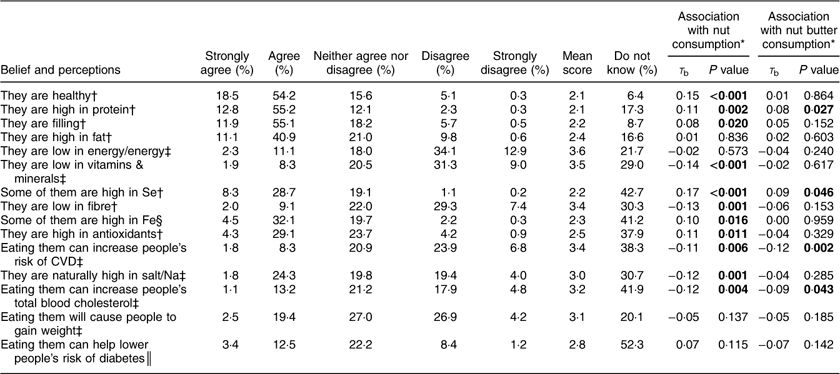
Responses scored as ‘strongly agree’=1, ‘agree’=2, ‘neither agree nor disagree’=3, ‘disagree’=4, ‘strongly disagree’=5.
Note that some statements are supported by current evidence and some are worded in contradiction to current evidence.
* Kendall’s τ b correlation with overall frequency of consumption (for those who provided an answer other than ‘I don’t know’), where positive values indicate higher intakes with greater agreement with the statement. Significant P values are indicated in bold font.
† Statements that are supported by current evidence.
‡ Statements that are contradicted by current evidence.
§ Some nuts such as pistachios, cashews and almonds contain useful (>4 mg non-haem Fe/100 g) amounts of Fe, but bioavailability and significance will rely on other dietary factors.
║ Statements where current evidence is uncertain.
More positive beliefs and perceptions of nuts were associated with higher nut intake frequency categories for eleven of the fifteen items (all P≤0·020), the exceptions being about items about fat, energy, weight gain and diabetes risk. For nut butters, only four of the items were statistically significant, namely protein and Se content and effects on cholesterol and CVD risk (all P≤0·046).
Associations with perceptions of nut consumption
Table 3 shows the adjusted models of perceptions of nuts. Women were more likely than men to perceive nuts as being high in antioxidants (P=0·014) and filling (P=0·002). Older respondents agreed more that nuts are low in energy or calories (P=0·020) and disagreed more that nuts increase total blood cholesterol (P=0·008), which is contradicted by the literature. The only association with BMI categories was for salt/sodium content where those with higher BMI were in stronger agreement with the statement that nuts are naturally high in salt (P=0·001), which is also contradicted by the literature, although the only pairwise differences were between obese and both normal weight and overweight. The most consistent pattern of associations was with income, where higher income categories were associated with greater disagreement with nuts being low in energy or calories (P=0·015), nuts being low in fibre (P=0·025), nuts being high in salt (P=0·015), nuts cause weight gain (P=0·048) and nuts increase total blood cholesterol (P=0·014). While there was evidence for an association with the statement nuts are high in fat (P=0·030), post hoc tests found the only significant difference to be that those on high incomes (≥$NZ 70 001) were more likely to agree compared with those on moderate incomes, with those on low incomes (≤$NZ 30 000) falling in the middle. Education displayed an inverse-J association, with those having high school or post-high school non-degree qualifications stating more agreement that nuts are low in energy or calories compared with those with university-level qualifications. Those with post-high school non-degree qualifications also stated more agreement that nuts are high in antioxidants compared with those who completed high school. Current smokers agreed more that nuts are low in energy or calories (P=0·045). The only ethnicity-related difference was with the perception that nuts are high in salt/sodium, with Māori expressing more agreement than European or Asian peoples.
Table 3 Predictors of perceptions of nuts (P value, with the difference and 95 % confidence interval beneath) among a nationally representative sample of adults aged 18 years or over, New Zealand, September–October 2014
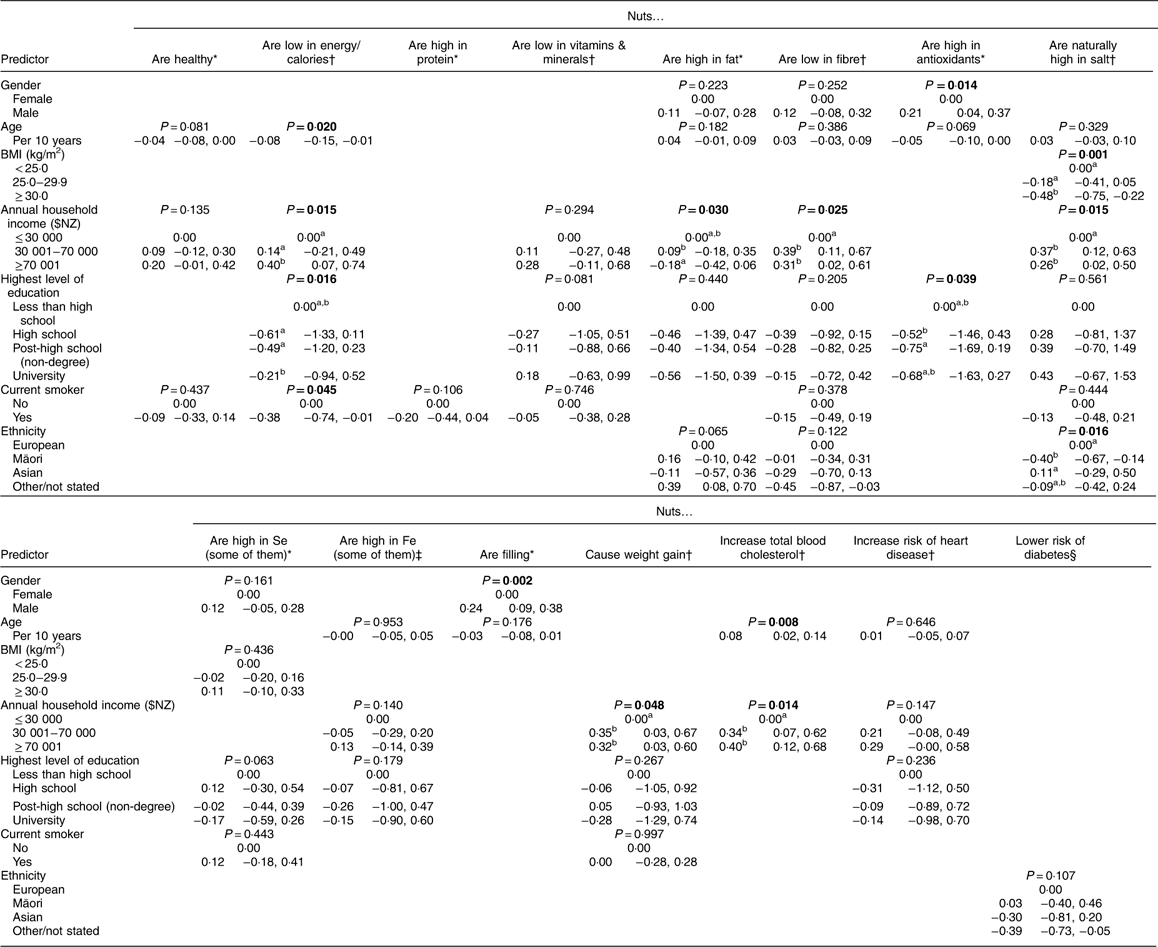
Higher values reflect more disagreement with the statement on a scale from 1=‘strongly agree’ to 5=‘strongly disagree’. Cells are blank where this variable did not achieve P<0·25 in the univariable model. Significant values are indicated in bold font. Where the overall P value is statistically significant, values that share a superscript letter are not statistically different.
Note some statements are supported by evidence and some are worded in contradiction to evidence.
* Statements that are supported by current evidence.
† Statements that are contradicted by current evidence.
‡ Some nuts such as pistachios, cashews and almonds contain useful (>4 mg non-haem Fe/100 g) amounts of Fe, but bioavailability and significance will rely on other dietary factors.
§ Statements where current evidence is uncertain.
Reasons for eating nuts and/or nut butters
Table 4 lists the reasons for eating nuts and/or nut butters among nut consumers in the survey. The top five reasons both nut and nut butter consumers chose to eat nuts were because: they liked the taste of nuts, they believed that nuts are good for health, they thought nuts were a good source of protein or a good source of energy/calories, or because nuts are convenient and portable. For all listed reasons, higher percentages of women selected these as motivation to eat nuts compared with men.
Table 4 Reasons for eating nuts and nut butters among nut consumers in the survey (survey-adjusted percentages) of a nationally representative sample of adults aged 18 years or over, New Zealand, September–October 2014
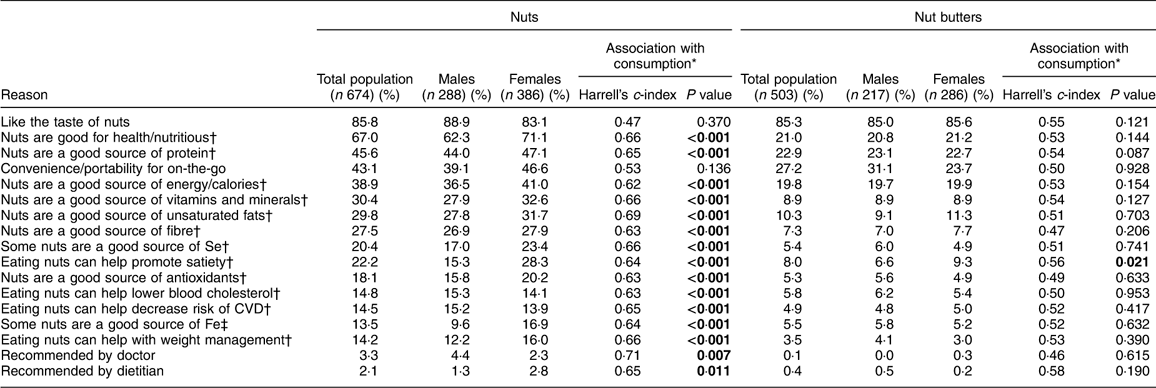
* P values from Mann–Whitney U tests (significant P values indicated in bold font), with positive associations (Harrell’s c-index >0·5) indicating higher consumption for those endorsing a reason and negative associations (Harrell’s c-index <0·5) indicating lower consumption for those endorsing a reason.
† Statements that are supported by current evidence.
‡ Some nuts such as pistachios, cashews and almonds contain useful (>4 mg non-haem Fe/100 g) amounts of Fe, but bioavailability and significance will rely on other dietary factors.
Endorsement of a reason for consuming nuts was associated with higher intakes for fifteen of the seventeen items (all P≤0·007), the exceptions being for taste and convenience. For nut butters, only one statistically significant association was found, namely for promoting satiety (P=0·021).
Predictors of the reasons for choosing to consume nuts
The predictors of reasons for nut consumption among nut consumers (n 674) are shown in Table 5. Men had 48 % (95 % CI 0·32, 0·87; P=0·012) lower odds of choosing to eat nuts due to nuts being ‘a good source of iron’ and 55 % (95 % CI 0·28, 0·74; P=0·002) lower odds of choosing to eat nuts due to their satiating effects, compared with women. For every 10-year increase in age, there was a 47 % (95 % CI 1·23, 1·76; P<0·001) increase in the odds of a consumer eating nuts because it ‘can help lower blood cholesterol’ and a 41 % (95 % CI 1·23, 1·61; P<0·001) increase in the odds of a consumer eating nuts because it ‘can help decrease risk of cardiovascular disease’. In addition, as age increased, respondents were more likely to choose to eat nuts because they are a good source of fibre (P=0·039), Se (P=0·036) and antioxidants (P=0·002). Conversely, for every 10-year increase in age, there was a 23 % (95 % CI 0·67, 0·88; P<0·001) reduction in the odds of respondents choosing to eat nuts because they are ‘convenient and portable’.
Table 5 Predictors of reasons for nut consumption among nut consumers (n 674; P value, with the odds ratio and 95% confidence interval beneath) in a nationally representative sample of adults aged 18 years or over, New Zealand, September–October 2014
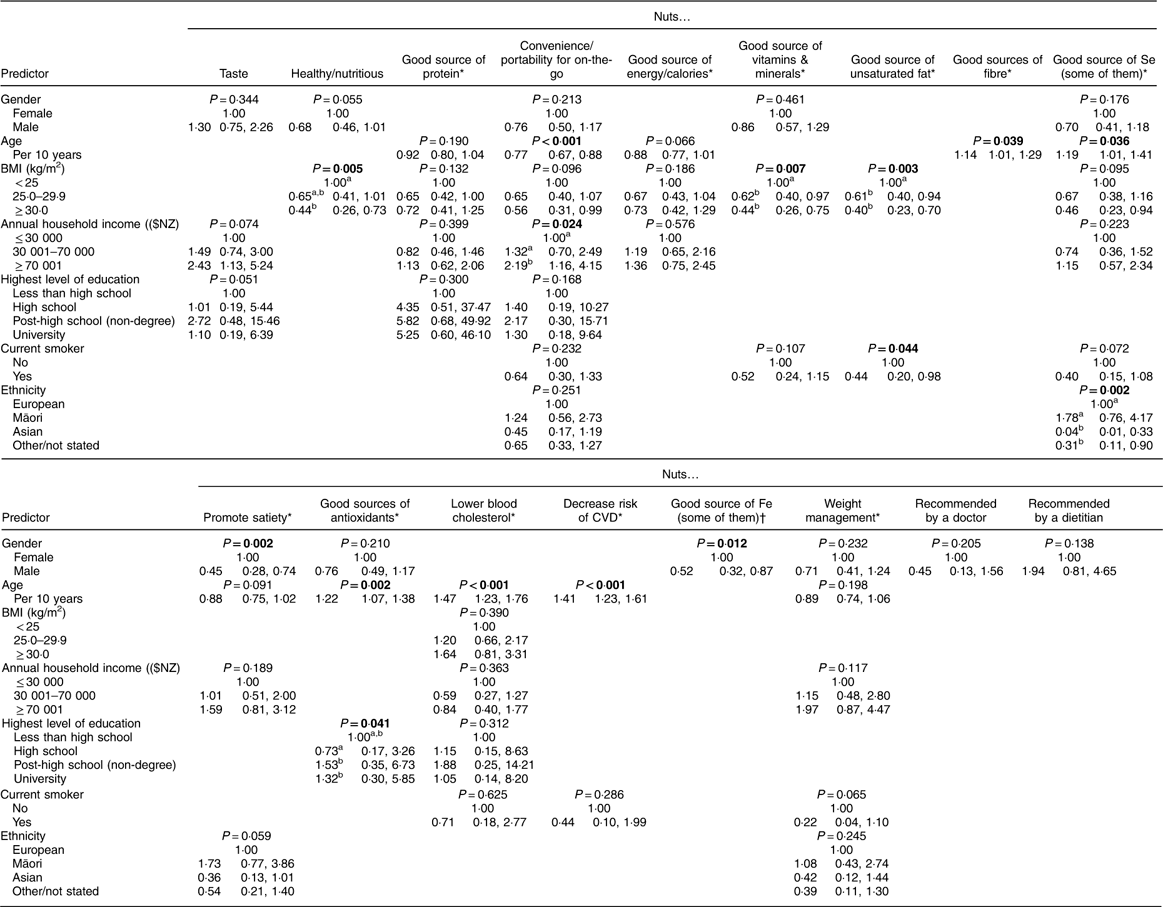
Cells are blank where this variable did not achieve P <0·25 in the univariable model. Significant P values are indicated in bold font. Where the overall P value is statistically significant, values that share a superscript letter are not statistically different.
* Statements that are supported by current evidence.
† Some nuts such as pistachios, cashews and almonds contain useful (>4 mg non-haem Fe/100 g) amounts of Fe, but bioavailability and significance will rely on other dietary factors.
Nut consumers who had a BMI of 25·0–29·9 kg/m2 or ≥30·0 kg/m2 had 38 % (95 % CI 0·40, 0·97; P=0·036) or 56 % (95 % CI 0·26, 0·75; P=0·002) lower odds of choosing to eat nuts because nuts are ‘a good source of vitamins & minerals’, respectively, compared with consumers with a BMI of <25 kg/m2. Overweight and obese consumers were less likely to eat nuts because they are ‘a good source of unsaturated fat’ compared with those with a healthy BMI (both pairwise P≤0·025). Obese consumers were significantly less likely than normal-weight respondents to consume nuts because they were ‘healthy and nutritious’ (pairwise P=0·001).
Current smokers had 56 % (95 % CI 0·20, 0·98: P=0·044) lower odds of choosing to eat nuts because nuts are ‘a good source of unsaturated fat’, compared with non-smokers. Consumers who earned a total annual household income of ≥$NZ 70 001 were more likely to choose the convenience and portability of nuts as one of their reasons for choosing to eat nuts, compared with consumers who earned ≤$NZ 30 000 and those earning N$Z 30 001–70 000 per annum (both pairwise P≤0·035). Overall, there was a difference by education level in the likelihood of choosing to eat nuts because they are ‘a good source of antioxidants’ (P=0·041). Pairwise comparisons showed that those with post-secondary and university education were significantly more likely to eat nuts for this reason compared with those with only secondary-level education (both pairwise P≤0·037). Compared with NZ European and Māori consumers, Asian consumers were significantly less likely to choose to eat nuts because they are ‘a good source of selenium’ (both pairwise P≤0·003).
Predictors of the reasons for nut butter consumption
The predictors of reasons for nut butter consumption among nut butter consumers (n 503) are shown in Table 6. For every 10-year increase in consumer age, there was a 21 % (95 % CI 1·02, 1·45; P=0·030) increase in the odds of a consumer eating nut butters because they are ‘a good source of vitamins & minerals’ and a 55 % (95 % CI 1·29, 1·86) increase in the odds because they ‘can help decrease risk of cardiovascular disease’ (P<0·001).
Table 6 Predictors of reasons for nut butter consumption among nut butter consumers (n 503; P value, with the odds ratio and 95% confidence interval beneath) in a nationally representative sample of adults aged 18 years or over, New Zealand, September–October 2014
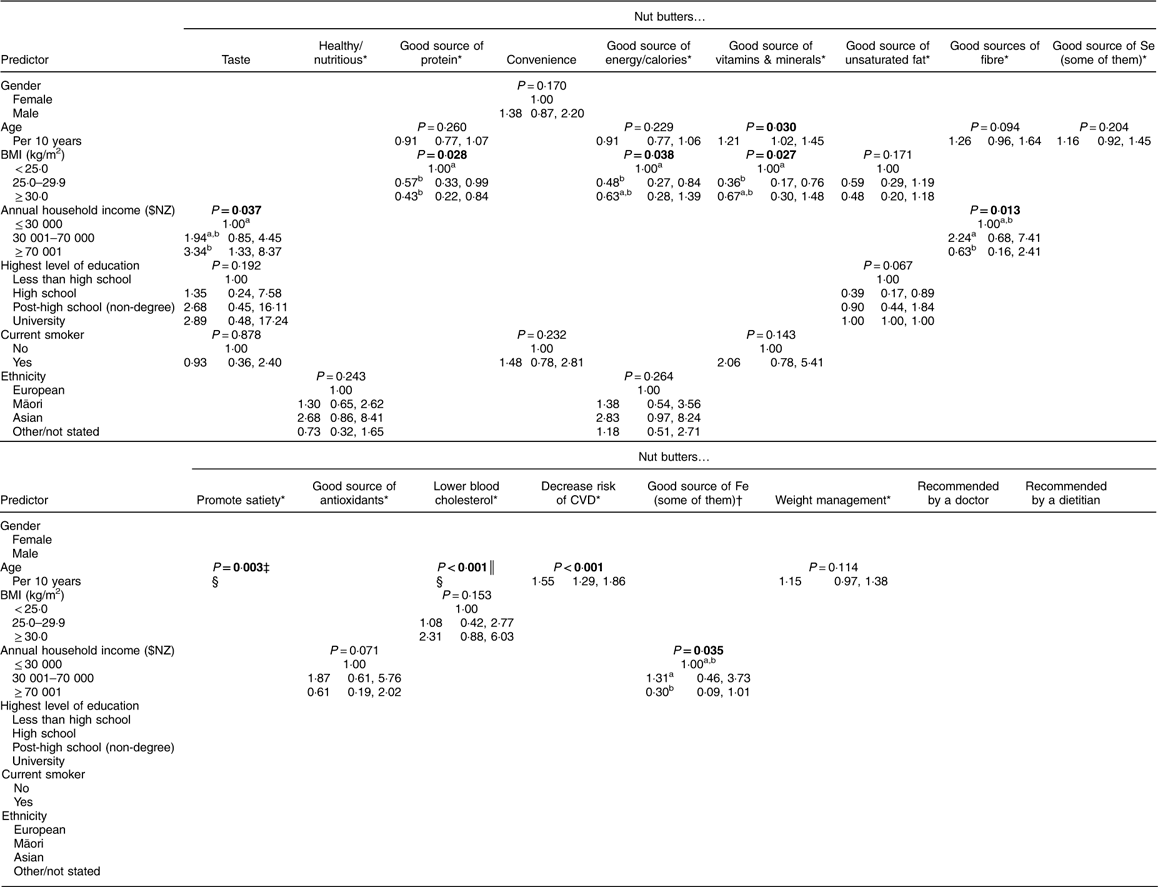
Cells are blank where this variable did not achieve P <0·25 in the univariable model. Significant P values are indicated in bold font. Where the overall P value is statistically significant, values that share a superscript letter are not statistically different.
* Statements that are supported by current evidence.
† Some nuts such as pistachios, cashews and almonds contain useful (>4 mg non-haem Fe/100 g) amounts of Fe, but bioavailability and significance will rely on other dietary factors.
‡ P value is for Wald composite test of both a linear trend (OR=1·20/10 years; 95 % CI 0·96, 1·49; P=0·105) and a quadratic trend after centring (OR=0·99/10 units; 95 % CI 0·98, 1·00; P=0·048), creating an n-shaped association with the highest probability at age 61 years.
§ Selected for inclusion in the multivariable model but subsequently excluded due to quasi-complete separation.
║ P value is for Wald composite test of both a linear trend (OR=1·48/10 years; 95 % CI 1·12, 1·95; P=0·006) and a quadratic trend after centring (OR=0·98/10 units; 95 % CI 0·97, 0·99; P=0·003), creating an n-shaped association with the highest probability at age 63 years.
Nut butter consumers who had a BMI of 25·0–29·9 kg/m2 or ≥30·0 kg/m2 had 43 % (95 % CI 0·33, 0·99; P=0·047) or 57 % (95 % CI 0·22, 0·84; P=0·014) lower odds of choosing to eat nut butters because nut butters are ‘a good source of protein’, respectively, compared with consumers with a BMI of <25·0 kg/m2. In addition, those in the overweight category had 52 % (95 % CI 0·27; 0·84: P=0·011) and 64 % (95 % CI 0·17, 0·76; P=0·007) lower odds of consuming nuts because they are ‘a good source of energy’ and ‘a good source of vitamins & minerals’, respectively, compared with those in the normal-weight category.
Nut butter consumers who earned a total annual household income of ≥$NZ 70 001 had 3·34 times (95 % CI 1·33, 8·37; P=0·010) the odds of choosing to eat nut butters because they liked the taste, compared with consumers who earned ≤$NZ 30 000 per annum. Conversely, consumers who earned a total annual household income of $NZ 30 001–70 000 were more likely than consumers who earned an income of ≥$NZ 70 001 to say they ate nut butters because they were ‘a good source of fibre’ (OR=3·58; 95 % CI 1·49, 8·59, P=0·004) or ‘a good source of iron’ (OR=4·44; 95 % CI 1·42, 13·92; P=0·001).
Reasons for not eating nuts and/or nut butters
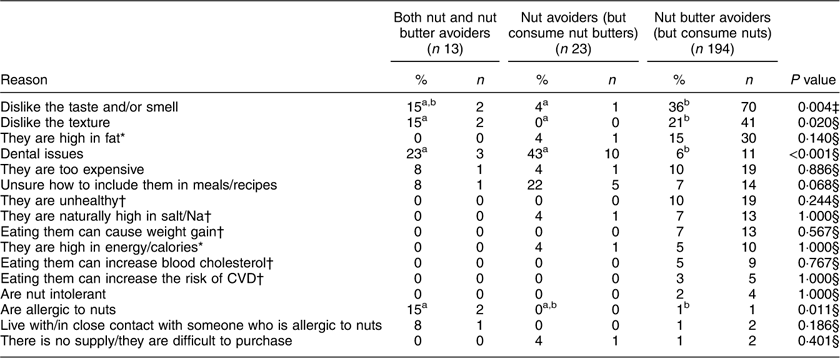
Table 7 lists the reasons for not eating nuts and/or nut butters among the non-consumers in the survey. There were twenty-three respondents who reported not eating any nuts but did eat nut butters, 194 who reported not eating any nut butters but did eat nuts, and thirteen respondents who reported not eating either nuts or nut butters. Dental issues was the reason most frequently selected by respondents who avoided nuts (43 %) and those who avoided both nuts and nut butters (23 %). The top five reasons selected by respondents who avoided nut butters were because they disliked the taste and/or smell, they disliked the texture, they considered nut butters to be unhealthy, high in fat, and because nut butters were too expensive. Nut butter avoiders were more likely to report they disliked the taste/smell/texture compared with nut avoiders (both P≤0·020). Conversely, nut avoiders were more likely to avoid eating nuts because of dental issues, compared with nut butter avoiders (P<0·001).
Table 7 Reasons for not eating nuts and/or nut butters, nuts or nut butters (survey-adjusted percentages and unweighted numbers) among a nationally representative sample of adults aged 18 years or over, New Zealand, September–October 2014
Where the overall P value is statistically significant, values that share a superscript letter are not statistically different.
* Statements that are supported by current evidence.
† Statements that are contradicted by current evidence.
‡ P value for difference between avoider groups using χ 2 test.
§ P value for difference between avoider groups using Fisher’s exact test.
Discussion
To the best of our knowledge, the present study is the first to assess the reasons for consuming or avoiding nuts, as well as perceptions of nuts, in a large nationally representative sample. Approximately 16 and 8 % of our respondents reported eating nuts and nut butters daily, respectively, whereas just under a third reported they did not consume nuts and/or nut butters. Other studies that have used representative samples have employed 24 h recalls to estimate nut consumption, as opposed to the FFQ used in the present study, making direct comparisons problematic. Nevertheless, previous studies have reported that the percentage of respondents consuming whole nuts on the day of the 24 h recall was about 6–7 %( Reference Brown, Tey and Gray 11 – Reference O’Neil, Nicklas and Fulgoni 14 ). The percentage consuming nut butters was higher in NZ and the USA (about 7–8 %)( Reference Brown, Tey and Gray 11 , Reference King, Blumberg and Ingwersen 38 ) compared with Europe (about 1 %)( Reference Jenab, Sabate and Slimani 12 ).
More than half of our respondents agreed that nuts are healthy, filling, and high in protein and fat. However, there were some important gaps in respondents’ knowledge, with about 40 % not aware of the effects of nut consumption on lowering blood cholesterol and the risk of CVD. Liking the taste of nuts was reported as the top reason both nut and nut butter consumers chose to eat nuts, while dental issues was the most frequently selected reason by both nut and nut butter avoiders. Positive beliefs and perceptions of nuts were generally associated with higher intakes, but this finding was much less evident for nut butters. Those endorsing all but two of the positive reasons for eating nuts had higher intakes compared with those not endorsing that particular reason, including recommendations by a doctor or dietitian, again a finding not replicated in nut butters. These findings provide important information to guide and develop public health strategies to improve nut consumption among the general population.
The mean scores for the perception questions indicate that respondents generally agreed that nuts are healthy, filling, high in protein, fat, fibre and antioxidants, and some nuts are high in Se. Previous studies examining the perceptions of nuts have used only small, non-representative samples which have included low-income women (n 124)( Reference Pawlak, Colby and Herring 16 ) or those with or at risk of diabetes and/or CVD (n 85)( Reference Pawlak, London and Colby 17 ). Despite the differences in study populations, there are important similarities in the pattern of results. For example, in the low-income cohort, Pawlak et al. also found that the majority of respondents perceived that nuts were high in energy and fat( Reference Pawlak, Colby and Herring 16 ). They also most strongly agreed with the statement that they should eat nuts on most days of the week because nuts are healthy. In the cohort of those with or at risk of chronic disease, nearly half of respondents agreed with the latter statement( Reference Pawlak, London and Colby 17 ).
In our study, we specifically asked about Se because NZ soils are low in Se, meaning intake of this nutrient is relatively low( Reference Thomson 39 ). Brazil nuts are a rich, available source of Se( Reference Thomson 40 ) and given the added interest in Se in NZ, we were interested to see if this was known by the general public. Nearly 40 % of respondents agreed that some nuts are high in Se. In the two small US cohorts, only about 20 % of participants were able to identify the nut containing the highest Se content( Reference Pawlak, Colby and Herring 16 , Reference Pawlak, London and Colby 17 ). This suggests publicity regarding Se in NZ may have improved knowledge in this area.
Two important perceptions of nuts which are at odds with current scientific literature relate to the hypocholesterolaemic effects of nuts and their inverse association with the risk of CVD. Nuts are high in cis-unsaturated fatty acids and bioactive constituents, such as plant sterols, which have been shown to favourably affect blood plasma lipids and lipoproteins( Reference Sabate, Oda and Ros 8 , Reference Griel and Kris-Etherton 41 , Reference Mukuddem-Petersen, Oosthuizen and Jerling 42 ). Moreover, there is strong and consistent evidence that there is a negative association between nut consumption and risk of CVD( Reference Grosso, Yang and Marventano 4 , Reference van den Brandt and Schouten 43 ). However, these facts were not well known among our sample. Approximately 40 % of respondents did not know about the relationship between nuts and the effects on blood cholesterol and CVD risk. In addition, only 15 % of respondents stated that they ate nuts because they can help lower cholesterol and can decrease the risk of CVD. These are similar to the findings of Pawlak et al., who found among low-income participants that about 60 % did not know that nuts may help reduce cholesterol and lower the risk for a heart attack( Reference Pawlak, Colby and Herring 16 ). In addition, among those at risk of CVD, Pawlak et al. found that over 30 % of participants were unaware of the cholesterol-lowering properties of nuts and a further 20 % disagreed that nuts could have this effect( Reference Pawlak, London and Colby 17 ). Taken together, these results clearly reflect a disconnect between scientific findings and the perceptions among some members of the general public regarding the health aspects of nuts. Given that CVD remains the leading cause of mortality worldwide( 44 ), the results of our study clearly show there are nutrition education opportunities which could translate into important benefits through the promotion of nuts as part of a cardioprotective diet.
Respondents were even less clear on the effect of nuts on diabetes. More than half of our respondents said that they did not know the effects of nut consumption on risk of diabetes. This is similar to the findings of both studies by Pawlak et al., where 62 % of the low-income cohort( Reference Pawlak, Colby and Herring 16 ) and 42 % of those with or at risk of diabetes and CVD( Reference Pawlak, London and Colby 17 ) were unaware of any beneficial effects of nuts on diabetes. This is not surprising, considering the inconsistency in the research findings on the relationship between the development of type 2 diabetes and nut consumption( Reference Afshin, Micha and Khatibzadeh 45 – Reference Zhou, Yu and He 48 ). Continued research in this area is required to clarify this association.
When examining reasons for eating nuts among consumers, our respondents indicated that they did so because they like the taste of nuts, they considered nuts to be healthy/nutritious and good sources of protein and energy, and were convenient and portable. These motivating reasons for eating nuts could be incorporated into public health campaigns to promote nut consumption.
Interestingly, very few (2–3 %) individuals ate nuts on the recommendation of a doctor or dietitian. Pawlak et al. reported that about a quarter of their participants agreed that eating nuts was consistent with advice from their doctor( Reference Pawlak, London and Colby 17 ). These participants had or were at risk of CVD and diabetes, and may have seen a doctor or dietitian more than the participants in the current study. In the cohort of low-income women studied by Pawlak et al., there was general disagreement that eating nuts daily was consistent with advice from their doctor( Reference Pawlak, Colby and Herring 16 ). Both studies by Pawlak et al. indicated strong agreement among participants that they would eat nuts if recommended to do so by their doctor. In the present study, in response to a question about whether they would consume more nuts if asked to by a doctor, 52·9 % indicated they would (10·3 % strongly agreed and 42·6 % agreed), with 10·6 % unsure (data not shown). Therefore, encouraging health professionals to promote nut consumption could be an effective strategy to improve on the current low levels among the general public.
Very few respondents chose to eat nuts to help with weight maintenance. This may stem from the fact that nuts are high in fat and energy, and may be perceived to cause weight gain. The response to the question ‘eating nuts will cause weight gain’ produced a mixed response, with about a fifth agreeing, a third disagreeing, a third neither agreeing nor disagreeing, and nearly a quarter reporting they did not know. Pawlak et al. reported that 87 % of their high-risk cohort agreed that nuts would cause weight gain( Reference Pawlak, London and Colby 17 ). There is obviously some confusion regarding this issue. Epidemiological studies suggest nut consumers are leaner than nut non-consumers( Reference Bes-Rastrollo, Sabate and Gomez-Gracia 18 – Reference Mozaffarian, Hao and Rimm 21 ), and intervention studies show no or less-than-predicted weight gain when nuts are added to the regular diet( Reference Alper and Mattes 22 – Reference Tey, Brown and Gray 26 ). Clarifying these facts for the general public may help overcome this potential barrier to regular nut consumption and promote greater nut intakes.
We examined predictors for reasons consumers chose to consume nuts and nut butters. We found that men were far less likely to choose to eat nuts because they are satiating or a good source of Fe, compared with women. Women also tended to choose to eat nuts because they are healthy and nutritious. This indicates women are perhaps more conscious of their health and food choices, and subsequently more aware of the possible health benefits of nuts. Age was also a predictor for some of the reasons our respondents chose to eat nuts. We found that for every decade increase in age, nut consumers were more likely to eat nuts because they are a good source of fibre, Se and antioxidants, and older nut butter consumers were more likely to eat nut butters because they promote satiety and are a good source of vitamins and minerals. It is also noteworthy that for every decade increase in age, consumers were more likely to eat nuts and nut butters because it can lower blood cholesterol and decrease risk of CVD. It is possible that with increasing age, consumers become more aware of the benefits of nut consumption or this may reflect cohort effects with nuts perceived differently by different generations. Some support for this was found with older respondents being less likely to see nuts as increasing blood cholesterol. It is also possible that increased awareness of the benefits of nut consumption could be due to health issues that increase with age.
We also found that the higher the total annual household income of a nut consumer, the more likely convenience and portability of nuts was selected as a reason nuts were consumed. Additionally, nut butter consumers with higher total annual household income were more likely to choose to eat nut butters because of the taste. This is possibly because these respondents would have more financial ability to choose nut butters of their choice.
Among respondents who chose not to consume nuts and/or nut butters, there were far more nut butter avoiders than nut avoiders. While the dislike of the taste and/or smell was the predominant reason for nut butter avoiders, dental issues was the major concern for nut avoiders. This would presumably be of concern for those with poor dental health and difficulties with mastication. Nuts have been found to be beneficial to the health of older adults( Reference Grosso and Estruch 49 ) and these dentition issues could be preventing the realisation of these benefits for some. Analysis of the comments from nut avoiders (data not shown) indicated concern with health issues such as migraine triggers and skin conditions, or they reported they did not eat nuts because it is not part of their food culture. Some of the comments made by nut butter avoiders indicated that their decisions were based on a preference for unprocessed nuts and the fact they did not like the additives in nut butters such as chocolate, wheat by-products, sugar, salt and oil. It is also noteworthy that 22 % of nut avoiders were unsure of how to incorporate nuts into their meals and recipes. This could easily be addressed by providing consumers with a variety of ideas on how to add nuts to meals/recipes in both public health messages and promotional materials developed by nut growers and councils. The number of respondents citing expense as a reason for not consuming nuts or nut butters was very small and did not appear to vary by income (data not shown).
An important aspect of the current study is that it was the first large cross-sectional study to assess the beliefs, attitudes and perceptions of nut consumption in a national sample of the general population. The resulting representativeness of our sample is a key strength. We employed a vigorous survey method, adapted from Dillman’s Tailored Design Method( Reference Dillman 35 ) and included incentives to help increase the survey response rate. Additionally, our survey used a mixed-mode design, with both a web and paper mail version of the questionnaire to enhance the response rate( Reference Cobanoglu, Warde and Moreo 50 ).
There are also a number of limitations that should be considered when interpreting the present study’s results. First, our survey was self-administered and there is the possibility that some respondents did not fully understand all questions. Although the response rate of 44 % was slightly below our expectation of 50 %, this is comparable to other mail surveys conducted across Australasia( Reference Lee, Dobson and Brown 51 , Reference Timperio, Cameron-Smith and Burns 52 ). Lastly, although all attempts were made to ensure our sample was nationally representative (aside from oversampling Māori) and sampling and post-stratification weights were used to make the sample representative in terms of ethnicity as well as age group and sex, those younger, male, more deprived and Māori were less likely to respond to the survey, which may affect how our results are generalisable to the population as a whole. However, while this might have affected estimated means and proportions, there do not appear to be obvious reasons for the associations observed to differ between respondents and non-respondents.
Conclusion
In summary, the present study provides important information to inform future intervention studies and public health initiatives. The majority of respondents understood nuts are healthy and good sources of a variety of nutrients. However, in general this population was largely unaware of the cardioprotective effects of nuts and were confused regarding the effects of nut consumption on body weight. Positive beliefs and perceptions of nuts and endorsing reasons for consuming them were associated with higher intakes, although not for nut butters. Public health practitioners should address these knowledge gaps. They should also use the positive perceptions of nuts and the motivating reasons for consuming nuts that have been identified in the present study to guide content of messages to promote regular nut consumption.
Acknowledgements
Acknowledgements: The authors would like to thank the participants for their commitment in participating in this study. Financial support: This study was supported by internal funds from the Department of Human Nutrition, University of Otago. The funder had no role in the design, analysis or writing of this article. Conflict of interest: None. Authorship: R.C.B., A.R.G. and A.C. formulated the research questions; all authors contributed to the design the study; L.C.Y. was responsible for carrying out the study; L.C.Y., R.C.B. and A.R.G. were responsible for analysing the data; all authors contributed to the writing of the manuscript. Ethics of human subject participation: This study was conducted according to the guidelines laid down by the Declaration of Helsinki and all procedures involving human subjects were approved by the University of Otago Ethics Committee (reference number D14/288).


