


Dietary habits play an essential role in delaying and preventing a large number of chronic diseases(Reference Brunner, Rees and Ward1). The dietary habits of Iranian adults are largely influenced by the nutrition transition currently taking place in the country in the context of rapid demographic change, social development and urbanization, which is causing significant dietary changes such as increased consumption of inexpensive dietary energy sources, like bread, sugar, fats and oils, and decreased intakes of meat, fruits and vegetables (F&V), which are relatively more expensive in Iran(Reference Ghassemi, Harrison and Mohammad2). This phenomenon has influenced disease patterns in Iran such that the prevalence of chronic diseases is showing an increasing trend while infectious and malnutrition diseases, although under control, are still issues of concern(Reference Atinmo, Mirmiran and Oyewole3). The prevalence of obesity in Tehran City increased significantly between 1999 and 2009 from 15·8 to 21·0 % in men and from 31·5 to 38·6 % in women(Reference Hosseinpanah, Barzin and Eskandary4). As a consequence, the incidence of diabetes mellitus is on the rise: over 1 % of Iranian adults aged >20 years develop type 2 diabetes annually(Reference Harati, Hadaegh and Saadat5). The prevalence of metabolic syndrome (MetS) increased from 30·1 % in 2003 to 34·7 % in 2009(Reference Azizi, Salehi and Etemadi6, Reference Delavari, Forouzanfar and Alikhani7).
Authorities depend on two invaluable tools for public health improvements: nutritional objectives and food guidelines(Reference Serra-Majem and Aranceta8, Reference Becker, Gibney and Kearney9). In 1999, Becker et al. introduced nutritional targets for public health (total fat, SFA, dietary fibre, F&V) on the basis of which food-based dietary guidelines (FBDG) could be developed(Reference Becker, Gibney and Kearney9). FBDG need to be designed based on the socio-economic context of a society to be realistic, and hence should be extracted from population-based epidemiological studies(Reference Becker, Gibney and Kearney9). Several countries have developed country-based FBDG(10, Reference Koenig and Elmadfa11) and, in the case of the USA, these recommendations have been developed further(12). In Iran, several attempts have been made at developing country-based FBDG; however, no quantitative dietary guidelines have been decided upon and accordingly no nutritional targets have yet been set(Reference Safavi, Omidvar and Djazayery13) owing to a lack of data on prevailing dietary habits of Iranian adults.
The aims of the present study were therefore to: (i) identify food subgroups that contribute the most to discrepancies between actual dietary intakes and recommendations; (ii) analyse compliance with WHO/FAO nutritional objectives(14); and (iii) assess food patterns and risk factor profiles, based on common nutritional targets, in a sample of Tehranian adults.
Materials and methods
Population and sampling
The present study was conducted within the framework of the Tehran Lipid and Glucose Study (TLGS)(Reference Azizi, Ghanbarian and Momenan15), an ongoing population-based cohort study of residents of district no. 13 of Tehran City whose age and socio-economic status are representative of the overall population of Tehran(Reference Azizi, Ghanbarian and Momenan15, Reference Azizi, Rahmani and Emami16). In the third phase of TLGS (2005–2008), of 12 523 individuals aged ≥3 years, 4920 were selected for dietary assessments based on age- and sex-stratified random sampling. Randomization was performed because collecting dietary data from a large population would have high costs and be complex and time-consuming. Finally, the dietary data of 3462 persons aged ≥3 years, who agreed to participate in the survey and completed data for assessments, were available. Based on the inclusion criteria for age (19–70 years), 2881 adults, who were not on a specific diet, were included in the present analysis.
Our participants who completed the FFQ had similar characteristics to the total population in the third survey of TLGS(Reference Hosseini-Esfahani, Jessri and Mirmiran17). Of the total number of participants who completed the FFQ, 45·4 % were male and 76·7 % were aged 19–70 years compared with 44·1 % and 82·3 % respectively in the third survey of TLGS. In the third examination survey of TLGS, 20·1 % had academic education and 11·6 % were smokers compared with 25·3 % and 12·8 % in participants who completed the FFQ.
Of 2881 participants, we excluded individuals for whom data on any characteristic were missing (n 103). The reported energy intake (EI) was divided by estimated energy requirement (EER) and where EI:EER was not within ±2 sd of the mean value(Reference McCrory, Hajduk and Roberts18), reports were excluded from the study (n 274). Data for 2504 participants (1120 men and 1384 women) were finally available for analysis. The study proposal was approved by the Research Council of the Research Institute for Endocrine Sciences, Shahid Beheshti University of Medical Sciences and informed written consent was obtained from each participant.
Physical activity assessment
Kriska et al.'s physical activity (PA) questionnaire(Reference Kriska, Knowler and Laporte19), a modifiable activity questionnaire (MAQ), was used to obtain data on various aspects of PA and energy expenditure by identifying the time and frequency of participating in activities during the previous year. This questionnaire was designed for easy modification to maximize the feasibility and appropriateness of PA assessment in a variety of minority populations and age groups(Reference Kriska and Caspersen20). A validity and reliability study of this translated MAQ among Tehranian subjects showed that the validity correlation of total metabolic equivalents (MET) between the mean of four MAQ, completed in each season, was 0·4 and the intraclass correlation between the mean of two MAQ, completed with a 1-year interval, was 0·9 (M Delshad, A Ghanbarian and P Mirmiran, unpublished results). MET were then calculated based on the compendium of physical activities(Reference Ainsworth, Haskell and Whitt21) and the daily PA of each participant was interpreted using guidelines(22).
Other measures
Trained interviewers carried out face-to-face private interviews with participants, during which pre-tested questionnaires concerning age, medical history, current use of medications and smoking habits were completed(Reference Azizi, Rahmani and Emami16). Smoking status was categorized according to WHO guidelines(23).
All anthropometric measurements were carried out by the same examiner for all men and the same for all women. Weight was measured with participants minimally clothed, without shoes, while standing on a digital scale (model 707, range 0·1–150 kg; Seca, Hamburg, Germany). Height was measured using a tape meter (model 208 Portable Body Meter Measuring Device; Seca) while participants were standing without shoes with their head in the Frankfort horizontal plane and recorded to the nearest 0·5 cm. Waist circumference (WC) was measured at umbilical level using an out-stretched tape meter without pressure to body surfaces and was recorded to the nearest 0·1 cm.
Measurement methods for blood pressure (BP), fasting blood glucose (FBG) and lipid profiles in TLGS have been described in detail elsewhere(Reference Azizi, Ghanbarian and Momenan15, Reference Azizi, Rahmani and Emami16).
Definition of terms
Metabolic syndrome (MetS) was defined based on the Iranian-modified diagnostic criteria of the National Cholesterol Education Program Adult Treatment Panel III (NCEP ATP III)(Reference Grundy, Cleeman and Daniels24, Reference Azizi, Khalili and Aghajani25). MetS was considered as the co-occurrence of three or more of the following risk factors: WC ≥95 cm; HDL cholesterol (HDL-C) <40 mg/dl for men or <50 mg/dl for women or drug treatment; TAG ≥150 mg/dl or drug treatment; FBG ≥100 mg/dl or drug treatment for hyperglycaemia; and hypertension, systolic BP (SBP) ≥130 mmHg or diastolic BP (DBP) ⩾85 mmHg or drug treatment for a previous diagnosis of hypertension.
Dietary assessment
Dietary data were collected by trained dietitians with at least 5 years of experience in the TLGS survey(Reference Azizi, Ghanbarian and Momenan15, Reference Azizi, Rahmani and Emami16) using a validated FFQ(Reference Mirmiran, Esfahani and Mehrabi26), comprising 168 items, documenting the consumption frequency of food items during the previous year on a daily, weekly or monthly basis. Portion sizes of consumed foods were converted to grams(Reference Ghaffarpour, Houshiar-Rad and Kianfar27) and were analysed for energy and nutrient contents using the US Department of Agriculture (USDA) food composition table (FCT)(28). However, the Iranian FCT was used for some dairy products like kashk, not listed in the USDA FCT. Usual restaurant recipes were used for mixed food items (e.g. pizza) to calculate their nutrient contents. The weighted contribution of each subgroup to its respective food group was examined by summing the number of servings provided by the subgroup and dividing by the total intake of that group for all individuals; legumes could be included in either the ‘vegetables’ or the ‘meat and beans’ group of MyPyramid. Being a ‘consumer’ of WHO/FAO dietary guidelines(14) was defined as completely meeting the defined international dietary targets.
Food and nutritional guidelines
In the absence of complete quantitative Iranian nutritional guidelines, dietary intakes of participants were compared using the latest WHO/FAO dietary guidelines in the upper end of nutritional targets for public health, which have been used in several studies aimed at developing FBDG(Reference Becker29–Reference Tur, Romaguera and Pons31). Moreover, the MyPyramid food guide(12) was used for determining individuals’ food group intakes. The amounts of food intake (grams) were converted to cup- and ounce-equivalents using the ‘food link pyramid database series’(Reference Friday and Bowman32). Regarding the calculation of discretionary energy, only added sugar and solid fat were considered since most Iranians refrain from drinking alcohol based on their religious beliefs(Reference Hosseini-Esfahani, Jessri and Mirmiran17).
Statistical analysis
All statistical analyses were performed using the SPSS statistical software package version 16·0 (SPSS Inc., Chicago. IL, USA) and P < 0·05 was considered significant. All dietary components and risk factors were normally distributed except for TAG, for which the natural logarithm was alternatively used. To identify differences in eating patterns, participants were divided into groups of low and high intake according to quartile categories of the common nutritional targets of public health: total fat (% of energy: Q1, <26·52; Q2, 26·52–30·85; Q3, 30·86–35·42; Q4, >35·42), SFA (% of energy: Q1, <8·42; Q2, 8·42–10·12; Q3, 10·13–12·06; Q4, >12·06), F&V (g/d: Q1, <197·42; Q2, 197·42–296·46; Q3, 296·47–429·57; Q4, >429·57) and dietary fibre (g/d: Q1, <19·11; Q2, 19·11–25·96; Q3, 25·97–36·17; Q4, >36·17); differences in mean intakes from WHO/FAO goals and USDA food groups, between low and high intake groups of common nutritional targets, were tested by means of analysis of covariance. For assessing an independent association between quartile categories of nutritional targets and MetS, adjusted logistic regression was used. Those participants receiving treatment for any risk factors were excluded from analyses of the relationship between diet and that risk factor, leaving 2401 participants for the analysis of fasting FBG, 2385 for analysis of HDL-C and TAG, and 2392 for analysis of BP.
Results
Of the total population, 44·7 % were males and 55·3 % were females. The mean age of the men and women was 40·5 (sd 13·9) and 38·6 (sd 12·9) years, respectively, and their average BMI was 26·6 (sd 4·2) and 27·2 (sd 5·3) kg/m2, respectively.
Food subgroups are listed in descending order according to their contribution to total food group intake in Table 1; 68·5 % of the total grain ounce-equivalents were derived from refined grains. Rice made up 36·6 % of all grains consumed; followed by Iranian white bread (lavash, 17·3 %; data not shown). Among the seven vegetable subgroups, dark green vegetables ranked first in total cup-equivalents of vegetables. Fruit juice contributed 9·6 % of total cup-equivalents of the fruit group and the remaining was derived from whole fruit (data not shown).
Table 1 Food sources of USDA food groups, listed in descending order by percentage contribution to food group intakes, of adult participants of Tehran Lipid and Glucose Study
USDA, US Department of Agriculture.
*White breads, iceberg bread, noodles, vermicelli, pasta, rice, toasted bread, milled barley, sweet bread, white flour, starch and biscuits, grain-based desserts, pizza, crackers.
†Dark breads, barley bread, corn flex, bulgur, germs, popcorn.
‡Lettuce, greens, spinach.
§White potatoes, all preparations.
||Corn, green peas.
¶Pumpkin, carrots.
**Tomato, tomato sauce.
††Melons, cantaloupe, casaba melon, watermelon, sour cherry, kiwifruit, grapefruit, strawberry, oranges, tangerine, lemons, limes, cranberries, and juices made from these fruits.
‡‡Low- and high-fat yoghurts, Iranian diary product (condensed yoghurt, yoghurt drink, kashk).
§§Low- and high-fat milk, chocolate milk, milk-based desserts (various types of ice cream).
||||Cheese, pizza.
¶¶Chicken (with and without skin).
***Fish and tuna fish.
†††Liver, chicken heart and kidney, lamb brains and other visceral organs.
‡‡‡Whole dairy and high-fat meats group, grain-based desserts, regular cheese, sausage, frankfurters, chicken, eggs, burgers, organ meats, beef, pizza, fried potatoes, dairy desserts, burgers, margarine, butter, hydrogenated oil, coconut fat, cream, fried vegetables, animal fat, tallow.
§§§Grain-based desserts, fruit in syrup, dairy desserts, candy, sugar and Iranian products, honey, chocolate, jam, soda, caramel.
In the first quartile category of total fat and SFA intake, the consumption of fruits, dark green vegetables, other vegetables, total grains, whole grains and oils was higher than in the fourth quartile, while milk consumption was higher in the fourth quartile category of total fat and SFA intake than in the first quartile. Consumption of meat and starchy vegetables in the fourth quartile of total fat intake was higher than that in the first quartile, while consumption of dark green, starchy and other vegetables was lower in the fourth quartile of SFA intake compared with the first quartile. The dietary intake of all food groups and subgroups was found to be higher in the highest quartile category of dietary fibre intake (Table 2).
Table 2 Mean intake values of USDA food groups and subgroups according to the lowest and highest quartile categories of common nutritional targets of public health in a group of adult participants of the Tehran Lipid and Glucose Study
USDA, US Department of Agriculture; F&V, fruit and vegetables; Q, quartile.
Values are adjusted for total reported energy intake, sex and age. Analysis of covariance was used to test the difference between quartile categories of nutritional targets. All differences between groups were statistically significant except those identified as NS.
*Quartiles based on % of energy intake: Q1, <26·52; Q2, 26·52–30·86; Q3, 30·87–35·42; Q4, >35·42.
†Quartiles based on % of energy intake: Q1, <8·42; Q2, 8·42–10·12; Q3, 10·13–12·06; Q4, >12·06.
‡Quartiles based on g/d intake: Q1, <197·42; Q2, 197·42–296·46; Q3, 296·47–429·57; Q4, >429·57.
§Quartiles based on g/d intake: Q1, <19·11; Q2, 19·11–25·96; Q3, 25·97–36·17; Q4, >36·17.
IIIntake units: cup-equivalents/d.
¶Intake units: cup-equivalents/week.
**Intake units: ounce-equivalents/d.
††Fat from plant sources including vegetable oils, nuts and seeds, and fish. Intake units: g/d.
About two-thirds of participants were not meeting the WHO/FAO recommendations for n-3 PUFA (1·8 % consumers), Na (8·8 % consumers) and F&V (28·8 % consumers). All WHO/FAO dietary factors differed between the first and fourth quartile categories of total fat and SFA intake, with the exception of total and n-6 PUFA. The dietary intake pattern of participants with a low energy intake from SFA was similar to that of participants with a low energy intake from total fat, except for n-3 PUFA intake, which was lower in the highest quartile category of SFA intake. There was a twofold difference in F&V consumption between the lowest and highest quartile categories of fibre intake (216 v. 425 g/d, P < 0·001; Table 3).
Table 3 Mean intake values for the WHO/FAO food guide dietary factors according to the lowest and highest quartiles of common nutritional targets of public health in adult participants of the Tehran Lipid and Glucose Study
F&V, fruit and vegetables; Q, quartile.
Values are adjusted for total reported energy intake, sex and age. Analysis of covariance was used to test the difference between quartile categories of nutritional targets. All differences between groups were statistically significant except those identified as NS.
*Quartiles based on % of energy intake: Q1, <26·52; Q2, 26·52–30·86; Q3, 30·87–35·42; Q4, >35·42.
†Quartiles based on % of energy intake: Q1, <8·42; Q2, 8·42–10·12; Q3, 10·13–12·06; Q4, >12·06.
‡Quartiles based on g/d intake: Q1, <197·42; Q2, 197·42–296·46; Q3, 296·47–429·57; Q4, >429·57.
§Quartiles based on g/d intake: Q1, <19·11; Q2, 19·11–25·96; Q3, 25·97–36·17; Q4, >36·17.
||Consumer of WHO/FAO dietary guidelines refers to an individual who has fully met the defined international dietary targets.
¶Intake units: % of energy.
**Intake units: mg/d.
††Intake units: g/d.
Table 4 presents the participants’ characteristics and risk profiles according to low and high quartile categories of the common nutritional targets. There were more women among the fourth quartile category of fibre intake, compared with the first category, while they comprised a lower proportion in the fourth quartile of total fat and SFA intake. Age was significantly lower in the fourth quartile category of total fat and SFA intake while it was significantly higher in the fourth quartile category of fibre and F&V intake. The mean values for WC, FBG, LDL cholesterol, TAG and SBP, and the percentage of current smokers, were significantly higher in the fourth quartile category of total fat and SFA intake. Participants in the highest quartile category of SFA intake had 16·2 % lower HDL-C and 14·8 % higher DBP compared with those in the lowest. MET was 8·6 % lower in the fourth quartile of SFA intake than in the first, while it was 43·8 % higher in fourth quartile category of F&V intake and 21·3 % higher in the fourth quartile category of dietary fibre intake compared with the first.
Table 4 Characteristics and risk factors according to the lowest and highest quartiles of common nutritional targets of public health in adult participants of the Tehran Lipid and Glucose Study
F&V, fruit and vegetables; Q, quartile; WC, waist circumference; MET, metabolic equivalents; FBG, fasting blood glucose; LDL-C, LDL cholesterol; HDL-C, HDL cholesterol; SBP, systolic blood pressure; DBP, diastolic blood pressure.
Variables were adjusted for age, sex, energy intake, smoking status and physical activity except otherwise noted. Analysis of covariance was used to test the difference between quartile categories of nutritional targets, except for percentage of females and current smokers for which the χ 2 test was used. Participants receiving treatments for any risk factors were excluded from the analysis (leaving n 2401 for analysis of FBG, n 2392 for analysis of SBP and DBP, and n 2385 for analysis of TAG and HDL-C). All differences between groups were statistically significant except those identified as NS.
*Quartiles based on % of energy intake: Q1, <26·52; Q2, 26·52–30·86; Q3, 30·87–35·42; Q4, >35·42.
†Quartiles based on % of energy intake: Q1, <8·42; Q2, 8·42–10·12; Q3, 10·13–12·06; Q4, >12·06
‡Quartiles based on g/d intake: Q1, <197·42; Q2, 197·42–296·46; Q3, 296·47–429·57; Q4, >429·57.
§Quartiles based on g/d intake: Q1, <19·11; Q2, 19·11–25·96; Q3, 25·97–36·17; Q4, >36·17.
||Adjusted for sex, physical activity, smoking status and energy intake.
¶Adjusted for age, sex, energy intake and smoking status.
**TAG was transformed to the natural logarithm.
After adjustment for potential confounding variables, a significant inverse trend was observed between the probability of having MetS and high intakes of dietary fibre and low intakes of SFA (Fig. 1).
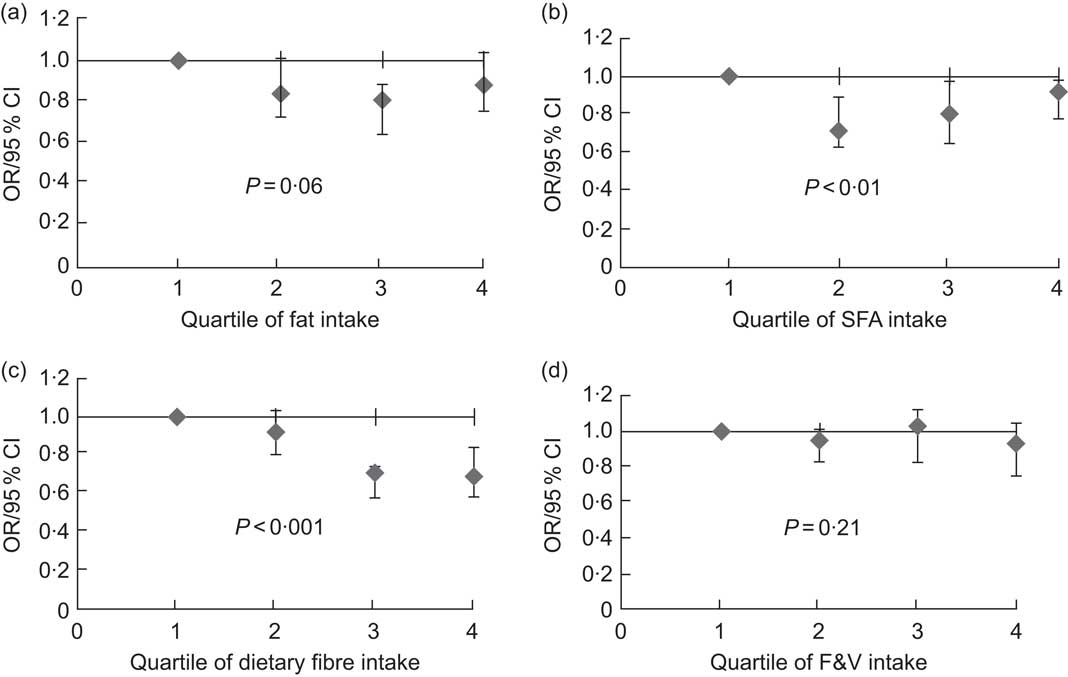
Fig. 1 Multivariate-adjusted odds ratios, with 95 % confidence intervals represented by vertical bars, for clustering of three or more metabolic syndrome (MetS) risk factors across quartile categories of total fat (a), SFA (b), dietary fibre (c) and fruit and vegetables (F&V) (d) in participants of the Tehran Lipid and Glucose Study. After adjustment for potential confounding variables, participants in the fourth quartile of SFA intake had higher risk of having MetS compared with those in the first quartile (OR = 0·92, 95 % CI 0·78, 0·98 v. OR = 0·71, 95 % CI 0·62, 0·89; P-trend = 0·01), while those in the fourth quartile of fibre intake had lower risk of MetS compared with those in the first quartile (OR = 0·69, 95 % CI 0·58, 0·84 v. OR = 0·92, 95 % CI 0·80, 1·03; P-trend < 0·001)
Discussion
The present research provides an insight into the dietary patterns of Tehranian adults based on the most recent data obtained. Risk factor characteristics of Tehranian adults show great compatibility with their dietary patterns when analysed according to quartile categories of common nutritional targets of public health (total fat, SFA, fibre, F&V). The results of the present study are in accordance with those of other investigations, conducted in different countries, using nutritional targets of public health or dietary patterns in relation to CVD risk factors(Reference Becker29–Reference Tur, Romaguera and Pons31, Reference Lutsey, Steffen and Stevens33, Reference Nettleton, Steffen and Ni34).
Compared with the recommendations of the Dietary Guidelines for Americans 2005(12), Tehranian adults failed to meet the recommendation for whole grains; they gained about one-third of their total grains from whole grains, whereas the recommended amount is ≥50 %. The corresponding intake of refined grains was 9·5 % in the US National Health and Nutrition Examination Survey (NHANES) 2001–2002(Reference Bachman, Reedy and Subar35). The fact that rice was the highest contributor to cereal intake in the present study, while it contributed only 5·3 % in NHANES(Reference Nettleton, Steffen and Ni34), confirms the results of previous research documenting rice as the staple food in the Middle East region(Reference Atinmo, Mirmiran and Oyewole3, Reference Safavi, Omidvar and Djazayery13). On the other hand, the contribution of dark green vegetables to total vegetable intake in Tehranian adults was almost 30 %, a figure that is much higher than the recommended amount of 17 %(12), while dark green vegetable intake accounted for less than 6 % of total vegetable intake in NHANES(Reference Bachman, Reedy and Subar35). The contributions of orange vegetables and legumes to total vegetable intake in TLGS fell drastically short of the recommended amount of 11 % and 17 %, similar to NHANES(Reference Bachman, Reedy and Subar35). In our study, more than 90 % of the cup-equivalents of the fruit group were from whole (non-juice) fruits, a distribution that is consistent with the 2005 dietary guideline recommendations(12); in addition, the main contributors of the milk and meat group were yoghurt and poultry, while milk and meat ranked first in NHANES(Reference Bachman, Reedy and Subar35).
Our findings show limited compliance with WHO/FAO food guide dietary factors among Tehranian adults, with less than half of them meeting the recommendations for total fat, SFA, PUFA (n-6 and n-3), trans fatty acids, Na and F&V. These issues need to be strongly emphasized for successful achievement of both the WHO/FAO nutritional goals and common targets of public health. The low consumption of F&V was accompanied by low compliance of dietary fibre intake with WHO/FAO recommendations, since the main dietary sources of fibre are cereals (especially whole grains), fruits and vegetables(Reference Cleveland, Moshfegh and Albertson36). The most important difference in the highest quartile category for fibre was the markedly higher F&V intake.
The largest disparity with the recommendations in the Tehranian population was observed for the intake of n-3 PUFA. The main source of fat in the Tehranian population was solid fat taken from animal products and the ratio of n-6 to n-3 fatty acids was 12·26, which is four to six times the optimal amount(Reference Haag37).
The dietary patterns of individuals in relation to both WHO/FAO recommendations and USDA food guidelines in quartile categories of total fat and SFA intake had similarities, and the dietary pattern of individuals in quartile categories of fibre intake was in line with the pattern seen in quartiles of F&V intake. Therefore it was hypothesized that the dietary patterns of participants in the lowest quartiles of total fat and SFA intakes and highest quartiles of fibre and F&V intakes could be used to develop FBDG based on the Tehranian dietary pattern, since it permits achievement of dietary recommendations. Analysing the dietary patterns of participants in the low and high quartiles of nutritional targets can be used as a model for developing realistic dietary guidelines; it can also help authorities to aim interventions at increasing the percentage of consumers or average intakes of certain food items. To be pragmatic, dietary guidelines should be based on an assessment of the data available and include evaluation of prevailing dietary patterns compared with recommended optima(Reference Wearne and Day38). Large disparities between prevailing and ideal dietary habits need to be addressed by means of a step-wise approach.
Being a women, older, more physically active and a non-smoker were associated with being in the lowest quartiles of total fat and SFA and highest quartiles of fibre and F&V. Common risk factors for CVD increased with being in the highest quartiles of total fat and SFA and lowest quartiles of fibre and F&V. The probability of having MetS was higher in the highest quartile of SFA intake and lowest quartile of fibre intake, suggesting that increasing fibre intake and decreasing SFA intake would be good strategies to decrease the risk of MetsS in both genders.
There are some potential limitations in the present research. First, we assessed the dietary patterns of Tehranian adults against the latest USDA food groups, due to the lack of quantitative dietary guidelines for the Iranian population(Reference Safavi, Omidvar and Djazayery13). Also, the common targets of public health are mainly established for the EU countries and applying them to other nations could be problematic; however, to compensate for these limitations, we assessed the dietary patterns of Iranian adults against the WHO/FAO food guide dietary factors and also evaluated the face validity of these dietary recommendations by considering the metabolic risk factors and demographic profiles of individuals. Another limitation was calculating discretionary energy based solely on the solid fat and added sugar intakes due to a lack of data on alcohol consumption. Alcohol consumption is prohibited in the Islamic Republic of Iran and those who do drink refrain from reporting their intake; therefore there are currently no official, semi-official or reported data on prevalence of alcohol consumption in Iran(39). Moreover, the cross-sectional nature of the data cannot show accurately the compliance of participants with nutritional targets and its relationship with risk profiles; thus it is recommended that future studies be conducted in a population-based cohort format. Also use of an FFQ for collection of dietary data may make the interpretation of the dietary intake erratic, although the FFQ used in the present study was validated(Reference Mirmiran, Esfahani and Mehrabi26).
The strength of the present study is that it is the first population-based analysis from the Middle East region, in a developing country, attempting to investigate dietary patterns in relation to WHO/FAO, USDA and nutritional targets of public health and simultaneously their impact on risk factors. The long-term aim of the study is to develop country-based dietary guidelines according to dietary patterns of individuals who demonstrate good compatibility with current dietary recommendations. Furthermore, the study results indicate the major subgroups contributing to different food groups, which can be used for targeting key foods in each food group in an attempt to eliminate those foods which contribute the most to dietary imbalance.
Conclusions
The proportion of Tehranian adults meeting WHO/FAO recommendations varies according to nutrient, with n-3 PUFA and Na recommendations being the most difficult to meet. The findings of the present study confirm that complying with the common nutritional targets of public health is inversely associated with MetS risk factors in Tehranian adults. Moreover, the assessment of food and nutrient intakes in quartiles of nutritional targets provides the first indications for future development of regional FBDG. The results of the present study suggest dietary interventions which need to be considered as priorities for the Iranian population.
Acknowledgements
The current study was part of the TLGS and was supported by grant 121 from the National Research Council of the Islamic Republic of Iran and the Research Institute for Endocrine Sciences, Shahid Beheshti University of Medical Sciences. None of the authors has any personal or financial conflicts of interest. F.H.-E. and M.J analysed the data and wrote the manuscript; M.S. collected the data and wrote the manuscript; P.M. and F.A. designed and supervised the study and edited the final manuscript. The authors would like to thank the adults who participated in the study. They are grateful to the staff of the nutrition department of the Obesity Research Center, Shahid Beheshti University of Medical Sciences and also thank Ms N. Shiva for the language editing of the manuscript.


