For more than a decade, there has been increasing interest in local food environments as mechanisms to improve nutrition(Reference Caspi, Sorensen and Subramanian1–Reference Engler-Stringer, Le and Gerrard3) and diet-related health(Reference Gamba, Schuchter and Rutt4–Reference Malambo, Kengne and De Villiers6). Local food environments, characterized by local sources of foods/drinks, can be measured in one of two general ways: (i) through primary data collection (direct observations on the ground) or (ii) using secondary data (pre-existing records generally collected for purposes other than food-environment research).
Using secondary data has advantages. For example, secondary data allow for research on a scale where primary data collection is not practical (e.g. a large city, an entire state or nationwide). Even at smaller scales though, using secondary data avoids resource-intensive primary data collection. Nevertheless, when using secondary data, some primary data collection is necessary for ‘groundtruthing’ or validation(Reference Lucan7).
Studies validating secondary data were examined in a systematic review(Reference Fleischhacker, Evenson and Sharkey8). The review showed high variability in agreement (secondary data v. ground observation) for identifying food/drink-offering businesses. For example, values for sensitivity (the proportion of businesses on the ground identified by secondary data) and positive predictive value (PPV; the proportion of businesses in secondary data actually appearing on the ground) had ranges of 0·46–0·96 and 0·70–1·00, respectively(Reference Fleischhacker, Evenson and Sharkey8). The review also identified variability in agreement related to the specific businesses under study. For instance, the sensitivity and PPV for grocery stores often differed from the sensitivity and PPV for restaurants, even for a given data set(Reference Fleischhacker, Evenson and Sharkey8). More important for variability though was the source of secondary data. For instance, secondary data from government records generally had higher levels of agreement with ground observation than secondary data from other sources (specifically from online listings, telephone directories, omnidirectional resources like Google Earth and Google Street View, or commercial vendors)(Reference Fleischhacker, Evenson and Sharkey8).
Regardless of superior performance in the systematic review, data from government sources may be limited by not including a full range of businesses offering foods/drinks. Most validation studies of government data have focused only on so-called ‘food stores’ (e.g. supermarkets, grocery stores) and restaurants(Reference Fleischhacker, Evenson and Sharkey8,Reference Wilkins, Radley and Morris9) . Some studies have also included a limited number of ‘other storefront businesses’ (e.g. gas stations, dollar stores and pharmacies(Reference Fleischhacker, Evenson and Sharkey8)), but no validation studies have considered the many other kinds of storefront businesses that can offer foods/drinks (e.g. barber shops, laundromats, banks, hardware stores, gyms, apparel outlets, etc.(Reference Farley, Baker and Futrell10–Reference Lucan, Maroko and Patel16)). Additionally, no validation studies included non-storefront businesses like mobile vendors (often also important food/drink sources(Reference Odoms-Young, Zenk and Mason17–Reference Lucan, Maroko and Shanker21)).
Given the current literature, the extent to which government records accurately reflect businesses offering foods/drinks is unknown. It is also unknown what percentage of businesses offering healthful and less-healthful foods/drinks are included in government records.
The objective of the current study was to determine how well government records reflect the businesses actually offering foods/drinks on the ground, specifically in two demographically divergent areas of New York City (NYC), USA. City and state inspections registries were compared with ground observations across a range of food/drink-offering businesses. The study considered all businesses offering foods/drinks, including sources of both healthful and less-healthful items.
Methods
Study sample
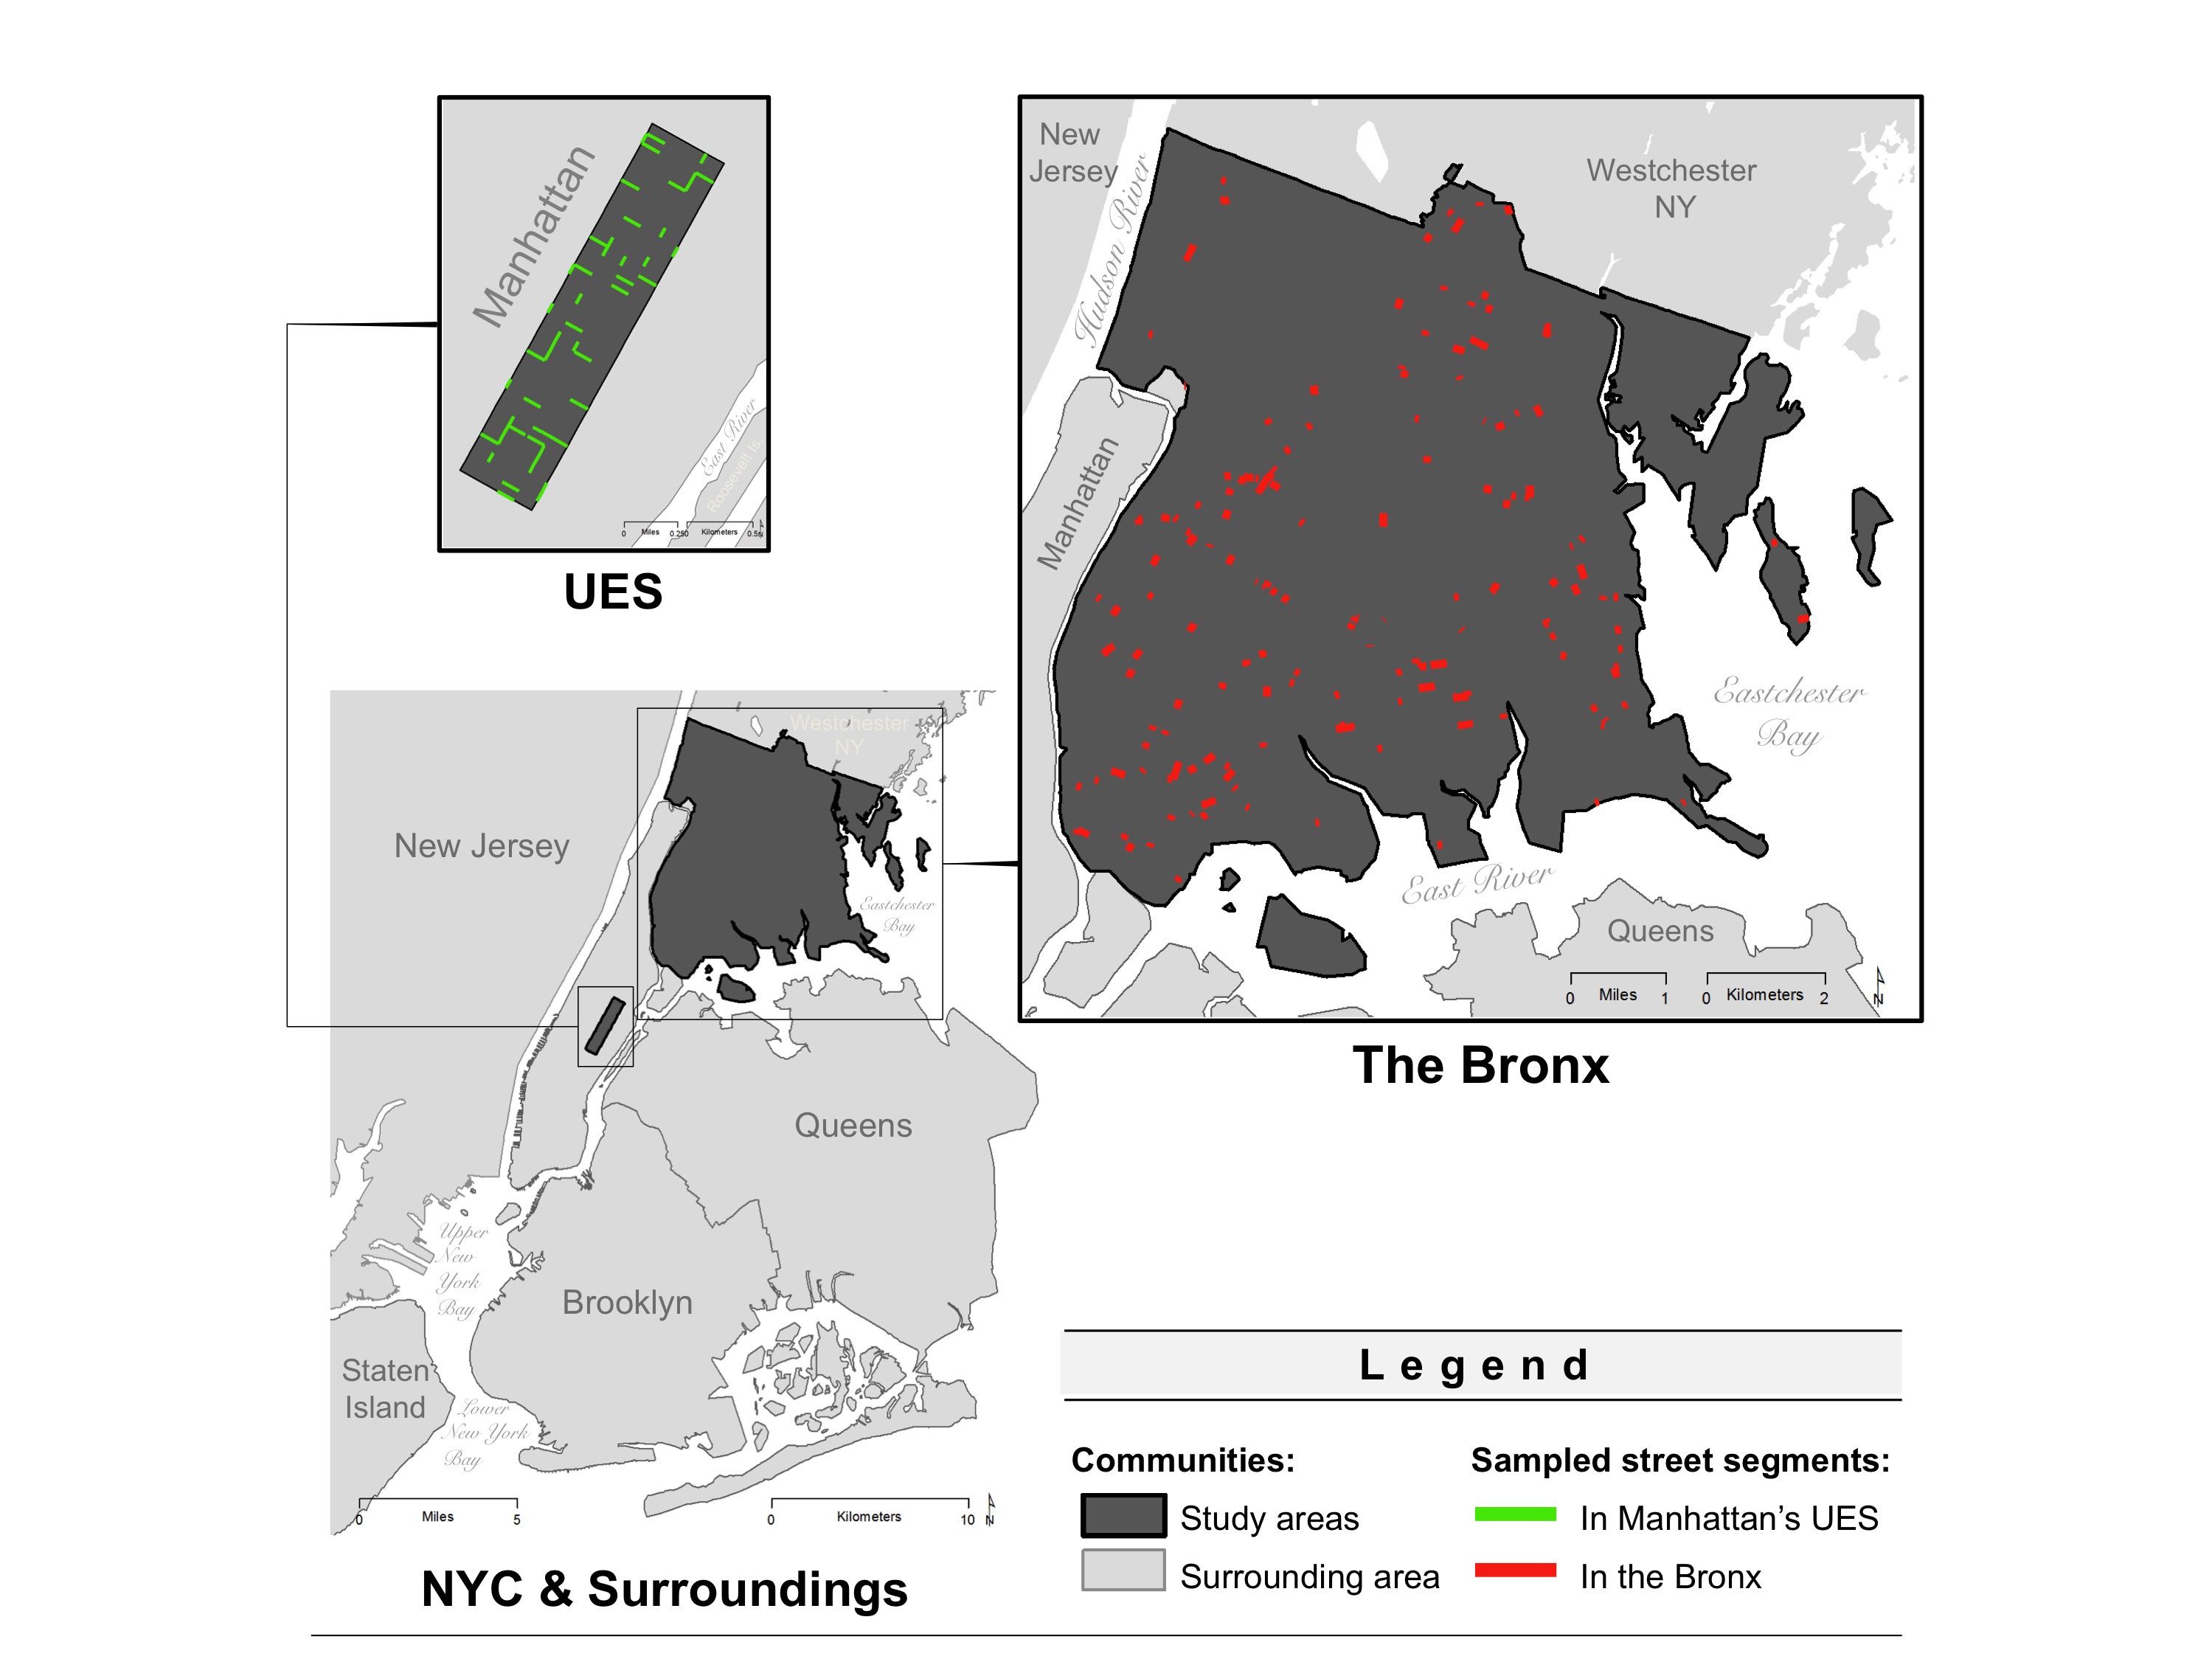
The study sample included street segments (sections of a street between intersections) in two areas of NYC (see online supplementary material, Supplemental Fig. S1). One area, the Bronx, was chosen to fulfil objectives of other studies(Reference Lucan, Maroko and Patel16,Reference Lucan, Maroko and Bumol22) . The other area, the Upper East Side of Manhattan (UES), was chosen to contrast with the Bronx.
The Bronx is more retail-dense than the UES (having over 50 % more businesses per retail street; SC Lucan, AR Maroko, AN Patel, I Gjonbalaj, B Elbel and CB Schechter, unpublished results). The Bronx is home to higher-poverty, mostly minority communities with relatively poor health; the UES is a wealthier, predominantly White neighbourhood with comparatively healthy residents(Reference Manson, Schroeder and Riper23,24) . Bronx communities have higher rates of poor diet (low fruit and vegetable intake, high sugary beverage consumption) and higher rates of obesity, diabetes and hypertension; the UES is less affected by diet-related health challenges(24).
The Bronx sample included 154 street segments. The UES sample included fifty-one street segments, reflecting the smaller size of the UES area.
For the Bronx, direct observation of the first 100 randomly selected street segments revealed mostly residential buildings: there were few businesses. To capture more businesses, the strategy of sampling randomly from all street segments shifted to a strategy of sampling randomly from only segments having business lots (LotINFO; Space Track, Inc., New York, NY, USA, 2008)(Reference Lucan, Maroko and Bumol22). Ultimately, there were businesses on sixty-three of the 154 sampled street segments. The sampling strategy in the UES paralleled the Bronx approach: the first sixteen street segments were found to be mostly residential, so the strategy shifted to sampling only street segments having business lots (MapPLUTO version 15v1; NYC Department of City Planning, New York, NY, USA, 2015). Ultimately, there were businesses on forty-four of the UES’s fifty-one sampled street segments.
Notably, it was essential to have both street segments with businesses and street segments without businesses for the present study. The aim was to determine both positive and negative agreement between government records and ground observation.
Ground observation – primary data collection
The principal investigator (experienced in ground observation studies(Reference Lucan, Maroko and Seitchik11,Reference Lucan, Maroko and Seitchik14,Reference Lucan, Maroko and Bumol19,Reference Lucan, Maroko and Shanker21,Reference Lucan, Maroko and Bumol22,Reference Lucan, Maroko and Sanon25,Reference Lucan, Varona and Maroko26) ) trained two members of the research team in primary data collection. Data collection involved walking the length of each side of each sampled street segment to identify businesses.
For each identified business, investigators recorded the business name (or business description for unnamed street vendors), business type (e.g. ‘doughnut shop’, ‘supermarket’, ‘hardware store’; subsequently categorized as described below), street address (or closest address for street vendors) and whether the business was open or closed (meaning entrance door locked in the case of storefronts; vehicle shut and no one selling in the case of street vendors). Other data collection included whether any foods/drinks were available (for purchase or for free) based on product displays, signage and menus/menu boards observed upon entering businesses.
If food/drinks were available, investigators recorded the presence or absence of specific food/drink categories. Categories were developed through prior work in food-environment assessment(Reference Lucan, Maroko and Seitchik11,Reference Lucan, Maroko and Seitchik14,Reference Lucan, Maroko and Bumol19) : healthful food categories included fruits and vegetables, whole grains and nuts; less-healthful food categories included refined sweets (e.g. cakes, candies) and salty/fatty fare (e.g. fried food, preserved meats); healthful drink categories were water and unflavoured milk; and less-healthful drink categories were sugar-sweetened beverages and alcohol. Diet drinks and 100 % juice were considered neither healthful nor less healthful given scientific debate about their healthfulness(Reference Nicklas, Kleinman and O’Neil27–Reference Ludwig29). Further details about food/drink categorization are published elsewhere(Reference Lucan, Maroko and Seitchik11,Reference Lucan, Maroko and Seitchik14) .
Before the start of the study, the two trained investigators separately assessed a sample of the same thirty street segments as a reliability check. There was exceptionally high agreement in recorded data; main differences were in notations for business names (e.g. ‘Whispers’ v. ‘Whisper’s lounge and sports bar’) and in examples of offered food/drink items (e.g. ‘Doritos and Cheetos’ v. ‘Potato chips’ as examples of salty/fatty fare at a laundromat). Overall, discrepancies occurred in <0·5 % of recorded values (eight of 1740 paired data cells for the thirty street segments). Reasons for recorded discrepancies were addressed before starting actual data collection.
For actual data collection, the two trained investigators worked together as a team. The team conducted assessments via smartphone using REDCap (Research Electronic Data Capture) version 6.1.0 (Vanderbilt University, Nashville, TN, USA)(Reference Harris, Taylor and Thielke30). All primary data collection occurred from 19 June 2015 to 15 August 2015, prior to acquisition of government records.
Government records – secondary data sources
Government records included: (i) inspection records from NYC’s Department of Health and Mental Hygiene; and (ii) inspection records from New York State’s Department of Agriculture and Markets. Inspection records from the City health department were for businesses generating more than 50 % of their revenue through prepared food. The records encompassed a full spectrum of take-out and table-service eateries, ‘where food is provided for individual portion service directly to the consumer, whether the food is provided free of charge or sold, and whether the food is consumed on or off the premises’, including (but not limited to) restaurants, cafeterias, bakeries, pizzerias, night clubs, cabarets and bars(31,32) . Inspection records from the State agriculture and markets department were for other businesses selling foods/drinks, i.e. those generating less than 50 % of their revenue through prepared foods, or not selling prepared foods at all and instead selling packaged foods or beverages. The records included a wide range of establishments where food is ‘produced, shipped, processed, or sold’, including (but not limited to) grocery stores, supermarkets, dollar stores, gas stations and pharmacies(33,34) .
Government inspection data were obtained through Freedom of Information Act requests to the City and State. Records covered many years of inspections up through May 2016. In order to synchronize government data with the timing of ground observations, records were retained only for establishments meeting the following criteria: last inspection preceding 15 August 2015 but by no more than 12 months in the case of restaurants (restaurants require annual inspection(32)) and by no more than 18 months in the case of stores (stores require inspection every 18 months(34)).
Comparing primary and secondary data
Comparisons between ground observation and government records were by street segment. Street segments were identified using ArcGIS software version 10.5.1 (ESRI, Redlands, CA, USA). For each street segment, investigators compared businesses from ground observations (georeferenced using ArcGIS) with businesses from government records (geocoded using the NYC Department of City Planning’s Geosupport Desktop Edition software, version 19A; New York, NY, USA) looking for ‘matches’. Matches, as established in prior research(Reference Lucan, Maroko and Patel16,Reference Lucan, Maroko and Bumol22) , could be of two levels: ‘strict’ or ‘lenient’. For both levels of matching, businesses had to be in both data sets (government records and ground observation) on the same street segment. For ‘strict’ matches, businesses additionally had to have the exact same, or consistent, name (e.g. ‘The Best Roma Pizzeria’ v. ‘Roma Pizza’; ‘First Aden Grocery Corp.’ v. ‘Aden Deli Grocery’; ‘Met Foodmarkets’ v. ‘Met Foods’). For ‘lenient’ matches, businesses additionally had to be of a similar business type based on name (e.g. ‘AMC theaters’ v. ‘Loews theaters’; ‘Young Deli’ v. ‘Big Star Futa Deli Corp.’; ‘Walgreens pharmacy’ v. ‘Duane Reade pharmacy’). Types of businesses were organized into broad categories.
Businesses categories
Business categories followed from schema developed in prior work(Reference Lucan, Maroko and Seitchik11,Reference Lucan, Maroko and Seitchik14,Reference Lucan, Maroko and Patel16,Reference Lucan, Maroko and Bumol19,Reference Lucan, Maroko and Bumol22) as well as from common categorizations used in prior studies validating secondary data(Reference Fleischhacker, Evenson and Sharkey8). Categories included: ‘restaurants’ (eat-in and take-out), ‘food stores’ (e.g. general grocers, specialty markets) and ‘OSB’ (other storefront businesses not primarily selling foods/drinks). OSB were further categorized as follows: OSB recognized in obtained government inspection records (‘gov. OSB’; i.e. dollar stores, gas stations, pharmacies) and OSB absent from government records (‘other OSB’; e.g. barbershops, laundromats, gyms, etc.). Together, ‘gov. OSB’ plus ‘other OSB’ equalled the combined category of ‘OSB of any type’. A final category of food/drink-offering business was ‘street vendors’ (e.g. non-storefront mobile vendors), a category not included in government inspection records. Further details on categories of food/drink-offering businesses appear in footnotes to Table 1.
Table 1 Businesses offering foods/drinks in two areas of New York City, USA, by ground observation and government records, 2015

gov., government-recognized (i.e. included in government records); OSB, other storefront businesses (businesses not primarily focused on selling foods or drinks, but which nevertheless might offer them); UES, Upper East Side (part of Manhattan); N/A, not assessed.
* Restaurants included bars and grills, cafés, ice-cream parlours, juice bars, pizzerias, and various other fast-food, take-out and table-service eateries.
† Food stores included general grocers (e.g. supermarkets, grocery stores, convenience marts, bodegas) and specialty food stores (bakeries, butcher shops/meat markets, candy stores, fish markets, produce markets).
‡ Food/drink-offering ‘gov. OSB’ included dollar stores, gas stations and pharmacies.
§ Food/drink-offering ‘other OSB’ were storefronts offering foods/drinks not in the government records. In the Bronx, these businesses included one or more accounting/tax office, auto repair shop, auto sales office, bank, barber shop/beauty salon, clothing store, department store, electronics shop, furniture store, gift shop, gym, hardware store, laundromat, liquor store, mobile phone store, money transfer outlet, music store, party-supply store, real estate office and vitamin store; in the UES, these businesses included one or more bank, clothing store, cookware outlet, liquor store, newsstand, sporting goods store, veterinary office and vitamin shop.
║ Street vendors were another kind of business not in the government records. Street vendors included a variety of mobile vendors (e.g. carts, trucks, vans, stands), most of which sold foods/drinks. The category could have also included farmers’ markets and flea markets; however, none were identified on sampled streets.
¶ Government records included: (i) inspection records from the New York City Department of Health and Mental Hygiene, applicable to the business category ‘restaurants’; and (ii) inspection records from the New York State Department of Agriculture and Markets, applicable to the business categories ‘food stores’ and ‘food/drink-offering gov. OSB’.
Data analyses
Analyses of agreement between ground observations and government records at the level of businesses included two measures: (i) sensitivity (how often businesses observed on the ground were also in government records); and (ii) PPV (how often businesses in government records were also observed on the ground). Values were calculated for businesses overall and for each business category.
Analyses of agreement at the level of the street segments included four measures: (i) sensitivity (how often street segments having businesses observed on the ground also had businesses in government records); (ii) PPV (how often street segments having businesses in government records also had businesses observed on the ground); (iii) specificity (how often street segments having no businesses observed on the ground also had no businesses in government records); and (iv) negative predictive value (NPV; how often street segments having no businesses in government records also had no businesses observed on the ground). Values were calculated for street segments having (and not having) businesses overall and for street segments having (and not having) businesses of each category.
Other analyses included counts of the number of businesses in government records and in ground observation data; counts of the number of street segments having businesses in both data sets; and the overlap in counts between government records and ground observation data. Additional analyses, for businesses that were open at the time of ground observations, included the frequencies and proportions of those offering healthful and less-healthful food/drink items that might be included (and excluded) by government records under best-case scenarios. All analyses considered both the Bronx and the UES. All statistics were calculated using the statistical software package Stata/MP2 version 15.1 (2017).
Results
In total, there were 458 businesses identified through ground observation. Forty businesses (8·7 %) were storefronts unambiguously shut down, boarded up, ‘for rent’ or otherwise not in operation, with no indication of business name or business category. These forty storefronts were excluded from analyses by necessity.
There were 106 additional cases where identifiable businesses on the ground were closed at the time of assessments. In many of these cases, reasons were explained with posted notifications (e.g. worker vacations, renovations, open only certain times of the year (like tax season), etc.). In other cases, reasons were unclear (i.e. closures with no posted hours or other signage). Regardless, identifiable closed businesses could be included in analyses because business names and business categories were apparent. Assumptions about offering foods/drinks were generous to the validity of government records: while closed restaurants (n 32), food stores (n 5), ‘gov. OSB’ (n 4) and a street vendor (n 1) were counted as offering foods/drinks, closed ‘other OSB’ (n 64) were counted as not offering foods/drinks (even though several probably would have; e.g. two gyms, two party-supply stores and a movie theatre).
Table 1 shows that in the Bronx, government records identified 107 fewer food/drink-offering businesses than ground observation. Government records missed 193 Bronx businesses (307 minus 114), representing 63 % of ground-identified businesses (193/307); government records misreported eighty-six Bronx businesses (200 minus 114), representing 43 % of government-identified businesses (86/200). By business category in the Bronx, government records missed thirty-eight restaurants, forty-five food stores and twenty-nine ‘gov. OSB’. These missed businesses represented 37, 56 and 69 % of all ground-identified Bronx food/drink-offering businesses, respectively. Government records excluded ‘other OSB’ and street vendors, which (together) numbered eighty-one in the Bronx (26·4 % of the ground-identified food/drink-offering-business total). Government records also misreported thirty-seven Bronx restaurants, forty-three Bronx food stores and six Bronx ‘gov. OSB’ (36, 55 and 32 %, respectively, of all government-identified Bronx food/drink sources). In the UES, the total number of food/drink sources identified in government records was similar to the number observed on the ground. However, government records missed thirteen restaurants, eight food stores and two ‘gov. OSB’ (19, 53 and 50 %, respectively, of all ground-identified UES food/drink-offering businesses). ‘Other OSB’ and street vendors (again, absent from government records) together numbered twenty-four in the UES (21·6 % of all ground-identified UES food/drink-offering businesses). Government records misreported forty restaurants and five food stores in the UES (42 and 42 %, respectively, of all government-identified UES food/drink sources).
Table 2 shows findings by street segment. Overall in the Bronx, government records identified only one street segment fewer than ground observations, correctly identifying forty of the Bronx street segments offering foods/drinks from any business, missing seventeen (30 % of the ground total) and misreporting sixteen (29 % of the government total). The agreement between government records and ground observation was numerically most discrepant for ‘gov. OSB’ in the Bronx, but the percentages of missed street segments having restaurants, food stores or ‘gov. OSB’ (30, 35 and 48 %, respectively) and the percentages of street segments misreported as having restaurants, food stores or ‘gov. OSB’ (23, 37 and 13 %, respectively) were all substantive. In the UES, government records identified more street segments as having restaurants than actually did. Records correctly identified twenty-nine of the UES street segments offering foods/drinks from any businesses, missing four and misreporting seven. Percentages of missed UES segments having restaurants, food stores and ‘gov. OSB’ were 4, 27 and 50 %, respectively. Percentages of UES segments misreported as having restaurants, food stores and ‘gov. OSB’ were 32, 20 and 0 %, respectively.
Table 2 Street segments having businesses offering foods/drinks in two areas of New York City, USA, by ground observation and government records, 2015

gov., government-recognized (i.e. included in government records); OSB, other storefront businesses (businesses not primarily focused on selling foods or drinks, but which nevertheless might offer them); UES, Upper East Side (part of Manhattan); N/A, not assessed.
* Please see footnotes to Table 1 for definitions, explanations and examples.
† Percentages for business categories do not sum to 100 % as they are not mutually exclusive; a street segment may have had any combination of businesses offering foods/drinks.
‡ By ground observation, the numbers (and percentages) of street segments having food/drink-offering ‘OSB of any type’ (‘gov. OSB’ + ‘other OSB’) were the same as those for street segment having just ‘other OSB’: thirty-three (57·9 %) in the Bronx, twelve (36·4 %) in the UES. In other words, food/drink-offering ‘gov. OSB’ were only found on street segments that also had food/drink-offering ‘other OSB’.
§ Government records included: (i) inspection records from the New York City Department of Health and Mental Hygiene, applicable to the business category ‘restaurants’; and (ii) inspection records from the New York State Department of Agriculture and Markets, applicable to the business categories ‘food stores’ and ‘food/drink-offering gov. OSB’.
Supplemental Table S1 (see online supplementary material) shows that, in the Bronx, nine street segments offered foods/drinks only through ‘other OSB(s)’ and one street segment offered foods/drinks only through street vendor(s). In the UES, the numbers were fourteen and four, respectively. All of these street segments were incorrectly identified as not offering foods/drinks (at all) by government records.
Supplemental Table 2 (see online supplementary material) shows that one additional street segment in the Bronx, as well as one additional street segment in the UES, offered foods/drinks only through the combination of ‘other OSB’ and street vendor(s). In the Bronx, there were eleven street segments offering foods/drinks only through ‘other OSB’ and/or street vendor(s); these street segments represented 19 % of all Bronx food/drink-offering street segments. In the UES, there were nineteen street segments offering foods/drinks only through ‘other OSB’ and/or street vendor(s); these street segments represented 58 % of the UES food/drink-offering-street-segment total.
Table 3 quantifies agreement between government records and ground observation at the business level, showing sensitivities and PPV by both ‘strict’ and ‘lenient’ criteria. Neither sensitivities nor PPV were meaningfully different by ‘strict’ or ‘lenient’ criteria in either the Bronx or the UES. In both study areas, PPV tended to be higher than sensitivities (an exception being for restaurants in the UES). Most values for sensitivity and PPV were modest to moderate (0·30–0·70). In the UES, most values for sensitivity and PPV were higher, with wider confidence intervals, than in the Bronx. Some values for sensitivity were quite low: the sensitivities for ‘OSB of any type’ were all <0·20 by ‘strict’ and ‘lenient criteria in both study areas; the sensitivities for ‘other OSB’ and street vendors were, of course, zero (see Table 3, footnote *). A few sensitivities and PPV were quite high: the sensitivities for restaurants in the UES were ≥0·80 by both ‘lenient’ and ‘strict’ criteria; both ‘strict’ and ‘lenient’ PPV for ‘gov. OSB’ and ‘OSB of any type’ in the UES were perfect at 1·00 (with wide confidence intervals given small sample sizes).
Table 3 Sensitivities and positive predictive values (PPV) of government records for identifying food/drink-offering businesses in two areas of New York City, USA, by ‘strict’ and ‘lenient’ criteria, 2015

gov., government-recognized (i.e. included in government records); OSB, other storefront businesses (businesses not primarily focused on selling foods or drinks, but which nevertheless might offer them); UES, Upper East Side (part of Manhattan).
For all values, 0·00 = none, 1·00 = perfect.
* Overall = all businesses offering foods/drinks from Table 1. Government records did not include ‘other OSB’ or street vendors; sensitivities for these businesses were, thus, precisely zero; PPV for these businesses involved division by zero so were undefined.
† Please see Table 1 for definitions and examples.
‡ Food/drink-offering ‘OSB of any type’ = food/drink-offering ‘gov. OSB’ + food/drink-offering ‘other OSB’.
§ ‘Strict’ match criteria = matches for businesses on the same street segment having the exact same name or consistent name (e.g. ‘The Best Roma Pizzeria’ v. ‘Roma Pizza’; ‘First Aden Grocery Corp’. v. ‘Aden Deli Grocery’; ‘Met Foodmarkets’ v. ‘Met Foods’) in both ground-observation data and government records.
║ ‘Lenient’ match criteria = matches for businesses on the same street segment thought to be similar based on business type (e.g. ‘Walgreens pharmacy’ v. ‘Duane Reade pharmacy’; ‘AMC theaters’ v. ‘Loews theaters’; ‘Young Deli’ v. ‘Big Star Futa Deli Corp.’) in both ground-observation data and government records.
Table 4 quantifies agreement between government records and ground observation at the street-segment level. Sensitivities and PPV for street segments (as shown in Table 4) were higher than sensitivities and PPV for businesses (as shown in Table 3). Overall street-segment sensitivities and PPV were 0·66–0·92. Sensitivities were lowest for street segments having food/drink-offering ‘OSB of any type’ in both the Bronx and the UES. Bronx PPV were lowest for street segments having ‘food stores’; UES PPV were lowest for street segments having restaurants. In general, there was very high agreement between government records and ground observation for identifying street segments having no food/drink-offering businesses (specificities and NPV generally exceeding 0·85). The most notable exceptions were in the UES: the specificity for street segments not having restaurants was 0·59; the NPV for street segments not having ‘OSB of any type’ was 0·18.
Table 4 Sensitivities, specificities, positive predictive values (PPV) and negative predictive values (NPV) of government records for identifying street segments having food/drink-offering businesses in two areas of New York City, USA, 2015

gov., government-recognized (i.e. included in government records); OSB, other storefront businesses (businesses not primarily focused on selling foods or drinks, but which nevertheless might offer them); UES, Upper East Side (part of Manhattan).
For all values, 0·00 = none, 1·00 = perfect.
* Overall = all businesses offering foods/drinks from Table 1. Government records did not include ‘other OSB’ or street vendors; sensitivities for street segments having these businesses were precisely zero; PPV for street segments having these businesses involved division by zero so were undefined; specificities for street segments not having these businesses were 1·00, NPV for street segments not having these businesses were calculable but not useful.
† Please see footnotes to Table 1 for definitions and examples.
‡ Food/drink-offering ‘OSB of any type’ = food/drink-offering ‘gov. OSB’ + food/drink-offering ‘other OSB’.
Table 5 is a modelling exercise; it considers the proportion of businesses offering foods/drinks that might be included (and excluded) by government records under a best-case scenario; i.e. if government records were 100 % accurate for restaurants, food stores and food/drink-offering ‘gov. OSB’ and missed only ‘other OSB’ and street vendors. The findings in Table 5 are limited, by necessity, to businesses that were open at the time of ground observations (only such businesses could allow investigators to enter and make full assessments of food/drink offerings). Even under the most optimistic scenario, in excluding ‘other OSB’ and street vendors, government businesses would have missed 28·4 % of open food/drink-offering businesses in the Bronx and 22·2 % of open food/drink-offering businesses in the UES. In the Bronx, missed businesses would have accounted for 21·8 % of the sources of any healthful items and 86·2 % of the sources of only less-healthful items. In the UES, the corresponding percentages were 20·7 and 42·9 %, respectively. Government records would miss >10 % of open businesses offering fruits and vegetables, ‘refined sweets’, ‘salty/fatty fare’, water, diet drinks, sugar-sweetened beverages and alcohol in the Bronx, and >10 % offering fruits and vegetables, ‘salty/fatty fare’, water, diet drinks and sugar-sweetened beverages in the UES.
Table 5 Absolute and proportionate number of open businesses (government-included categories v. government-excluded categories) offering specific food and drink items based on ground observations in two areas of New York City, USA, 2015

UES, Upper East Side (part of Manhattan); gov., government-recognized (i.e. included in government records); OSB, other storefront businesses (businesses not primarily focused on selling foods or drinks, but which nevertheless might offer them).
* Includes food stores, restaurants and ‘gov. OSB’; please see footnote to Table 1 for definitions and examples.
† Includes ‘other OSB’ and street vendors; please see footnote to Table 1 for definitions/examples.
‡ Only businesses that were open allowed for investigators entering establishments to make complete assessments of the food and drink items on offer. In the Bronx, closed businesses included food stores (n 4), restaurants (n 23), ‘gov. OSB’ (n 4) and ‘other OSB’ (n 49). In the UES, closed businesses included a food store (n 1), restaurants (n 9), ‘other OSB’ (n 15) and a street vendor (n 1).
§ ‘Any healthful items’ = healthful foods (fruits, vegetables, whole grains or nuts) or healthful drinks (water or milk), regardless of other food/drink offerings.
║ ‘Only items that were less healthful’ = less-healthful foods (refined sweets or salty/fatty fare) or less-healthful drinks (sugar-sweetened beverages or alcohol) with no healthful food/drink options and no foods/drinks considered neither healthful nor less healthful (e.g. eggs, cheese, fresh poultry, 100 % juice or diet drinks).
Discussion
The current study assessed the performance of government inspection records for identifying a range of food/drink-offering businesses in two urban areas. As a paired reference, the combination of city records and state records showed deficiencies in both accuracy and comprehensiveness. Government records frequently did not correctly reflect the actual presence of restaurants and food stores on the ground. Moreover, the records completely omitted many businesses offering foods/drinks, including sources of both healthful and less-healthful options.
Regarding restaurants, the NYC Department of Health and Mental Hygiene mandates inspection at least annually(32). However, even over a single year, restaurant presence (or absence) can change substantially. One study showed that only 80 % of restaurants observed on the ground in 2016 remained in business in 2017 (SC Lucan, AR Maroko, A Chen, A Jin, C Pan, G Sosa and CB Schechter, unpublished results). A study over a longer period showed that only about half of all restaurants originally present on sampled streets in 2010 remained in 2015(Reference Lucan, Maroko and Patel16). In fact, thousands of restaurants come into and go out of business every year in NYC(32). Since new restaurants require inspection to open, restaurants missed in government records are hard to explain (at least if government inspections are occurring as mandated and businesses are operating lawfully). For restaurants that go out of business, closures might not be discovered by government inspectors for up to a full year, yet records would continue to exist as if businesses were still operating. The result would be restaurants misreported by government records. Such misreporting has been noted in Baltimore using city data(Reference Rossen, Pollack and Curriero35) and might substantively be a function of inspections not keeping pace with the rate of business closure.
The business-closure rate probably also impacts the performance of store data; i.e. store inspection records from a city health department. One study documented food-store closure even over a single year and also showed some stores (OSB) shifting from offering foods/drinks to not (SC Lucan, AR Maroko, A Chen, A Jin, C Pan, G Sosa and CB Schechter, unpublished results). Such store changes might be completely missed by state inspections, at least those occurring as frequently as mandated by the New York State Department of Agriculture and Markets (within 18 months)(34). Indeed, the amount of food-store attrition that might occur in 18 months could be substantial. One study showed that of general grocers and specialty markets on the ground in 2010, only 41 and 34 %, respectively, remained in operation in 2015(Reference Lucan, Maroko and Patel16). If the rate of change was steady, the percentage attrition over 18 months would have approached 20 % for both grocers and markets. A dynamic situation, in terms of actual store presence on the ground, undoubtedly contributes to misreported stores by government records. Government records, specifically from departments of agriculture in other studies in other settings, likewise showed non-ideal performance for identifying stores (e.g. PPV of 0·16–0·87)(Reference Hosler and Dharssi36,Reference Fleischhacker, Rodriguez and Evenson37) .
The poor performance of government inspection records for identifying stores and restaurants is notable; in the current study, there were many allowances to be as generous as possible to government records. For instance, in the cases of twelve restaurants and thirteen stores, government records listed businesses at a given address as having different names than found through ground observation (e.g. ‘Discount Crotona’ v. ‘99 Cents Junction’; ‘One Way Deli’ v. ‘B&A Gourmet Deli’; ‘Nayelie Restaurant’ v. ‘Altagracia Restaurant’; ‘Compare Foods’ v. ‘Super Carniceria y Marketa’). This situation could arise from any of the following circumstances: (i) having an administrative-office name, as opposed to the customer-facing name, in records; (ii) change of ownership with records retaining the old name; and (iii) businesses actually being different. ‘Matching’ in any such circumstances would result in artificially inflated estimates of government-data validity. Inflated estimates would also result (by design) from ‘lenient’ matching. However, even ‘strict’ matches were generous to government records: ‘strict’ matches required only that businesses be on the same street segment, not at the precise same address. In some cases, there were address discrepancies (e.g. Domino’s at 2463 in government records v. at 2465 Webster Ave. by ground observation); government records were not penalized for these differences. A final way analyses were generous to government records was in the handling of OSB. First, one category of OSB was restricted to only those businesses explicitly recognized, and appearing, in government records (‘gov. OSB’). Second, for the other category of OSB (‘other OSB’), businesses closed during times of ground observation were counted as not offering foods/drinks even though a high percentage of them likely would have; the effect would be to reduce the number of food/drink-offering businesses apparently missed by the government records.
The fact that neither city nor state inspection records included ‘other OSB’ merits consideration. ‘Other OSB’ accounted for nearly 14 % of all food/drink-offering businesses (15 % of the storefront businesses) in the UES and nearly 20 % of all food/drink-offering businesses (21 % of the storefront businesses) in the Bronx. In the vast majority of cases, foods/drinks at OSB were available for purchase (on shelves, at registers, from vending machines, etc.), but in some cases were offered without charge (e.g. free coffee from a bank; free doughnuts from a real-estate office; free candy from a beauty salon). When ‘other OSB’ were added to ‘gov. OSB’ (‘OSB of any type’), OSB represented 19 % of storefronts offering foods/drinks in the UES and 36 % of storefronts offering foods/drinks in the Bronx. In prior studies, OSB accounted for 24·5–34·4 % of storefront food/drink sources in a community(Reference Lucan, Maroko and Seitchik11,Reference Lucan, Maroko and Seitchik14,Reference Lucan, Maroko and Patel16) . One study showed that OSB were the fastest growing category of storefront businesses offering foods/drinks, nearly doubling their presence from 2010 to 2015 (being comparable in number to restaurants and greater in number than so-called ‘food stores’ in 2015)(Reference Lucan, Maroko and Patel16). Regarding the current study, it is not clear (based on information posted on government websites) why store inspections would include dollar stores, pharmacies and gas stations (‘gov. OSB’) offering foods/drinks, but exclude laundromats, department stores and beauty salons (‘other OSB’) that do(31–34). Indeed, ‘other OSB’ offer both healthful and less-healthful food/drink items, including shelf-stable and perishable products(Reference Lucan, Maroko and Seitchik11,Reference Lucan, Maroko and Seitchik14) (e.g. milk at laundromats, newsstands and department stores in the current study). Excluding the majority of food/drink-offering OSB is a substantial deficit of government inspection records.
Additionally, government inspection records are limited by omitting street vendors. Street vendors do require inspections(38); however, there are no formal records for where permitted vendors sell. Indeed, vendors may move day-to-day or within a given day(Reference Lucan, Varona and Maroko26). Also, as many as two-thirds of street vendors may sell without permit, licence or any government sanction(Reference Lucan, Varona and Maroko26). In the current study, street vendors accounted for 7 % of all food/drink-offering businesses in the Bronx and 8 % in the UES.
Taken together, street vendors and ‘other OSB’ (the businesses missed by government records) represented almost 22 % of the food/drink-offering businesses in the UES and more than 26 % of the food/drink-offering businesses in the Bronx. In the Bronx, these businesses alone accounted for 19 % of the street segments offering foods/drinks; in the UES, these businesses alone accounted for 58 % of the food/drink-offering street segments. Also, street vendors and ‘other OSB’ represented more than 20 % of the sources of any healthful options in both study areas. In the UES, these businesses (together) represented more than 40 % of the sources of only less-healthful items; in the Bronx they represented more than 85 % of this total.
The current study had several strengths. First, it included two complementary sets of government records to capture different aspects of local food environments (e.g. both sources of prepared foods for immediate consumption and sources of packaged foods for later preparation, a distinction highlighted in previous work)(Reference Lucan, Maroko and Seitchik14). Second, analyses considered validity of government records using two separate but related levels of analyses: (i) individual businesses and (ii) street segments; both levels are relevant to consumers and food-environment questions (e.g. how often is food/drink available from a given seller? how often is food/drink available on a given block?). Third, analyses considered performance of government records by both ‘strict’ and ‘lenient’ standards. Fourth, at the level of food/drink-offering businesses, agreement with ground observation was assessed by the complementary measures of sensitivity and PPV; at the level of the street segment, agreement was additionally assessed by uncommonly reported specificity and NPV. Fifth, analyses considered performance of government records in more than one geographic area; moreover, the two chosen areas represented extremes of sociodemographic and health-related characteristics. Sixth, data collection and analyses included a full range of storefront and non-storefront food/drink sources. Seventh, the study considered not just where food/drink sources were located (‘community food environment’), but what food/drink items were offered (‘consumer food environment’), a paired approach recommended by food-environment researchers(Reference Caspi, Sorensen and Subramanian1,Reference Lucan7,Reference Rose, Bodor and Hutchinson39) .
The current study also had limitations. For one, the cross-sectional design precluded certainty about identifying non-storefront businesses (which can change day-to-day or even hour-to-hour(Reference Lucan, Maroko and Sanon25,Reference Lucan, Varona and Maroko26) ). If non-storefront businesses were on sampled streets, but at times other than when investigators made assessments, the result would be inflated overall sensitivities of government records. While additional government records could have been obtained to identify farmers’ markets(40) (had any been identified on the ground), past work has demonstrated problems with the accuracy and comprehensiveness of government farmers’ market data too(Reference Lucan, Maroko and Sanon25,Reference Gustafson, Lewis and Wilson41) . Additionally, while it is possible some businesses observed to be closed at the time of ground observations were, in fact, no longer in operation (i.e. not closed temporarily but actually out of business), even excluding such business from consideration would not meaningfully improve sensitivities of government data (PPV would not improve at all).
Another limitation of the current study was a focus on offering foods/drinks as a yes/no proposition, as opposed to finer quantification. Whereas OSB represent a substantial percentage of food/drink-offering businesses, it is not clear that they offer the volume and variety of foods/drinks that stores and restaurants do. Nevertheless, a range of healthful and less-healthful items were available from OSB.
Related to inaccuracies in government records, the current study could not distinguish ‘noise’ (non-differential misclassification) from ‘bias’ (systematic error). Certainly inspections periods are longer for stores than for restaurants(32,34) but, simultaneously, stores are more stable in terms of opening or shutting down than restaurants(Reference Lucan, Maroko and Patel16) (SC Lucan, AR Maroko, A Chen, A Jin, C Pan, G Sosa and CB Schechter, unpublished results). Thus, it is hard to estimate if there would be more systematic error in records for one v. the other, or whether such errors would be associated with any outcomes of interest. The greatest bias for studies aiming to comprehensively measure food environments with inspection data could come from the exclusion of whole categories of businesses; i.e. ‘other OSB’ and street vendors.
A final limitation relates to generalizability, both within the study areas and elsewhere. Both Bronx and UES samples were enriched for street segments having businesses, resulting in elevated business prevalences. Consequently, reported PPV (prevalence-dependent) are likely higher than would be found in simple random samples of street segments and the NPV may be a bit lower. It is possible that city and state inspection data may perform better in other jurisdictions, although past research in both urban settings(Reference Rossen, Pollack and Curriero35,Reference Hosler and Dharssi36) and rural settings(Reference Fleischhacker, Rodriguez and Evenson37) does not suggest it. While there appeared to be some differences in performance of government records in the Bronx v. the UES, differences more likely reflected chance due to small sample sizes than systematic discrepancies. The study areas did differ sociodemographically, but a systematic review showed that study-area sociodemographics did not substantively affect secondary-data validity, at least in other studies(Reference Fleischhacker, Evenson and Sharkey8). For the current study, the overall similarity of findings between study areas is more important than small differences.
Conclusion
Government data from city and state inspection records performed poorly overall for identifying food/drink-offering businesses. Despite generous methodological allowances, government records were neither comprehensive nor accurate for describing food environments compared with ground observation. Some of the problem is that food environments are dynamic; any static description of them will become increasingly inaccurate with the passage of time. Time spans between inspections might allow for considerable change on the ground. Another part of the problem is a complete absence of both ‘other OSB’ and street vendors from government inspection records – at least records providing data on food-source location.
For determining food-source locations, and for determining food-source offerings, ground observation might provide the most complete and accurate information. Still, not all research questions require such detail, and not all research scales and scopes permit primary data collection. Additionally, for historical questions, secondary data may be the only option.
When using secondary data, combining data sets may be one solution(Reference Lucan7). Certainly, the two government inspection data sets in the current study performed better than either alone could have. Additional supplemental records might further improve performance(Reference Hosler and Dharssi36). Other government data (e.g. taxation records or listings of WIC (Special Supplemental Nutrition Program for Women, Infants, and Children) and SNAP (Supplemental Nutrition Assistance Program) retailers) might do better in certain situations, as might some commercial data sets(Reference Fleischhacker, Evenson and Sharkey8). But in the absence of additional data, city and state inspection records should be recognized for their limitations in any research that employs them.
Acknowledgements
Acknowledgements: The authors would like to thank Tod Mijanovich, Jessica Athens and Erilia Wu for help with data preparation and cleaning, and for assistance with data analysis. The authors would also like to acknowledge the following individuals for their help in translating the data-collection sheet used in interacting with street vendors: Nandini Deb and Mahbooba Akhter Kabita for assistance with translation into Bengali; Gustavo Hernandez and Monica Varona for assistance with translation into Spanish. S.C.L. would like to acknowledge A. Hal Strelnick for mentorship. Funding support: S.C.L. is supported by the Eunice Kennedy Shriver National Institute of Child Health and Human Development of the National Institutes of Health (award number K23HD079606). The content of this manuscript is solely the responsibility of the authors and does not necessarily represent the official views of the National Institutes of Health. Student stipends from the Albert Einstein College of Medicine helped support data collection. For data collection and management, the study used REDCap electronic data capture tools hosted through the Harold and Muriel Block Institute for Clinical and Translational Research at Einstein and Montefiore (under grant number UL1 TR001073). This work was also partially supported by the New York Regional Center for Diabetes Translation Research (under grant P30 DK111022). The NYU School of Medicine helped support data cleaning and analyses (through grant number R01DK097347). The funders had no additional role in the design, analysis or writing of this article. Conflict of interest: None of the authors have any conflicts to report. Authorship: S.C.L. co-conceived the study, conducted the literature review, designed the data-collection protocol, oversaw primary data collection, performed analyses and drafted the manuscript (including tables and figure). A.R.M. guided the sampling strategy, performed geocoding and linking of data sets, assisted with data analyses and data interpretation, and created maps for the figure. A.N.P. and I.G. performed primary data collection and assisted with data analysis and interpretation. C.A. helped coordinate acquisition of the government data sets and oversaw match determinations between government data and ground observation. N.R. helped clean the data and make match determinations between data sets. C.B.S. oversaw and conducted data analysis and assisted with data interpretation. B.E. co-conceived the study and provided critical input at all stages. All authors helped revise the manuscript. Ethics of human subject participation: This study did not involve human subjects. Primary data collection from 2015 was approved by the Albert Einstein College of Medicine Institutional Review Board, as part of a broader study, under federal regulations 45 CFR 46.110 and 21 CFR 56.110.
Supplementary material
To view supplementary material for this article, please visit https://doi.org/10.1017/S1368980019002982