


In the USA about 90 % of Americans consume an excess of low-nutrient foods on a daily basis(Reference Krebs-Smith, Guenther and Subar1). In particular, soda, energy drinks and sports drinks are the largest dietary sources of added sugars(Reference Drewnowski and Rehm2). Sugar-sweetened beverages (SSB) have been associated with obesity(Reference Ambrosini, Oddy and Huang3), diabetes(Reference Teshima, Shimo and Miyazawa4,Reference Schulze, Manson and Ludwig5) and CVD(Reference Fung, Malik and Rexrode6,Reference Keller, Heitmann and Olsen7) , and soft drink consumption has been linked to fatty liver(Reference Assy, Nasser and Kamayse8) and weight gain among African-American children(Reference Lim, Zoellner and Lee9,Reference Keller and Torre10) . In order to avoid heart disease and other negative consequences, the American Heart Association recommends that added sugars intake not exceed 418 kJ/d (100 kcal/d) for children and women (equivalent to about 237 ml (8 US fl. oz) of SSB) and 628 kJ/d (150 kcal/d) for men (equivalent about 355 ml (12 US fl. oz) of SSB)(Reference Johnson, Appel and Brands11). Furthermore, the American Heart Association has established a consumption goal of no more than 1883 kJ (450 kcal) from SSB – or fewer than three 355 ml (12 US fl. oz) cans of carbonated cola – per week. Overall consumption of energy-dense nutrient-poor (EDNP) foods has been recommended to be limited to less than 15 % of daily energy intake(12).
Given that high SSB consumers have been considered a prime target of interventions, one analysis of National Health and Nutrition Examination Survey (NHANES) data from 1999 to 2008 defined high consumption of SSB as >2092 kJ/d (>500 kcal/d), which would be the equivalent of 1183 ml (40 US fl. oz) or about three-and-a-half 355 ml (12 US fl. oz) cans. They found that 5 % of children, 16 % of adolescents and 20 % of young adults consumed at least this amount every day, with higher odds of consumption among African Americans and low-income groups(Reference Han and Powell13). With new initiatives to address SSB through taxes or other campaigns, consumption appears to be declining among some populations(Reference Ogden, Kit and Carroll14–Reference Bleich, Vercammen and Koma16). Yet SSB intake remains high among certain sub-populations, including African Americans, the poor and individuals who are obese.
Residents of the Southern part of the USA include a high percentage of African Americans and have high rates of obesity, high rates of poverty(Reference Bleich, Vercammen and Koma16) and high rates of SSB consumption(Reference Kumar, Pan and Park17–Reference Park, Xu and Town19). According to the 2015 Centers for Disease and Control Behavioral Risk Factor Surveillance Survey (BRFSS), the rate of obesity in Alabama and Mississippi is 35·7 and 35·6 %, respectively, but the rate among the states’ African-American residents is 46·5 and 43·7 %, respectively(20). In addition, the rate of diabetes among African Americans is 16·8 % in Alabama and 16·0 % in Mississippi(20).
The Balance Calorie Initiative, an effort sponsored by the American Beverage Association with the top-three beverage companies and the Alliance for a Healthier Generation, is currently underway to shift SSB consumption towards lower-calorie beverages and water consumption(21). In October 2016, the American Beverage Association and the Alliance announced a special initiative in Montgomery, Alabama and the North Mississippi Delta to address the most vulnerable populations.
Specifically, the American Beverage Association announced that it would be changing its marketing strategies in grocery stores, convenience stores and restaurants, including changing how it would display its products and label energy, offer coupons, provide samples, and create in-store messaging.
Because marketing and store factors are associated with purchases(Reference Frank and Massey22–Reference Chevalier25), shoppers are an important group to study as they function as gatekeepers of what foods are brought into the home. While store factors are important, individual attitudes and beliefs about foods likely play a role in what people purchase and consume(Reference Min, Jahns and Xue26–Reference Onufrak, Park and Sharkey28). It is unknown whether people’s view of the healthiness of potential substitute beverages like water may predict SSB consumption or whether SSB consumption is related to the consumption of other EDNP foods in low-income minority populations(Reference Rehm, Peñalvo and Afshin29). It is important to understand the relative importance of SSB in the total diet, as it is possible that other EDNP food consumption may increase if SSB consumption decreases, negating any health benefit from a reduction in SSB consumption. We examined consumption of some EDNP foods as well as assessed beliefs about bottled and tap water. The purpose of the assessment was to document the beverage consumption behaviour of adults and adolescents who would be targeted by the Balance Calories Initiative and to gain a better understanding of the sociodemographic characteristics and other dietary behaviours of groups at risk for high SSB consumption.
Methods
To understand the potential influence of retail marketing on SSB consumption we surveyed customers of local retail outlets where sugary beverages were sold in these communities. We selected the communities targeted by the Balance Calories Initiative along with Birmingham, Alabama and the South Mississippi Delta, chosen due to their similar population density and sociodemographic characteristics, which also makes them more likely to be high SSB-consuming communities.
We created a complete list of grocery stores, supermarkets, convenience stores and restaurants in each community. Outlet types were defined by the North American Industry Classification System (NAICS) as entered in InfoUSA, a database of all local businesses. Supermarkets and groceries were oversampled compared with convenience stores because they sell a much higher volume of beverages. A total of twenty-six retail outlets were selected in each community. North Mississippi Delta communities included Batesville, Clarksville, Marks, Tunica, Robinsonville, Sardis and Sledge. South Delta towns included Yazoo City, Belzoni, Greenwood, Rolling Fork, Cary and Louise. Full details of the selection are described elsewhere(Reference Cohen, Bogart and Castro30). Of the104 outlets, we sought permission to survey their customers and offered to purchase $US 5·00 gift cards from the store, which we offered to customers as an incentive to complete the 5 min survey on beverages attitudes and consumption. We obtained permission from fifty local food outlets (48 %) including Walmart, supermarkets like Winn Dixie and Kroger’s, and small grocery stores and restaurants. Two supermarket chains declined, including Publix and Piggly Wiggly. For the sixteen outlets that did not already have gift cards, we created our own coupons, which the stores endorsed.
We conducted intercept surveys on different days and times of day in front of the food retail outlets between August and November 2016, systematically choosing recruitment times during early evenings and weekends, when we would have access to the largest number of shoppers. We recruited and trained local data collectors (most of whom were African American, similar to the study population). Data collectors obtained informed consent and tracked participation rates. Adults were eligible to participate if they had a child living with them at home, regardless of whether they were a parent or guardian. All adults provided verbal consent. We invited adolescents aged 10–17 years to participate, and they had to obtain a signed consent form from their parent or guardian as well as provide assent. The surveys were self-administered. The procedures were approved by our institutional Human Subjects Protection Committee.
The surveys assessed consumption of beverages including soda, sports and energy drinks, sweetened fruit drinks, 100 % fruit juices, diet drinks and water for the previous day. A single serving of a beverage was defined as 355 ml (12 US fl. oz), the size of the standard can(Reference Bogart, Cowgill and Sharma31). For bottled and tap water we defined a single serving as a cup (237 ml (8 US fl. oz)) or a bottle (437–591 ml (16–20 US fl. oz)). We assessed consumption of energy from EDNP (salty snacks, candy and sweetened baked goods) and fruits and dark green vegetables. One serving was defined as one handful for salty snacks, three average size cookies, one medium Snickers bar for candy, and a fist-sized amount for fruits and vegetables. We also asked about perceived healthiness of water and sugary beverages using a scale of 1–7. Respondents reported individual characteristics including age, gender, race/ethnicity, and their height and weight, from which we calculated BMI as kg/m2. We calculated BMI percentile for adolescents. We also asked about household rules regarding SSB consumption(Reference Bogart, Elliott and Ober32). We asked adults about marital status, education, employment and income. We asked adolescents the number of days they engaged in physical activity for 60 min in the last week, based on national physical activity guidelines of 60 min/d for adolescents. We asked adults the number of days they engaged in moderate and vigorous activity for at least 10 min/d.
Since we did not survey children under 10 years of age, we also asked adults to report on sugary beverage consumption by the oldest child in their home under age 10 years. We defined high consumption as consuming ≥4 cans of any SSB daily for adolescents and adults (2343 kJ (560 kcal) or about 25 % of daily recommended energy intake(33)) and as ≥3 cans daily for children under 10 years of age (1757 kJ (420 kcal), also about 25 % of the mean daily recommended energy intake for age(33)).
Data analysis
We first conducted descriptive statistics for the survey respondents’ characteristics. Finding no differences in SSB consumption between the four communities, we aggregated all the data. We also conducted exploratory analyses for beverage and food consumption outcomes by age and gender groups. To account for multiple confounding covariates, we fit multivariate logistic regression models for estimating the association between sociodemographic characteristics, health beliefs and behaviours and the primary outcome of high consumption of SSB. Sociodemographic predictors included age, gender, race/ethnicity (non-Hispanic White (reference); non-Hispanic African American; Other, including Hispanic). For adults we also included education (less than bachelor’s degree v. bachelor’s degree (reference)), employment (working for pay v. not (reference)), marital status (married v. not (reference)) and household income (<$US 75 000 v. ≥$US 75 000 (reference)). Potential confounders included BMI, rules limiting sugary beverages at home, physical activity (days per week of moderate and vigorous activity), servings of cookies, candies, salty snacks, fruit and dark green vegetables, preferences regarding portion size (large v. small), lower prices and lower calories, and beliefs about the healthiness of tap water and bottled water. The primary outcome was high consumption of SSB. We used a fixed effect for survey locations to control for potential clustering of respondents by the retail outlets in which they were interviewed. Model estimates were reported in the log OR scale, which is the default scale in logistic regressions. Qualitatively, a positive (negative) log OR represents an increase (decrease) in the likelihood of an event. Numerically, a log OR of 1 is always equal to an OR of e ≈ 2·7, but represents a non-linear change in probability, according to the formula:
 $$\Delta P = 1 - {1 \over {1 + \exp \{ [\log (P/1 - P) + 1]\} }} - P,$$
where P is the baseline probability. For example, when P = 0·25, the change in probability is ΔP = 0·378; when P = 0·50, the change in probability is ΔP = 0·231.
Results
After cleaning the data and eliminating 112 surveys where age was out of range for adolescents, we obtained valid surveys from 11 311 adults and 3460 adolescents. Most respondents were female (65 % of adults, 57 % of adolescents) and African American (85 % of adults, 88 % of adolescents).
We reviewed the logs documenting whether those approached agreed to participate or refused. Logs were available for 12 587 potential participants, including 8875 adults and 3328 children (other logs were misplaced). Overall refusal rates were low, with 9 % of females and 12 % of males refusing participation. The refusal rate was 8 % among African Americans, 22 % among Whites and 25 % among Latinos.
The mean age of participants was 38·5 (sd 13·42) years for adults and 13·6 (sd 2·34) years for adolescents. Among adults, 14 % had a bachelor’s degree or higher. Fewer than 11 % lacked a high-school diploma. Thirty-nine per cent were never married and the mean annual income was estimated at $US 23 704, with 54 % earning less than $US 20 000 per year. Among adults, 37 % reported having children under the age of 10 years at home (Table 1).
Table 1 Characteristics of respondents: adults and adolescents aged 10–17 years participating in self-administered intercept surveys outside retail food outlets in Mississippi and Alabama, USA, August–November 2016
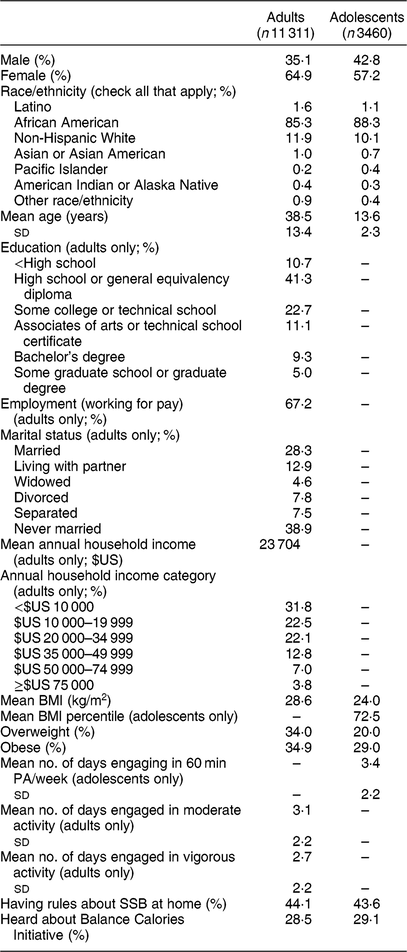
PA, physical activity; SSB, sugar-sweetened beverage.
Adolescents reported engaging in 60 min of physical activity on a mean of 3·4 d/week, while adults reported engaging in moderate activity on 3·1 d/week and vigorous activity on 2·7 d/week. Based on reported height and weight, 35 % of adults could be classified as obese and 34 % overweight. Among adolescents, 28 % reported a height and weight that put them in the 95th BMI percentile or greater (Table 1).
A similar percentage of adults and adolescents reported having rules about drinking SSB at home (44 %). About 28 % of adults and 29 % of adolescents reported having previously heard about the Balance Calorie Initiative (Table 1).
Sugar-sweetened beverage consumption
Regular soda was the most common SSB consumed, with two-thirds of adults and adolescents consuming it in the past 24 h. Males were more likely than females to report drinking sports or energy drinks (50 v. 35 % among adults, 57 v. 41 % among adolescents; P < 0·0001). More than half of all adults and adolescents reported drinking other sugary drinks, like sweetened teas, in the previous day. The percentage of high SSB consumers (≥4 servings/d) was 41 % for adult males, 32 % for adult females, 43 % for adolescent males and 34 % for adolescent females (male – female difference, P < 0·0001; Table 2). Parents reported that ≥3 SSB/d were consumed by 6·7 % of children aged 0–5 years and 6·8 % of children aged 6–9 years (Table 3). Boys aged 0–5 years were slightly less likely than girls to drink ≥3 SSB/d (P = 0·03), but there were no gender differences in high SSB consumption for children aged 6–9 years (Table 3).
Table 2 Beverage/food consumption during the previous day by age group and gender* among adults and adolescents aged 10–17 years participating in self-administered intercept surveys outside retail food outlets in Mississippi and Alabama, USA, August–November 2016
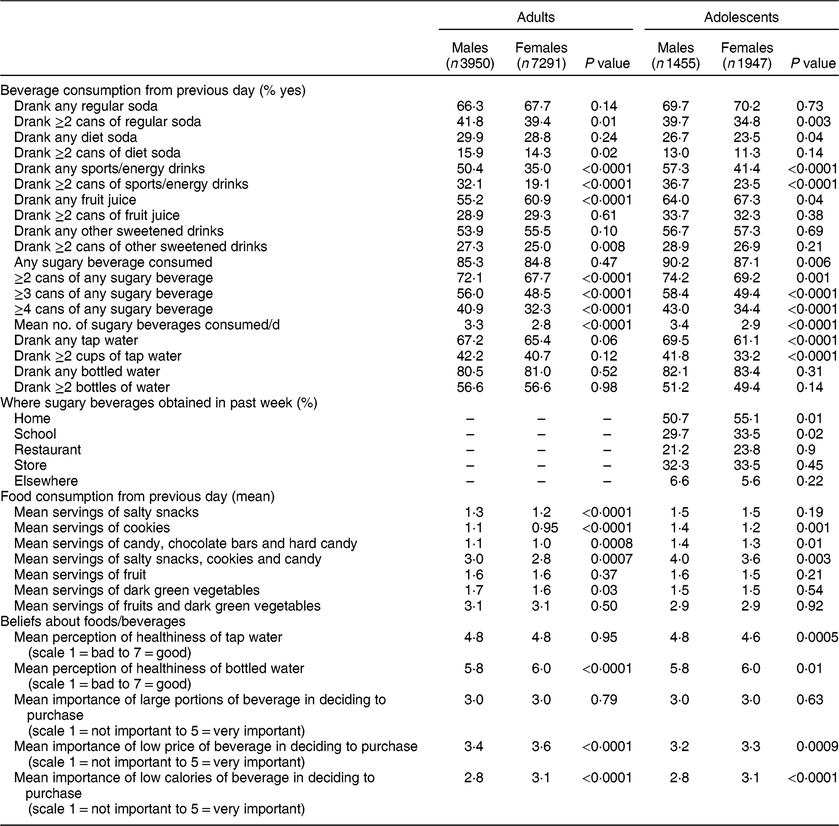
* Binary variables (percentages) were tested by two-sample z tests. Numerical variables (means) were tested by two-sample t tests with equal variance.
Table 3 Parental reports of beverage consumption during the previous day for children under 10 years of age* by adults participating in self-administered intercept surveys outside retail food outlets in Mississippi and Alabama, USA, August–November 2016
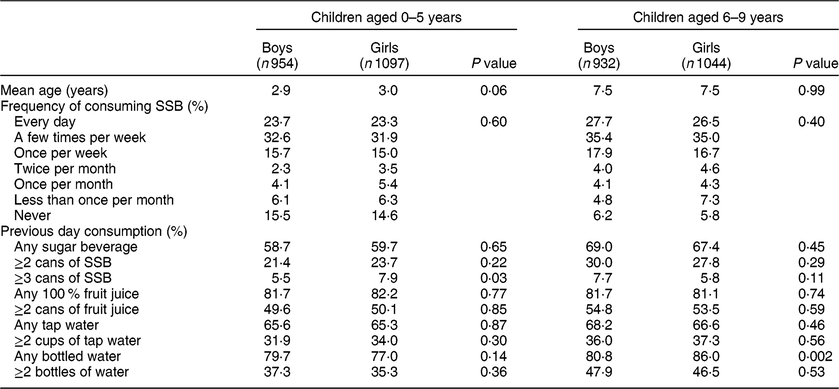
SSB, sugar-sweetened beverage.
* Binary variables (percentages) were tested by two-sample z tests. Numerical variables (means) were tested by two-sample t tests with equal variance. Frequency of SSB consumption was tested using χ 2 tests.
Adolescents reported that home was the most common place they obtained sugary beverages (51–55 %), with stores and schools the second and third most common sources (Table 2). However, given that respondents were allowed multiple choices, 65 % of adolescents also stated they obtained SSB from locations outside the home as well.
Water, diet soda and 100 % fruit juices
Bottled water was the most popular beverage overall, with over 80 % of all age groups reporting consumption in the prior 24 h (Table 2). Tap water was also commonly consumed among 61–70 % of adults and adolescents. Diet soda was not popular, with only 11–16 % reporting consumption of ≥2 cans/d. About half of all age groups reported consuming 100 % fruit juice in the last 24 h.
Low-nutrient (junk) foods
Consumption of low-nutrient foods was also common, with 91 % of adolescents and 86 % of adults consuming at least one serving of salty snacks, cookies or candies in the past 24 h. Salty snacks were more popular than cookies and candy among adolescents (79 v. 64 % cookies and 68 % candy) and also among adults (71 % eating salty snacks v. 56 % cookies and 58 % candy). In aggregate, respondents reported consuming about 3 servings of salty snacks, cookies and/or candy in the past 24 h on average, with adolescent males reporting 4 servings (Table 2).
Gender differences
Gender differences were similar between adults and adolescents, with males consuming greater quantities of all beverages, especially sports drinks (P < 0·0001), and more cookies and candies than females (Table 2). Females were more likely to consider bottled water healthy and to consider that price and low calories were important for a beverage (P < 0·001 and P < 0·0001, respectively).
Predictors of high sugar-sweetened beverage consumption
Adolescents
Among adolescents, models indicated that gender and age were associated with SSB consumption: girls were less likely than boys to be high consumers (log OR = −0·41; P = 0·0002). Age was positively associated with high SSB consumption (log OR = 0·10; P < 0·0001; Table 4).
Table 4 Models predicting high sugar-sweetened beverage consumption (≥4 cans during the previous day) among adolescents aged 10–17 years and adults participating in self-administered intercept surveys outside retail food outlets in Mississippi and Alabama, USA, August–November 2016 adolescents and adults. Estimates are log OR
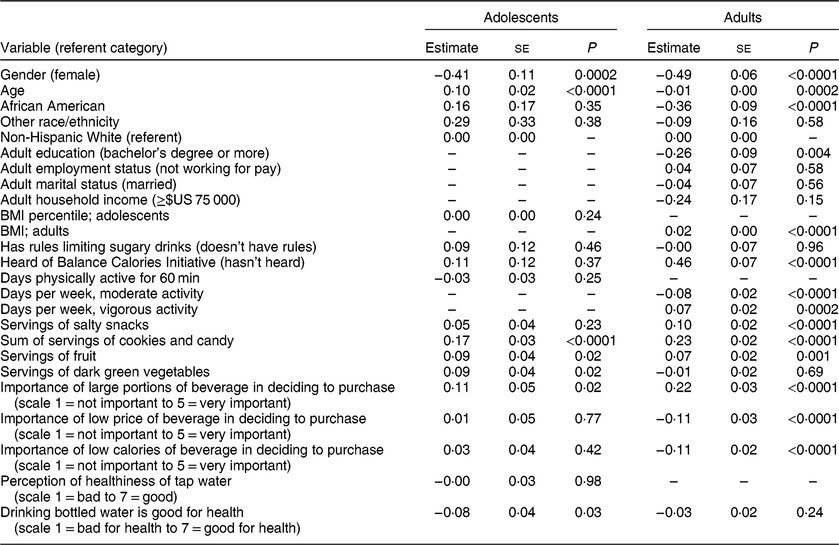
For each additional serving of cookies and candy, the log odds to be a high SSB consumer among adolescents increased by 0·17 (P < 0·0001). Each additional serving of fruit was associated with an increase of 0·09 in log odds of being a high SSB consumer among adolescents (P < 0·05; Table 4).
No statistically significant relationship among adolescents was seen between high SSB and salty snack consumption. However, eating dark green vegetables was associated with high SSB consumption. Adolescents who considered drinking bottled water to be good for health were less likely to be high SSB consumers (log OR = −0·08; P < 0·05).
BMI, having rules about SSB at home, frequency of physical activity, the importance of low price, low calories and perception of whether drinking tap water is healthy were not significantly associated with high SSB consumption among adolescents (Table 4).
Adults
Among adults, women were less likely than men to be high SSB consumers (log OR = −0.49; P < 0·0001). In contrast to adolescents, where high SSB consumption increased with age, the likelihood of being a high SSB consumer was lowered with each additional year of age (log OR = −0·01; P = 0·0002). In this population, African Americans were less likely to be high SSB consumers than Whites who answered the survey. Adults with a bachelor’s degree were less likely to be high SSB consumers (log OR = −0·26, P = 0·004). A higher BMI was also associated with high SSB consumption. For every increase of a BMI unit, the log odds of being a high SSB drinker increased by 0·02 (P < 0·0001; Table 4).
Physical activity had a mixed relationship with high SSB consumption. For each day of moderate physical activity, respondents had lower log odds of being a high SSB drinker (log OR = −0·08, P < 0·0001); but for each day of vigorous activity, a higher log odds of high SSB consumption was found (log OR = 0·07, P = 0·0002). Higher consumption of salty snacks, cookies and candy, and fruit were associated with higher odds of being a high SSB consumer. Having rules at home about SSB was not associated with adults having lower odds of being a high SSB consumer (see Table 4).
Considering the number of calories in a beverage to be important was negatively associated with high SSB consumption (log OR = −0·11, P < 0·0001). Perception of the healthfulness of bottled water was not related to high SSB consumption, but considering tap water as healthful was associated with a lower risk of high SSB consumption. Having heard about the Balance Calories Initiative was positively associated with high SSB consumption among adults (log OR = 0·46, P < 0·0001; Table 4).
Discussion
We found that a very high percentage of adults and adolescents were high SSB consumers, with 43 % of adolescent males, 41 % of adult males, 34 % of adolescent females and 32 % of adult females consuming at least 2343 kJ (560 kcal) from SSB daily. This is among the highest values that have been reported in the literature and previous studies have not examined smaller regional geographies(Reference Park, Xu and Town19,Reference Babey, Jones and Yu34–Reference Park, McGuire and Galuska39) . A recent analysis of NHANES data from 2013 showed that the 90th percentile of adolescents’ daily SSB consumption was 2 servings(Reference Mendez, Miles and Poti40) and an analysis of the National Health Interview Survey found that the mean daily consumption of SSB in the Southern USA was only 1·6 servings(Reference Park, McGuire and Galuska39). The local data from our representative convenience sample complement research using nationally representative samples and provide more specific information on the types and quantities of sugary beverages consumed.
The population in the South has cultural habits that facilitate this high level of SSB consumption, for example a tradition of serving sweetened teas and punches at meals(41). There is also a pattern of extensive commercial promotion of sugary beverages(Reference Kumar, Pan and Park17). Nevertheless, bottled water was the most popular beverage (>80 %) and diet sodas were preferred by a minority of respondents (<30 %). The popularity of bottled water is promising in that adults and adolescents may be willing to substitute more sugary beverages with water in the future. In particular, among adolescents, perceiving bottled water as healthy was associated with lower odds of being a high SSB consumer, while among adults, perceiving tap water as healthy was associated with lower odds of being a high SSB consumer.
Beyond the high consumption of SSB, we also found high consumption of low-nutrient processed foods. If a serving of candy is at least 628 kJ (150 kcal) and if servings of cookies and salty snacks are at least 418 kJ (100 kcal) each, the mean daily consumption of these ranges from 1515 to 1695 kJ (362 to 405 kcal) for adults and from 1946 to 2092 kJ (465 to 500 kcal) for adolescents – almost the same as consumed in sugary beverages, which has a mean of between 1640 and 1992 kJ/d (392 and 476 kcal/d). Combined, this suggests that nearly half of the energy requirement consumed by this population is comprised of low-nutrient foods. While a great deal of attention has been paid to the negative associations between liquid kilojoules, obesity and chronic diseases, excess kilojoules from other EDNP foods have a similar impact on obesity and chronic diseases. Reductions of kilojoules from any source (i.e. fats v. carbohydrates) appear to contribute relatively equally to weight loss(Reference Gardner, Trepanowski and Del Gobbo42). Improving overall diet quality will likely be necessary for optimal dietary health rather than simply eliminating SSB consumption(Reference Arsenault, Lamarche and Després43).
Most adolescents reported getting sugary beverages at home, which means that shoppers for the households are likely purchasing these supplies. Having rules about SSB consumption at home was not significantly associated with high SSB consumption for adults or adolescents. Prior research suggests that there may be few consequences for breaking rules about SSB at home(Reference Bogart, Cowgill and Sharma31) and thus such rules may not have much impact on adolescents’ behaviour. In the present study, although nearly half of adolescents reported getting SSB at home, 65 % also obtained SSB from sources away from home. Thus, the ability of families to limit SSB access may be difficult for their adolescents who drink SSB outside the home.
Another modifiable factor associated with high consumption of SSB was moderate physical activity rather than vigorous physical activity among adults. This may be because vigorous physical activity is associated with sweating and thirst. People may have the mistaken perception that SSB are an appropriate thirst quencher, an idea promoted by advertisements linking SSB to sports. This could explain some individuals drinking more SSB after vigorous exercise. There may be less perceived need to drink SSB after moderate exercise like walking.
Study limitations and strengths
Although supermarkets like Publix and Piggly Wiggly and some restaurants declined to allow surveys of their customers, we have no reason to believe that their customers are fundamentally different from shoppers at Winn Dixie, Kroger’s or Wal-Mart or diners at the restaurants that agreed to participate. The respondents selected were customers, who would likely be exposed to the Balance Calories Initiative campaign once it began, but their responses may not be fully generalizable to non-shoppers or to other study areas. However, shoppers likely influence what others in their household eat.
Another caveat threatening generalizability is the differential refusal rates by gender and race/ethnicity, which we partly addressed by including gender and race/ethnicity in statistical models. The highest refusal rates were among Latinos, which may have been due to fear of legal issues, and these may have been heightened because data collection occurred during the pre-election season of 2016, when immigration and building a wall at the Mexican border were being debated. The lowest refusal rate was among African Americans, possibly because most of the field staff were African American, which may have made participants somewhat more comfortable, as people are generally more trusting of individuals who appear similar to themselves(Reference Dijksterhuis, Spears and Lépinasse44). Another limitation is that height and weight were self-reported; height is likely to be over-reported and weight is likely to be under-reported(Reference Park, Mitrou and Keogh45) and misreporting rates can vary by region of the USA. One study comparing self-report of height and weight with objective measures showed that people in Mississippi and Alabama underestimated their BMI, but were actually more accurate than respondents from states like Missouri, Minnesota and Wisconsin(Reference Le, Judd and Allison18).
Study strengths include a very large sample with a low refusal rate, the focused geographic sampling and a highly detailed inventory of beverages consumed.
Conclusion
Interventions, both local and national, are needed to improve dietary intake among low-income populations. Given the very high rates of high SSB consumption, SSB should be a primary target. Therefore, the communities chosen by the Balance Calories Initiative are appropriate, but evaluation of the Balance Calories Initiative should assess whether declines in sugary drinks are compensated by increases in other low-nutrient foods. EDNP foods like salty snacks, candy and sweetened baked goods likely contribute as many (or even more) kilojoules as SSB to the daily diet and their consumption could be increased if consumers switch to lower-calorie beverages. Future campaigns should aim to limit the consumption of energy from all EDNP foods.
Acknowledgements
Acknowledgements: The Project Officer, Tina Kauh, provided some feedback on the first draft of this article. Financial support: This work was supported by the Robert Wood Johnson Foundation (grant number 73587). The Robert Wood Johnson Foundation had no role in the design, analysis or writing of this article. Conflict of interest: None. Authorship: D.A.C. took the lead in preparing the manuscript and study design. L.M.B. contributed to the development of the survey instrument and data analysis. B.H. oversaw the statistical analysis. S.W. conducted the first line analyses and prepared the tables. G.C. was responsible for quality control of data collection and entry. All co-authors contributed to manuscript preparation. Ethics of human subject participation: This study was conducted according to the guidelines laid down in the Declaration of Helsinki and all procedures involving human research participants were approved by the RAND Human Subjects Protection Committee. Written consent and assent were obtained for adolescents and verbal informed consent was obtained from adults, but not recorded to assure confidentiality.


