


Studies investigating the association between maternal nutrition and adverse birth outcomes have produced conflicting results(Reference Allen1–Reference Villar, Merialdi and Gulmezoglu9). Fall et al.(Reference Fall, Yajnik and Rao4) pointed out that the scientific literature exploring maternal nutrition and birth outcome associations has been dominated by studies of single macro- or micronutrients. However, inadequate maternal nutrition is most likely to be found among low-income populations who are at risk of multiple nutrient deficiencies, so the single-nutrient, reductionist approach is illogical. The more logical approach of evaluating overall diet quality has been inadequately tested(Reference Fall, Yajnik and Rao4, Reference Allen10, Reference Haider and Bhutta11). Furthermore, most of the existing observational and experimental studies have evaluated or supplemented maternal nutrient intakes only during pregnancy. There is a growing body of literature showing associations between periconceptional maternal nutrition and various adverse birth outcomes(Reference Goh, Bollano and Einarson12–Reference Scholl16), raising the need for more attention to be given to pre-pregnancy maternal nutritional status(Reference Moore, Davies and Willson7, Reference Mitchell, Robinson and Clark13, Reference Relton, Pearce and Parker14, Reference Cucó, Arija and Iranzo17).
FFQ are a widely utilized method for evaluating diet–disease associations(Reference Block18–Reference Willett21). While absolute nutrient intakes obtained using FFQ are only estimates, the primary value of this method is its usefulness for ranking the population into levels of exposure in order to evaluate the risk for a specified health outcome(Reference Willett21). It is well established that the number of foods needed to explain the between-person variation in nutrient intake is smaller than the number of foods needed to explain absolute nutrient intake(Reference Willett21–Reference Stryker, Salvini and Stampfer23). Thus, a specific mini-FFQ based on a short list of ‘discriminating’ foods that explain a high proportion of the between-person variation for targeted nutrients can be utilized to efficiently rank populations into nutrient intake exposure levels for studying diet–disease relationships(Reference Shai, Shahar and Vardi24). Since, however, the foods that contribute the most to between-person variation are unique for each population, it is necessary to identify these key foods for each specific culture or population.
We aimed to develop a short, targeted FFQ (TFFQ) to evaluate the dietary intake of pregnant Bedouin Arab women in a low-income, ethnic minority community in southern Israel who were participating in the Dietary Exposures and Pregnancy Outcomes in a Society In Transition (DEPOSIT) cohort study. The TFFQ was designed to assess the habitual, pre-pregnancy intake (over the past year, prior to becoming pregnant) of targeted nutrients that have been investigated for associations with pregnancy outcome (e.g. protein, Fe, folate, Zn, Ca and n-3 fatty acids) and that affect maternal body stores, nutritional status and readiness to carry a healthy pregnancy to term(Reference Allen1, Reference Moore, Davies and Willson7, Reference Villar, Merialdi and Gulmezoglu9, Reference Allen10, Reference Scholl16, Reference Hornstra25). We used the TFFQ to build a multi-nutrient scale for ranking the DEPOSIT participants into exposure levels of habitual nutrient intake and tested its relative validity against the women’s reported nutrient intakes on a 24 h recall questionnaire.
Subjects and methods
Bedouin population background
Bedouin Arabs living in the Negev desert in southern Israel were traditionally a semi-nomadic population(Reference Groen, Balough and Levy26); however, they have undergone a process of sedentarization over the past 60 years(Reference Abu-Saad, Weitzman and Abu-Rabiah27) and approximately half of the population now lives in government-planned, urban-style towns(28, Reference Swirski and Hasson29). Their socio-economic status, as measured by education and income levels, is the lowest of any population group in Israel(Reference Swirski and Hasson29, 30). The Negev Bedouin have unique dietary patterns that involve using bread to eat from common plates, which results in a high bread intake (>30 % of total energy)(Reference Abu-Saad, Shahar and Abu-Shareb31, Reference Fraser, Bilenko and Vardy32).
Study design
There was no existing FFQ for the Negev Bedouin population. We therefore used the data from the Bedouin Nutrition Study (BNS) to develop a data-based TFFQ. The BNS, which has been described in detail elsewhere(Reference Abu-Saad, Shahar and Abu-Shareb31, Reference Abu-Saad, Shai and Kaufman-Shriqui33), was conducted during 2001–2003 and was based on a convenience sample of 519 Bedouin adults that included a broad geographical cross-section of the population. Dietary intake data were collected using a US Department of Agriculture (USDA) 24 h recall questionnaire modified for estimating individual intake from common-plate meals(Reference Abu-Saad, Shahar and Abu-Shareb31).
The sample for the DEPOSIT study (n 683), conducted from 2003 to 2006, was recruited from among parous Bedouin women with singleton pregnancies who were attending the prenatal care clinics of the Ministry of Health or the outpatient prenatal care clinic of the main regional hospital, Soroka University Medical Center. Both services are provided for a relatively low co-payment ($US20–$50 every 6 months). Enrolment in the DEPOSIT study, utilizing only the 24 h recall questionnaire for dietary assessment, began before the TFFQ was completed. Once the TFFQ was completed (August 2003), both the TFFQ and a 24 h recall questionnaire were administered to all women subsequently enrolled (n 404).
All participants signed informed consent forms, and the BNS and DEPOSIT studies were approved by the Helsinki Committee (Institutional Review Board) of Soroka University Medical Center.
Nutrient database and targeted FFQ development
We used the food composition tables of the S. Daniel Abraham International Center for Health and Nutrition, which were based on the USDA Nutrient Database for Standard Reference Release SR19, and modified to include common Israeli(Reference Shahar, Shai and Vardi34) and Bedouin(Reference Abu-Saad, Shahar and Abu-Shareb31) foods and recipes. The validated EuroFIR recipe calculation method was used to determine the nutrient composition of the recipes(Reference Chen, Gilbert and Khokhar35). The method used to develop the validated Israeli FFQ(Reference Shai, Rosner and Shahar36) was also used to develop the TFFQ for pregnant Bedouin women. The foods reported in the 24 h recall data of the BNS were aggregated into conceptually similar groups based upon their content per portion of the target nutrients. Afterwards, the food groups were entered into a stepwise multiple regression model according to their specific nutrient content and the frequency of intake in the population. This procedure was repeated for each of the eight nutrients of interest. The food groups that explained at least 80 % of the between-person variability for each of the nutrients of interest were considered for the final TFFQ(Reference Willett21). Preliminary analysis of the BNS data indicated that low-cost sweetened soft drinks and cakes/cookies made a significant contribution to energy intake in this population, but little or no contribution to the intake of important micronutrients (K. Abu-Saad, unpublished results). We added these items (as two additional, separate food groups) to the TFFQ because of an interest in exploring their potential role in displacing more nutrient-rich foods. The nutrient densities of the food groups were assigned according to the main item consumed within the food group.
Targeted FFQ and 24 h recall administration
Targeted FFQ
Trained interviewers conducted the dietary interviews in Arabic. The TFFQ was piloted among forty-three pregnant Bedouin women attending prenatal care clinics who were not enrolled in the DEPOSIT study to establish the feasibility of using an FFQ in this population. After the successful completion of the pilot, the TFFQ was administered to DEPOSIT participants upon enrolment, prior to administration of the 24 h recall questionnaire. Participants were asked to report their habitual intake of the TFFQ foods prior to the pregnancy, as well as to indicate if their intake remained the same, increased or decreased during the current pregnancy. Due to the difficulties inherent in determining portion sizes for foods eaten from common plates(Reference Abu-Saad, Shahar and Abu-Shareb31, Reference Abu-Saad, Shai and Kaufman-Shriqui33), the TFFQ did not require the respondents to specify portion sizes. Instead, we estimated standard portion sizes by aggregating the data from the DEPOSIT respondents’ 24 h recall questionnaires to obtain the mean portion size for each food, as consumed in our sample of pregnant women.
24 h recall
We used a modified USDA 24 h recall questionnaire(Reference Abu-Saad, Shahar and Abu-Shareb31, 37) and the standardized five-pass method(Reference Conway, Ingwersen and Vinyard38) to assess the women’s daily dietary intake during pregnancy. The interviewers used a USDA food book and a food models/portion-size booklet modified to include common Israeli foods and Bedouin foods, utensils and portion sizes.
Development of the Habitual Multi-Nutrient Intake Scale
Target nutrient intakes obtained from the TFFQ were ranked for each nutrient and participants were divided into quartiles according to their ranking for each of the eight target nutrients. Due to collinearity (correlation coefficient greater than 0·70) between many of these nutrients, we created the Habitual Multi-Nutrient Intake Scale (H-MNIS) to enable the simultaneous evaluation of their combined intake levels. The H-MNIS score was computed as the average value for the ranked quartiles of protein, Ca, Fe, Zn, folate, α-linolenic acid (ALA), EPA and DHA. This resulted in a continuous measure where the lowest possible value was 1·0 if a woman was defined in the lowest quartile for all nutrients and the highest was 4·0 if she was included in the highest quartile for all nutrients. The individual H-MNIS scores were ranked once more, and this final ranking was partitioned into quartiles that divided the participants into four multi-nutrient intake exposure levels. To assess the effectiveness of the H-MNIS for ranking individuals into nutrient exposure levels, the mean intake levels of the targeted nutrients, as reported in the 24 h recall questionnaires for all DEPOSIT participants who had both a TFFQ and a 24 h recall, were examined by H-MNIS quartiles. Since the TFFQ and 24 h recalls measured dietary intake in distinctly different periods (pre-pregnancy and during pregnancy, respectively), we also assessed the effectiveness of the TFFQ ranking only among women who reported not making any changes during pregnancy from their pre-pregnancy diet.
Statistical analysis
We conducted all statistical analyses using the SPSS statistical software package version 14·0 (SPSS Inc., Chicago, IL, USA). For the TFFQ development, all food items reported on the BNS 24 h recalls were aggregated into ninety-three groups and the means of all foods included in the aggregated group were used in the model, weighted by the frequency of consumption of that item. We used stepwise regression models to assess the contribution of each food group to the total intake and the between-person variability of the selected nutrient, with the individual food groups as the independent variables and total nutrient intake as the dependent variable. The rank procedure was used to rank participants into target nutrient intake levels. ANOVA and the test for linearity were used to examine mean nutrient intake levels from the DEPOSIT 24 h recalls by H-MNIS quartiles.
Results
Of the ninety-three food groups derived from the BNS 24 h recall data (used to develop the TFFQ), twenty-eight explained over 80 % of the between-person variability in the intake of protein, Ca, Fe, Zn, folate, ALA, DHA and EPA. These twenty-eight food groups also accounted for over 75 % of the between-person variability in energy intake and 69 % of the absolute energy intake. The number of food groups it took to explain at least 80 % of the between-person variance in protein (n 5), Fe (n 5), Zn (n 4), Ca (n 8), folate (n 5) and ALA (n 12) intake also explained 40–62 % of the total intake of these nutrients. Whole-wheat and unfortified white-flour bread emerged as main discriminators for most of the nutrients, despite their relatively low nutrient density. Ethnic foods such as humus salad and za’atar (thyme mixed with sesame seeds and olive oil) emerged as discriminators for dietary folate, Fe and Ca intakes. The most nutrient-rich foods, such as liver, red meat, yellow and salty white cheeses and fish, tended to make high contributions to explaining between-person variation, but relatively low contributions to total intake of the target nutrients. Only two food groups were needed to explain ≥88 % of the between-person variation in DHA (fish and poultry) and EPA (fish and canned tuna) intakes. Since many of the TFFQ food groups were sources of a number of the target nutrients, all of the TFFQ food groups together accounted for over 75 % of the total protein, Ca, Fe, Zn, ALA, DHA and EPA intakes, and 64 % of the total folate and ALA intakes.
Tables 1 and 2 demonstrate the differences between contributions to between-person variation and contributions to total intake of protein and Ca, respectively. Red meat made the third highest contribution to explaining the between-person variation in protein intake and had one of the highest protein densities (22 g/100 g); however, it contributed only 6 % to total protein intake, while the second and fourth highest contributors to explaining between-person variation, white and whole-wheat bread, each contributed 18 % to total protein intake, despite their much lower protein densities (<10 g/100 g; Table 1). Salty white cheese, with a Ca density of 493 mg/100 g, was the third highest contributor to explaining between-person variation in Ca intake, but it contributed only 1 % to total Ca intake. Whole-wheat and white bread were the fourth and fifth highest contributors to between-person variation in Ca intake and, despite their low calcium densities (24 mg/100 g and 11 mg/100 g, respectively), together accounted for 13 % of the total Ca intake (Table 2).
Table 1 Contributions of specific food groups to between-person variation (using stepwise multiple regression analysis) and total intake of protein
BNS, Bedouin Nutrition Study.
Table 2 Contributions of specific food groups to between-person variation (using stepwise multiple regression analysis) and total intake of calcium
BNS, Bedouin Nutrition Study.
Whole-wheat bread (2 mg Fe/100 g) was both the main discriminator and the highest contributor (28 % of total intake) to dietary Fe intake. The most Fe-dense and bioavailable sources of Fe (red meat and liver) were also main discriminators in this population, but accounted for only 2 % and 4 % of total Fe intake, respectively (Fig. 1). Similarly, liver (260 μg folate/100 g) was the highest contributor to explaining between-person variation in folate intake, but accounted for only 7 % of the total folate intake; while the fourth and fifth highest contributors to explaining between-person variation, white and whole-wheat bread (<30 μg/100 g), accounted for 15 % and 11 % of total folate intake, respectively (Fig. 2). For EPA, the main discriminator, fish (60 mg EPA/100 g), explained 60 % of between-person variation (Fig. 3). Poultry (10 mg EPA/100 g) did not emerge as a main discriminator because it was beyond the cut-off point for explaining at least 80 % of between-person variation; however, it was the highest contributor to total EPA intake (47 %).
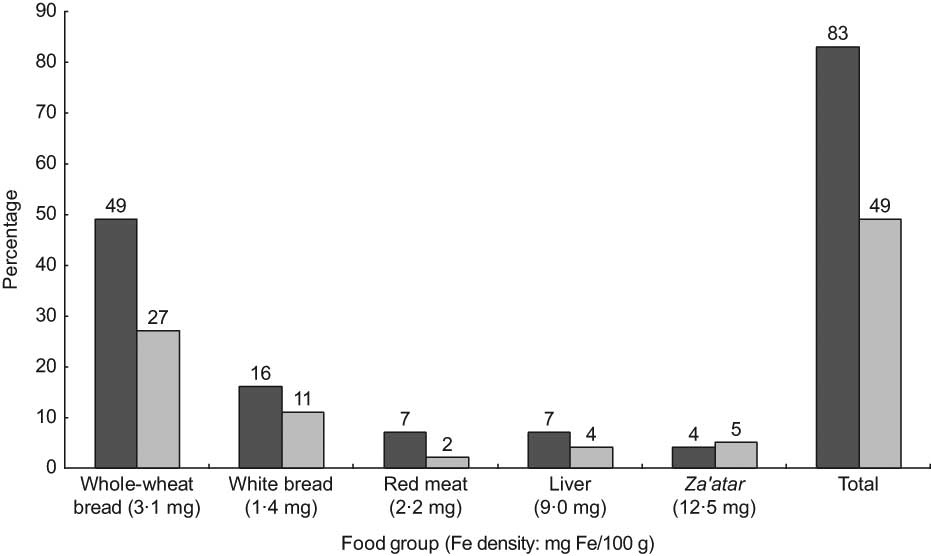
Fig. 1 Main discriminators and contributors to dietary iron intake from food (![]() , contribution to between-person variation;
, contribution to between-person variation; ![]() , contribution to total intake) in the Bedouin Nutrition Study, ranked by contribution to between-person variation (R 2)
, contribution to total intake) in the Bedouin Nutrition Study, ranked by contribution to between-person variation (R 2)
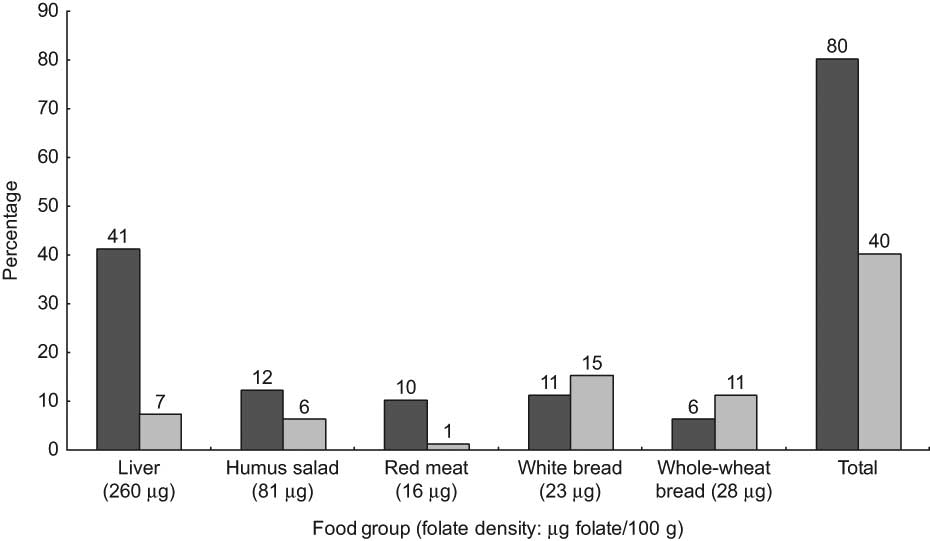
Fig. 2 Main discriminators and contributors to dietary folate intake from food (![]() , contribution to between-person variation;
, contribution to between-person variation; ![]() , contribution to total intake) in the Bedouin Nutrition Study, ranked by contribution to between-person variation (R 2)
, contribution to total intake) in the Bedouin Nutrition Study, ranked by contribution to between-person variation (R 2)
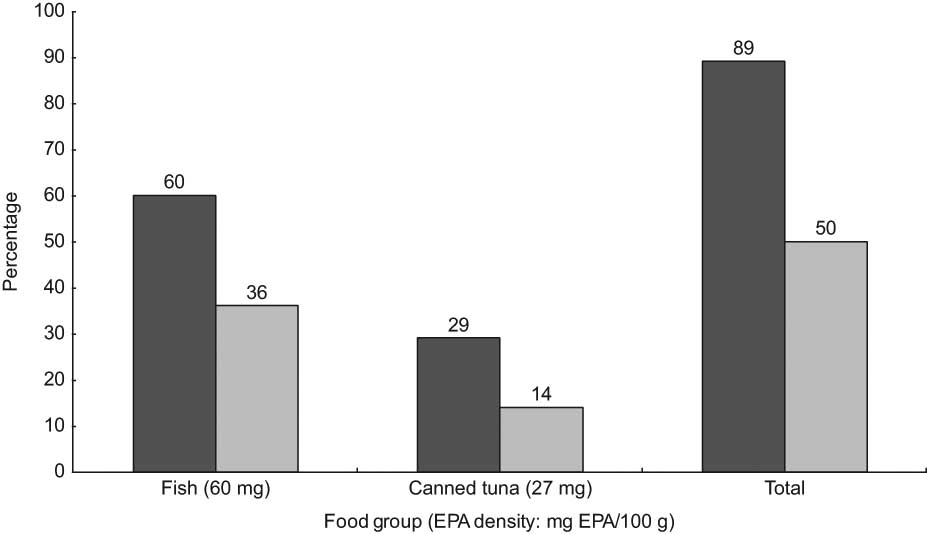
Fig. 3 Main discriminators and contributors to dietary EPA intake from food (![]() , contribution to between-person variation;
, contribution to between-person variation; ![]() , contribution to total intake) from food in the Bedouin Nutrition Study, ranked by contribution to between-person variation (R 2)
, contribution to total intake) from food in the Bedouin Nutrition Study, ranked by contribution to between-person variation (R 2)
The TFFQ, which was developed during the ongoing DEPOSIT study (n 683), was administered to 404 participants, among whom the mean (sd) age was 28 (6) years and mean (sd) parity was 3·7 (2·5; Table 3). Most women were non-smokers (98·0 %) and unemployed (94·3 %), while 27·5 % of their husbands were unemployed. The mean (sd) H-MNIS score for the total sample was 2·5 (0·8); mean (sd) scores for the first to fourth H-MNIS quartiles were 1·5 (0·3), 2·2 (0·2), 2·8 (0·2) and 3·6 (0·3), respectively, from a possible range of 1·0–4·0. Table 4 shows the mean intake levels of the target nutrients by H-MNIS quartiles. Intakes increased from the lowest to highest H-MNIS quartile group, and the differences between the groups were significant for all nutrients except folate, EPA and DHA. The P for trend across the H-MNIS quartiles was significant for all nutrients except EPA, which was marginally significant (P = 0·051). Since the TFFQ assessed habitual, pre-pregnancy dietary intake, and the DEPOSIT 24 h recall assessed short-term daily intake during pregnancy, we re-ran ANOVA including only the women (86 %) who reported not changing their diet during pregnancy. The level of significance for differences between the H-MNIS quartiles and the P for trend increased for all target nutrients except for DHA and EPA (data not shown).
Table 3 Selected characteristics of the DEPOSIT participants who completed the TFFQ (n 404)
DEPOSIT, Dietary Exposures and Pregnancy Outcomes in a Society In Transition; TFFQ, targeted FFQ.
Table 4 Mean (standard deviation) intake from 24 h recall of nutrients targeted on the TFFQ by quartiles of the H-MNIS (n 404)
TFFQ, targeted FFQ; H-MNIS, Habitual Multi-Nutrient Intake Scale; ALA, α-linolenic acid.
Discussion
We developed a targeted FFQ (TFFQ) for ranking Bedouin women into exposure levels by their habitual, pre-pregnancy intake of multiple nutrients that are important for a healthy pregnancy and birth outcome. The TFFQ included twenty-eight out of a total ninety-three conceptually similar food groupings regressed from the 519 BNS participants’ 24 h recall data. The foods included in the TFFQ explained over 80 % of the between-person variation in the intake of the eight target nutrients (protein, Fe, Zn, Ca, folate, ALA, DHA and EPA) and, in most cases, also accounted for over 75 % of the total intake of the target nutrients. The H-MNIS, constructed from the TFFQ data, effectively ranked women into exposure groups of target nutrient intakes according to their reported intakes on the DEPOSIT 24 h recalls.
The TFFQ serves as a rapid assessment tool since relatively few food groups were needed to explain >80 % of the variance in most target nutrients (two groups for DHA and EPA; four or five groups for protein, Fe, Zn and folate; and eight for Ca). An FFQ developed in Japan required fifteen and seventeen food groups to explain 85–86 % of the variance in protein and Fe intakes, respectively(Reference Tokudome, Goto and Imaeda39). In an ethnically heterogeneous Jewish population in southern Israel (including Asia/North Africa-born, Europe/America-born and Israeli-born groups), twelve food groups (differing slightly for each ethnic group) were needed to explain from 73 % to 80 % of the between-person variance in Zn intake(Reference Shahar, Shai and Vardi34), and eleven food groups were needed to explain 80 % of the between-person variation in folate intake for the whole sample(Reference Shai, Shahar and Vardi24). The Bedouin, in contrast, represent a single, more homogeneous ethnic group. Thus, the difference in ‘number’ of main discriminating foods that need to be included in an FFQ is related to the ethnic, cultural and dietary heterogeneity of the population.
Whole-wheat bread emerged as a main discriminator for most of the target nutrients, despite its low nutrient density compared with animal-source foods. It, nevertheless, compares favourably to the alternative staple foods consumed by this population (e.g. unenriched white rice and white flour). Whole-wheat bread is higher than unenriched white rice in protein (9 g v. 3 g), Ca (24 mg v. 10 mg), Fe (3·1 mg v. 0·2 mg), Zn (2·0 mg v. 0·5 mg) and folate (28 μg v. 3 μg) per 100 g; and higher than unfortified white bread in Fe (3·1 mg v. 1·4 mg), Zn (2·0 mg v. 0·6 mg) and Ca (24 mg v. 11 mg) per 100 g. Our dietary assessment data show that the Bedouin, whose socio-economic status is the lowest in Israel, obtain a much higher percentage of their total energy from carbohydrates than the Jewish population in the Negev (63–64 % v. 53 %)(Reference Fraser, Bilenko and Vardy32, Reference Abu-Saad, Shai and Kaufman-Shriqui33). Thus, the nutrient density of the Bedouins’ primary sources of carbohydrates emerged as key to ranking the population into intake exposure groups, for micronutrients in particular.
Many of the short FFQ found in the literature that were developed to target a small number of nutrients or food groups in various populations included the foods most commonly eaten or contributing the most to total intake of the targeted food groups/nutrients(Reference Anderson, Johansson and Solvoll40–Reference Pufulate, Emery and Nelson43). Food lists based upon the major contributors to nutrient intake in a population may be less effective at discriminating between different levels of intake, precisely because they ask about the foods that tend to be eaten by everyone in the population. Short, targeted FFQ based on the list of foods derived from stepwise multiple regression that contribute the most to the variation in the intake in the population, contain foods that make ideal discriminators for ranking the population, but may not be major contributors to the total intake of a nutrient in a population. For example, Shai et al.(Reference Shai, Shahar and Vardi24) found that carbonated soft drinks were the best discriminators for energy intake in the Israeli Jewish population in southern Israel, explaining 11 % of the between-person variance, even though this item contributed only 2 % to their total energy intake. Consumption of organ meat accounted for 47 % of the between-person variance in folate intake, but only 5 % of the total folate intake in the population. Similarly, in the BNS data used for developing our TFFQ, liver accounted for 41 % of the between-person variation in folate intake among the Bedouin adults surveyed, but only 7 % of the total folate intake. Theoretically, it is possible that some of the main contributors to the total intake of a nutrient may not appear on a short FFQ designed for ranking. In practice, our TFFQ included both the rich but less common food sources of a nutrient, as well as food sources that were both main discriminators and main contributors to total intake in the population with all of the target nutrients except for EPA. However, the food groups on the TFFQ, taken together, explained a higher proportion of the variation in nutrient intake in the population (generally over 85 %) than of the total nutrient intake (generally between 65 % and 75 %).
A limitation of the present study is that the BNS and DEPOSIT samples were not drawn randomly, due to the practical and logistical difficulties of obtaining a random sample of the population because standard sampling frameworks (e.g. census data with street addresses, telephone directories, etc.) do not include the rural Bedouin population. Nevertheless, both samples included a broad geographical cross-section of Negev Bedouin adults from both rural and urban settings, and represent the only comprehensive, quantitative dietary assessments conducted in this ethnic minority population to date, to the best of our knowledge. Another limitation is that in the DEPOSIT study the TFFQ and 24 h recall were administered to pregnant Bedouin women in the same interview. However, the more general, abstract instrument (TFFQ) was administered prior to the 24 h recall and is unlikely to have affected responses to the latter, since the 24 h recall requires a different cognitive process and is focused on the very concrete tasks of recalling and describing everything eaten on the previous day. In addition, we asked about different periods for the TFFQ (habitual, pre-pregnancy) and the 24 h recall (daily pregnancy intake), which also reduces the chances that the respondents would feel a need to make their responses to the TFFQ consistent with those on the 24 h recall. In addition, neither the TFFQ nor the 24 h recall was self-administered, but rather both were administered by trained interviewers who used appropriate probes and reporting aids for each instrument.
A major strength of the study was that the TFFQ was derived from 24 h recall data from a specific ethnic minority population to identify the best discriminating foods for the targeted nutrient intakes in that same population. It was further used to develop the H-MNIS which effectively ranked a sample of Bedouin women by their intake of the target nutrients as reported on the 24 h recall. Among the nutrients for which the main discriminators were also main contributors to total intake (protein, Ca, Fe, Zn and ALA) the P for trend across H-MNIS quartiles was ≤0·001. In the cases of folate, DHA and EPA, the main discriminators were foods with high nutrient densities which were episodically consumed and thus were not the main contributors to total intake (e.g. liver, fish). For nutrients such as these, the FFQ is likely to be provide a better approximation of true intake than is a single 24 h recall, since the chance consumption of a food with high nutrient density on the recall day by someone who consumes the food less than once monthly, or the chance non-consumption of such a food for someone who generally consumes it once weekly, would result in inaccurate estimates of these individuals’ usual intake. Alternatively, FFQ data on such episodically consumed foods can be used to improve the precision of nutrient intake estimates from other dietary assessment measures such as the 24 h recall, as Tooze et al.(Reference Tooze, Midthune and Dodd44) and Kipnis et al.(Reference Kipnis, Midthune and Buckman45) have shown.
In conclusion, we developed a rapid assessment TFFQ and multi-nutrient intake scale that effectively ranked pregnant Bedouin women into exposure groups based upon their habitual, pre-pregnancy intake of eight target nutrients. The study illustrates that for homogeneous minority groups in particular, it may be possible to identify short lists of main discriminating foods for target nutrients that effectively rank the population into multi-nutrient intake exposure levels. Such tools, due to their brevity, can also be combined with other dietary assessment instruments that provide different types of information (e.g. estimates of absolute nutrient intakes). These findings may have implications for more effectively studying diet–disease associations among ethnic minority groups.
Acknowledgements
This research was supported by a grant from the Israel National Institute for Health Services and Health Policy Research, and funds from the S. Daniel Abraham International Center for Health and Nutrition, Department of Epidemiology and Health Services Evaluation, Faculty of Health Sciences, Ben-Gurion University of the Negev, Israel. Manuscript preparation was supported by a post-doctoral grant from Mr Robert Arnow. The authors have no conflict of interest. K.A.-S. designed the study, analysed and interpreted the data, and wrote the initial draft of the manuscript. I.S. and D.F. assisted in designing the study, interpretation of the data, and preparing the manuscript. H.V. provided statistical advice and assistance, and assisted in interpretation of the data and preparation of the manuscript. I.B. assisted in interpretation of the data and preparation of the manuscript.


