


Chronic undernutrition prevails as a public health problem in sub-Saharan Africa and prevents countries and individuals from developing to their full capacity( Reference Rose, Blevins and Gonzalez-Calvo 1 , Reference de Onis and Branca 2 ). During the past decade, the scientific community has started paying more attention to the nutritional and health status of adolescents. Patton et al. concluded that the adolescent health situation is the worst in sub-Saharan Africa, with persisting high mortality due to maternal and infectious causes( Reference Patton, Coffey and Cappa 3 ). According to several human development indices, Mozambique is at a very low stage of human development( 4 ). Adolescent pregnancies are common and 48 % of girls are married before the age of 18 years( Reference Korkalo, Freese and Fidalgo 5 , 6 ). These issues threaten the health and development of this age group of girls, who also face the double burden of malnutrition. Indeed, both high prevalence of undernutrition (stunting, anaemia as well as poor Zn, vitamin A and iodine status)( Reference Korkalo, Freese and Fidalgo 5 , Reference Korkalo, Freese and Alfthan 7 ) and overweight( Reference Prista, Maia and Damasceno 8 ) have been reported among Mozambican adolescent girls.
The double burden of malnutrition may indicate a nutrition transition from receding famine towards a phase of increased non-communicable diseases via changes in dietary patterns (DP)( Reference Popkin 9 ). Nutrition transition arises from economic growth and urbanisation, and is characterised by reduced physical activity, a low intake of vegetables, and a supply of and preference for ‘fast foods’ or ‘Western-type’ foods( Reference Stupar, Eide and Bourne 10 , Reference Popkin, Adair and Ng 11 ). An increased consumption of foods high in fat, sugar and refined carbohydrates, but low in fibre and micronutrients, leads to problems of overnutrition and may finally also cause a rise in chronic diseases in sub-Saharan Africa( Reference Stupar, Eide and Bourne 10 , Reference Popkin, Adair and Ng 11 ). Mozambique is estimated to be at the early stage of a nutrition transition( Reference Abrahams, Mchiza and Steyn 12 ). Cross-sectional surveillance data from Mozambique have shown rural–urban differences in fruit and vegetable consumption( Reference Padrao, Laszczynska and Silva-Matos 13 ), BMI( Reference Gomes, Damasceno and Azevedo 14 ), hypertension( Reference Damasceno, Azevedo and Silva-Matos 15 ) and physical activity among adults( Reference Padrao, Damasceno and Silva-Matos 16 ).
Valid characterisation of the Mozambican diet is needed and a data-driven DP analysis is an effective tool to achieve this. Studying the diet as DP instead of single nutrients or foods has several advantages( Reference Hoffmann, Schulze and Schienkiewitz 17 , Reference Hu 18 ). Most importantly, while acknowledging that different foods are usually highly correlated with each other, DP analysis gives a more comprehensive reflection of the whole diet( Reference Hoffmann, Schulze and Schienkiewitz 17 , Reference Hu 18 ). Furthermore, investigating DP on the basis of food consumption data is a useful method in diverse cultural settings, where continual dynamic cultural transition may exist( Reference Delisle 19 ). Further, understanding the complexity of a diet in the context of a double burden of malnutrition is of interest in exploring how diet associates with actual nutritional status.
Research on DP has mainly focused on the associations with indicators of non-communicable diseases, in sub-Saharan Africa and other places( Reference Delisle 19 , Reference Frank, Kroger and Schulze 20 ). Only a few reports exist on DP as such or on their association with nutritional status indicators in sub-Saharan Africa( Reference Turyashemererwa, Kikafunda and Annan 21 – Reference Zeba, Delisle and Renier 23 ). Moreover, to our knowledge, no studies have focused on DP among adolescents in sub-Saharan countries. The objective of the present study was to investigate the characteristics of DP and to explore whether certain DP are associated with the nutritional status of Mozambican adolescent girls in a cross-sectional setting. The markers of nutritional status reflect body composition as well as micronutrient status in the present study.
Participants and methods
Setting and participants
The ZANE Study (Estudo do Estado Nutricional e da Dieta em Raparigas Adolescentes na Zambezia) was a population-based cross-sectional study. A target sample size of 600 girls was determined based on resources available. A detailed description of recruitment, sampling design and fieldwork methods has been published elsewhere( Reference Korkalo, Freese and Fidalgo 5 ). In brief, two separate samples of adolescent girls were recruited in the Zambézia Province, Central Mozambique, in 2010. The first sample was studied in January–February, the ‘hunger season’ (n 283), and the second in May–June, the harvest season (n 268). The sampling was carried out in five areas: (i) Quelimane City; (ii) the district town of Maganja da Costa; (iii) rural villages in Maganja da Costa; (iv) the district town of Morrumbala; and (v) rural villages in Morrumbala. Girls were recruited from a total of forty different localities within these five areas. The localities (neighbourhoods (bairros) or villages) were sampled using probability-proportional-to-size sampling (in the city and district towns, where population figures were available) or random sampling (in the rural areas where population figures were unknown). Within each locality, local recruiters were instructed to follow a recruitment plan while moving from house to house to recruit girls. In the current paper, we divided the area into two categories: (i) Quelimane City, which is referred to as ‘urban’; and (ii) district towns and rural villages, which is referred to as ‘rural districts’.
If the participant’s date of birth was not known, it was estimated with the help of family members. A total of 551 girls were studied. Herein we use the data on all girls who participated in an FFQ interview (n 547). These participants were adolescent girls aged 14–19 years.
Written informed consent was obtained from all participants and from their guardians if they were under 18 years of age at recruitment. The study was conducted according to the guidelines in the Declaration of Helsinki and all procedures involving human subjects were approved by the National Ethical Committee at the Ministry of Health in Mozambique. The study was registered at ClinicalTrials.gov (NCT01944891).
Background information and dietary assessment
A background interview and an FFQ interview were conducted( Reference Korkalo, Freese and Fidalgo 5 ). An asset score was calculated on the basis of the household’s ownership of items such as radios or bicycles, or other background variables such as type of sanitation facility (for details, see Korkalo et al.( Reference Korkalo, Erkkola and Heinonen 24 )). The interview included questions on whether the girl was pregnant or breast-feeding a child at the time of the interview. Literacy was defined as the ability to read a short test sentence in Portuguese. A Household Hunger Scale (HHS)( Reference Ballard, Coates and Swindale 25 ) score was calculated for each participant. The scale is based on three main questions, asking whether a specific condition of food insecurity ever occurred during the previous 4 weeks and the frequency of occurrence. For example, one question was: ‘Did you or any household member go to sleep at night hungry because there was not enough food?’ The possible range of the score is 0–6( Reference Ballard, Coates and Swindale 25 ). Score of 0–1 was categorised as little or no household hunger and 2–6 as moderate or severe household hunger.
For the present paper, we used information on the consumption frequency of all food items reported by 3 % or more of the participants (a total of fifty-three items). Of these, thirty-seven items were included in the FFQ and sixteen were derived from the FFQ’s empty lines reserved for additional foods mentioned by respondents during the interview( Reference Korkalo, Freese and Fidalgo 5 ). The additional sixteen items were juice, soft drinks, pineapples, oranges, tangerines, guavas, apples, jambalau fruit, potatoes, okra, green peppers, carrots, cucumbers, yams, taro and pasta. During the FFQ interview, participants were asked to estimate how many times they had consumed different foods during the past 7 d. They could choose from six categories: none, 1–2, 3–4, 5–6, 7 or >7 times/week. These were transformed into continuous frequency variables using the following values: 0, 1·5, 3·5, 5·5, 7 and 10. Portion sizes were not elicited.
Anthropometry and laboratory analyses
Height was measured using a stadiometer and recorded to the nearest 0·1 cm. Weight was measured using a digital scale and recorded to the nearest 100 g. Mid-upper arm circumference (MUAC) was measured twice using an inelastic circumference-measuring tape and recorded to the nearest 0·1 cm. The mean of two measurements was used. Triceps skinfold was measured using a Harpenden Skinfold Calliper (Baty International, UK). The anatomical site was carefully located and marked. Three measurements of the skinfold were taken without releasing the grasp of the skinfold. If the results varied by more than 1 mm, the measurements were repeated. The final value for the skinfold was the mean of the three measurements. BMI-for-age Z-scores (BMIZ) were generated with the statistical software package IBM SPSS Statistics version 22 using a macro provided by the WHO( 26 ). We used MUAC, triceps skinfold and BMIZ to reflect the fat mass of the body.
Pregnancy was tested from urine samples. If a pregnancy test result was not available, information from the background interview was used to define pregnancy status. Information on the trimester of pregnancy was not available. Venous blood samples (EDTA blood and serum) were drawn by laboratory technicians. Blood Hb concentration was tested using the HemoCue® 301 system. Serum high-sensitivity C-reactive protein, ferritin and folate, as well as plasma retinol concentration were analysed at the National Institute for Health and Welfare, Finland (laboratory accredited by Finas T077 (EN ISO-IEC 17025)). Serum Zn concentration was analysed at MTT Agrifood Research Finland. A comprehensive description of blood analysis methods has been previously reported( Reference Korkalo, Freese and Alfthan 7 ). As infections may affect ferritin, retinol and Zn concentrations in the blood( 27 – Reference King 29 ), only results from those participants with a high-sensitivity C-reactive protein concentration less than 5 mg/l were included in the statistical analyses of these nutrients.
Statistical analyses
Missing values for asset score items, literacy, pregnancy and breast-feeding were imputed by hot deck imputation, using area (five categories) as a deck variable. In addition, missing values for FFQ items and HHS were imputed using area and season as deck variables. The number of missing values in the FFQ ranged from 0 for foods such as rice and thick maize porridge to 15 (3 %) for yam and taro. As missing values for anthropometric and biochemical variables were not imputed, the number of girls included in each analysis varied.
Principal component analysis was applied to create DP based on the consumption frequency data of the fifty-three food items. We created DP from foods only and did not include dietary supplements in the principal component analysis. Principal component analysis retained sixteen DP with an eigenvalue greater than 1. The first four DP were initially chosen on the basis of a scree plot. The analysis was then rerun with a forced four-component solution and, to reduce correlation between components, Varimax (orthogonal) rotation was applied. After this, the first three DP were interpretable and were chosen for analysis. A standardised regression-based DP score was calculated for each girl for each of the components identified. This represents the girl’s adherence to each DP.
One-way ANOVA and independent t tests were used to test the associations between background indicators and DP scores. Multivariate models were used to examine the associations of DP scores with nutritional status indicators. This was done using two-level random-intercept linear regression models, taking the clustering of participants in localities into account. Locality (n 40) was treated as the higher-level unit and the individual girls as the lower-level unit. All models were adjusted for age, season, breast-feeding status and pregnancy status. An exception was the model for BMIZ, which excluded pregnant girls and was adjusted only for season and breast-feeding status. The number of girls who reported consumption of any type of dietary supplements was small (n 17) and therefore we did not adjust the models for use of dietary supplements. The two-level regression analyses were carried out using the statistical software package SAS version 9.4 (proc mixed covtest) and all other analyses were conducted using IBM SPSS Statistics version 22. P values of <0·05 were considered significant.
Results
The mean age of the participants was 16 years (range 14–19 years). The mean age of the non-pregnant girls was 16 years and of the pregnant girls, 17 years. Participants’ characteristics are presented in Table 1 and statistics of the nutritional status indicators are presented in Table 2.
Table 1 Descriptive information of participating adolescent girls from Central Mozambique (n 547)Footnote *, the ZANE Study (Estudo do Estado Nutricional e da Dieta em Raparigas Adolescentes na Zambezia), 2010
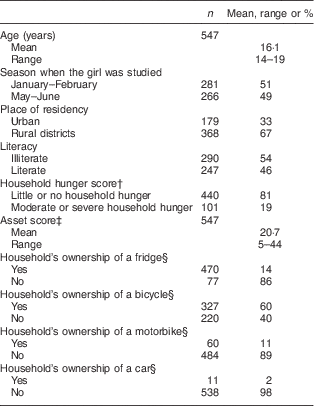
* Note that n does not always add up to 547 due to missing data.
† Based on questions on the experience of household food deprivation during the past month (for details see Ballard et al. ( Reference Ballard, Coates and Swindale 25 )).
‡ The mean asset score was calculated using data that include imputed values for missing items. Theoretical score minimum and maximum were 0 and 45 (for details see Korkalo et al. ( Reference Korkalo, Erkkola and Heinonen 24 )).
§ Examples of items belonging to the asset score (without imputation of missing data).
Table 2 Nutritional status indicators of participating adolescent girls from Central Mozambique (n 547), the ZANE Study (Estudo do Estado Nutricional e da Dieta em Raparigas Adolescentes na Zambezia), 2010
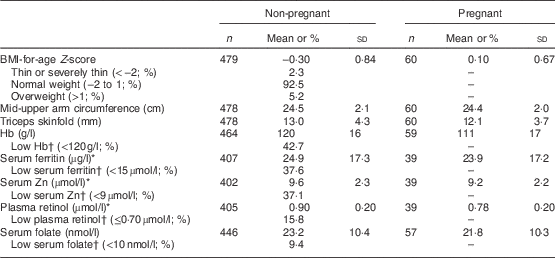
Dash (–) means not applicable.
* Includes only those participants with high-sensitivity C-reactive protein <5 mg/l.
† WHO cut-offs were used for Hb( 39 ), ferritin( 27 ), retinol( 28 ) and folate( 40 ), and the International Zinc Nutrition Consultative Group cut-off for Zn( Reference Brown and Rivera 41 ).
The three DP explained altogether 24 %, and the first, second and third DP explained 11, 7 and 7 % of the total variance in food frequencies, respectively. The first DP was characterised by high loadings of bread, tomatoes, onions, margarine & butter, rice, oil, sugar, potatoes, eggs, green peppers, soft drinks, juice, fish, sweets and buns, and was called ‘Urban bread and fats’ (Table 3). The second DP was characterised by foods such as meat, poultry, pumpkins, okra, organs, bananas, other cereals (sorghum, millet), cookies, maize cobs, groundnuts, papayas, boiled cassava, dark green leafy vegetables, beans & peas, and yam, and was called ‘Rural meat and vegetables’. The third DP was characterised by foods such as coconut, cassava porridge, mangoes, sweet potatoes, shrimps, cashew nuts and taro, and was called ‘Rural cassava and coconut’. DP scores ranged from −2·30 to 2·86 for the ‘Urban bread and fats’ DP, from −1·59 to 5·09 for the ‘Rural meat and vegetables’ DP and from −1·85 to 4·24 for the ‘Rural cassava and coconut’ DP.
Table 3 Factor loading matrix for dietary patterns identified by principal component analysis and Varimax rotationFootnote * among adolescent girls from Central Mozambique (n 547), the ZANE Study (Estudo do Estado Nutricional e da Dieta em Raparigas Adolescentes na Zambezia), 2010
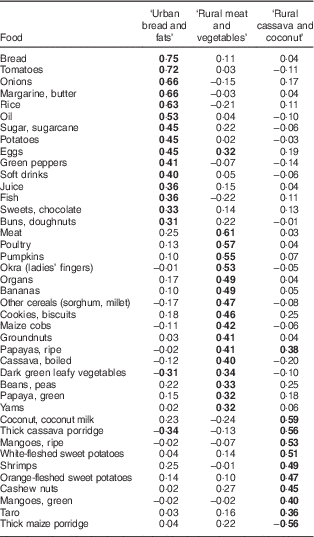
* For simplicity, foods with no factor loadings above 0·3 or below −0·3 are not shown. Factor loadings above 0·3 or below −0·3 are indicated in bold font.
Table 4 shows the mean DP scores according to sociodemographic characteristics. Girls who adhered to the ‘Urban bread and fats’ DP were more likely to live in an urban area, to be literate, to have little or no household hunger and to have higher asset scores than other girls. Strong adherence to the ‘Rural meat and vegetables’ DP was more evident among girls who lived in rural areas, who were illiterate and who had little or no household hunger. Girls strongly adhering to the ‘Rural cassava and coconut’ DP were more likely to have been studied in the hunger season (January–February) and to live in a rural area compared with other girls.
Table 4 Mean dietary pattern (DP) scores according to sociodemographic characteristics among adolescent girls from Central Mozambique (n 547)Footnote *, the ZANE Study (Estudo do Estado Nutricional e da Dieta em Raparigas Adolescentes na Zambezia), 2010
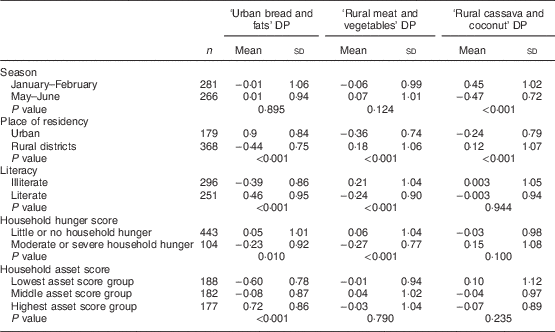
* Independent-samples t test and one-way ANOVA were used for significance testing.
The ‘Urban bread and fats’ DP was positively associated with BMIZ, MUAC, triceps skinfold and blood Hb concentration, and negatively associated with serum folate concentration (Tables 5 and 6). The ‘Rural meat and vegetables’ DP and the ‘Rural cassava and coconut’ DP were both negatively associated with BMIZ, MUAC and triceps skinfold. However, the ‘Rural meat and vegetables’ DP was positively associated with serum ferritin. None of the DP were associated with serum Zn or plasma retinol concentration.
Table 5 Linear two-level models of the associations between dietary patterns (DP) and anthropometric measurements among adolescent girls from Central Mozambique, the ZANE Study (Estudo do Estado Nutricional e da Dieta em Raparigas Adolescentes na Zambezia), 2010
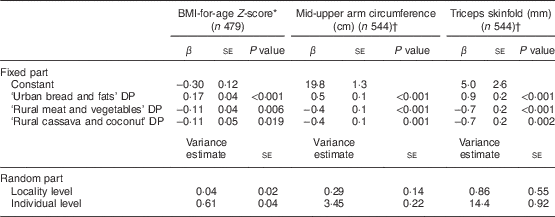
* Pregnant girls excluded from analysis. Adjusted for season and breast-feeding status (yes/no).
† Adjusted for age, season (January–February/May–June), pregnancy status (yes/no) and breast-feeding status (yes/no).
Table 6 Linear two-level models of the associations between dietary patterns (DP) and biochemical indicators of nutritional status among adolescent girls from Central Mozambique, the ZANE Study (Estudo do Estado Nutricional e da Dieta em Raparigas Adolescentes na Zambezia), 2010
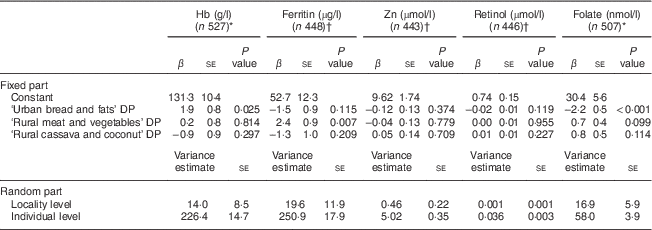
* Adjusted for age, season, pregnancy status (yes/no) and breast-feeding status (yes/no).
† Includes only those participants with high-sensitivity C-reactive protein<5 mg/l. Adjusted for age, season, pregnancy status (yes/no) and breast-feeding status (yes/no).
Discussion
To our knowledge, the current study is the first to examine whether DP are associated with anthropometric and biochemical indicators of nutritional status of adolescents in sub-Saharan Africa. We studied Mozambican girls in a cross-sectional setting and identified three DP: ‘Urban bread and fats’, ‘Rural meat and vegetables’ and ‘Rural cassava and coconut’. The ‘Urban bread and fats’ DP was associated with a higher blood Hb and anthropometric indices but was negatively associated with serum folate concentration. In contrast, the two different rural DP were negatively associated with anthropometric indices. The ‘Rural meat and vegetables’ DP was positively associated with serum ferritin concentration, whereas the ‘Rural cassava and coconut’ DP was not associated with any of the micronutrient status indicators studied. Our findings show that first, in our study population of adolescent girls living in poor socio-economic conditions, DP were strongly related to anthropometric indices of nutritional status. Second, the urban diet had concurrent negative and positive associations with nutritional status, while the rural diets had positive or no associations with micronutrient status. These results underscore that moving towards a more urban diet in Mozambique may compromise folate status.
Although food cultures differ in sub-Saharan Africa and dietary assessment methods vary among studies, the Mozambican DP had similar characteristics to those of DP identified elsewhere in sub-Saharan Africa. The ‘Urban bread and fats’ DP included refined energy-dense foods such as butter, sugar, soft drinks, sweets and buns, but also foods that are regarded as healthy, such as vegetables and fish. These findings are in line with previous reports from sub-Saharan Africa that have found DP called ‘Purchase’, ‘Urban’, ‘Fat’/’animal’, ‘Vegetables and bread’, ‘Snacking’ and ‘Wheat-based products’( Reference Frank, Kroger and Schulze 20 , Reference Keding, Msuya and Maass 22 , Reference Zeba, Delisle and Renier 23 , Reference Jordan, Hebestreit and Swai 30 – Reference Sewram, Sitas and O’Connell 33 ). Furthermore, similarly to our results, studies in Ghana and Burkina Faso found traditional DP that included fruits, green leafy vegetables, maize, local cereals and legumes( Reference Frank, Kroger and Schulze 20 , Reference Zeba, Delisle and Renier 23 ). In our study, the ‘Rural meat and vegetables’ DP correlated with frequent consumption of different meats and poultry, which are usually associated with urban dietary habits in sub-Saharan Africa( Reference Delisle 19 , Reference Zeba, Delisle and Renier 23 ). However, the girls in our study ate only very small amounts of meat and poultry (L Korkalo, unpublished results).
The classical nutrition transition from a ‘cereals predominant’ to a ‘more fat’ diet usually starts from urban surroundings and is related to increased adiposity( Reference Popkin 9 ). Our study was cross-sectional and thus does not describe a direct nutrition transition, which is a temporal process. Nevertheless, our results may offer some insight into the type of consequences that are likely to follow if the Mozambican population adopts more urban-type diets with a high intake of energy-dense foods and a low intake of nutrient-dense foods such as folate-rich green leafy vegetables and fruits. It has been suggested that some valuable traditional foods are partly lost in urbanised diets( Reference Delisle 19 ). Indeed, our finding of lower folate status associated with an urban diet is of concern due to the importance of folate for brain health during pregnancy and later life( Reference McGarel, Pentieva and Strain 34 ); and, more generally, because folate is a biomarker for vegetable and fruit consumption( Reference Van Dam and Hunter 35 ), which in turn is important in the prevention of non-communicable diseases.
In the context of our study population, the results showing that the urban diet had positive and the rural diets had negative associations with anthropometric indices of nutritional status are not as such comparable to results in highly developed countries with little or no undernutrition. The majority of our study participants were in the normal BMIZ range; the few overweight girls lived in an urban area. We found no obesity in this study population( Reference Korkalo, Freese and Fidalgo 5 ). Furthermore, stunting was prevalent in both the urban and the rural areas( Reference Korkalo, Freese and Fidalgo 5 ), suggesting that the population has suffered from undernutrition during childhood. On one hand, the positive association between the urban diet and the anthropometric indices reflecting body fat may indicate a risk of increase in overweight if this nutrition transition continues in the future. On the other hand, the ‘Rural cassava and coconut’ DP seemed more monotonous than the other DP and was dominated by starchy foods. Thus, the negative associations between rural DP and anthropometric indices could be viewed more as a sign of undernutrition than desirable leanness.
Poor Fe status, seen as low blood Hb and ferritin concentrations, was prevalent in our study. In this context, finding a positive relationship between the ‘Rural meat and vegetables’ DP and serum ferritin is important, as it highlights the valuable aspects of the rural diet. In contrast to our results, Zeba et al. reported inferior nutritional status measured as blood Hb, ferritin and retinol among adults with a traditional diet compared with the urban diet in Burkina Faso( Reference Zeba, Delisle and Renier 23 ). They suggested this was due to meat consumption in the urban diet and low bioavailability of these nutrients in the traditional diet( Reference Zeba, Delisle and Renier 23 ).
Our study had some limitations that should be noted. Applying DP analysis involves subjective decision making (selection of the food items to include in the principal component analysis and the choice of and naming of the DP)( Reference Hodge and Bassett 36 , Reference Willett 37 ). Using data-driven principal component analysis to retain DP also limits the generalisation of these results( Reference Hodge and Bassett 36 ). However, a previous study in twelve different countries, including two sub-Saharan countries, discovered two similar DP across all study sites despite the high variation in culture and economic development( Reference Mikkilä, Vepsäläinen and Saloheimo 38 ). Thus, it can be suggested that DP have significant similarities in diverse settings( Reference Delisle 19 ). As we used a large number of food items (fifty-three) to derive DP, the DP explained a moderate proportion (24 %) of the variance in diet. A similar proportion of variance explained was found in a previous study from sub-Saharan Africa( Reference Jordan, Hebestreit and Swai 30 ). Our FFQ was not validated and the possibility of misreporting food frequencies cannot be ruled out. Finally, due to the cross-sectional study design, we were unable to determine a causal relationship between DP and nutritional status. Nevertheless, our study also has some strengths. It covered two distinct seasons and different regions with diversified urbanisation levels. Thus, our data provide a good representation of the adolescent girls in Central Mozambique. The two-level statistical model used enabled us to reliably investigate the associations between diet and nutritional status.
Conclusion
To conclude, our study suggests that Mozambican adolescent girls are at risk of a double burden of malnutrition in urban areas. Micronutrient-rich foods from rural diets should not be discarded while moving towards a more urban diet. Adolescent girls and their future children would benefit from nutrition and health interventions.
Acknowledgements
Acknowledgements: The authors are grateful to all the fieldworkers and to Lourdes Fidalgo and Kerry Selvester from the Food Security and Nutrition Association (ANSA) in Maputo, Mozambique for making the ZANE Study possible. They highly appreciate Dr Vera Mikkilä’s advice on the data analysis. Most importantly, the authors thank the girls who participated in this study. Financial support: The Academy of Finland and Embassy of Finland in Maputo supported the fieldwork of the ZANE Study. During the preparation of this paper, L.K. received funding from the Finnish Concordia Fund. The Academy of Finland, Embassy of Finland in Maputo and Finnish Concordia Fund had no role in the design, analysis or writing of this article. Conflict of interest: None. Authorship: All authors contributed to the design of the study and participated in data acquisition; H.H.H., R.F. and L.K. performed the statistical analyses; H.H.H. wrote the first draft of the manuscript; all authors revised the manuscript and approved the final version of the manuscript. Ethics of human subject participation: This study was conducted according to the guidelines in the Declaration of Helsinki, and all procedures involving human subjects were approved by the National Ethical Committee at the Ministry of Health in Mozambique. Written informed consent was obtained from all participants and from their guardians if they were under 18 years of age at recruitment.


